Date: Wed Feb 01 2012 - 01:46:38 MST
in the script i use the xx = fspan(1,N,N) as the time .
if my data is like below(the time series includes two months and i only show a section)
| time | N | WSPD10(m/s) | WDIR10(DEGREES) |
| 1/01/8:00:00 | 1 | 7.216151 | 32.108917 |
| 1/01/9:00:00 | 2 | 8.962828 | 32.298248 |
| 1/01/10:00:00 | 3 | 9.295473 | 33.978973 |
| 1/01/11:00:00 | 4 | 9.472955 | 36.183746 |
| 1/01/12:00:00 | 5 | 9.411055 | 37.665436 |
| 1/01/13:00:00 | 6 | 9.293616 | 38.766541 |
| 1/01/14:00:00 | 7 | 9.138997 | 39.791779 |
| 1/01/15:00:00 | 8 | 8.930552 | 38.782135 |
| 1/01/16:00:00 | 9 | 8.597112 | 35.209473 |
| 1/01/17:00:00 | 10 | 8.098866 | 30.044861 |
| 1/01/18:00:00 | 11 | 6.489672 | 23.394623 |
| 1/01/19:00:00 | 12 | 6.111356 | 15.26236 |
| 1/01/20:00:00 | 13 | 5.767246 | 7.050354 |
| 1/01/21:00:00 | 14 | 5.382022 | 0.918671 |
| 1/01/22:00:00 | 15 | 4.988408 | 357.63855 |
| 1/01/23:00:00 | 16 | 4.361295 | 355.52597 |
| 3/02/0:00:00 | 17 | 3.632497 | 350.940887 |
| 3/02/1:00:00 | 18 | 2.982801 | 345.519257 |
| 3/02/2:00:00 | 19 | 2.258866 | 339.639832 |
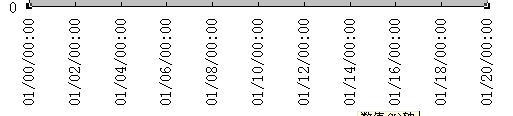
and how can i make the xaxis like this :
if i use the
res@tmXBMode = "Explicit"
res@tmXBValues = ispan(3,N,3)
res@tmXBLabels = (/"01/04/00:00,............................................/)
i have to define so much
how could i use the plot = gsn_csm_xy (wks,xx,s,res) ; create base plot
that the xx represent a lot of characters?
how can i change the script,thank you very much!
_______________________________________________
ncl-talk mailing list
List instructions, subscriber options, unsubscribe:
http://mailman.ucar.edu/mailman/listinfo/ncl-talk