Hi Nancy,
You can do it by using function codes along with a different font table
from the default one.
See example 14 here:
http://www.ncl.ucar.edu/Applications/text.shtml#ex14
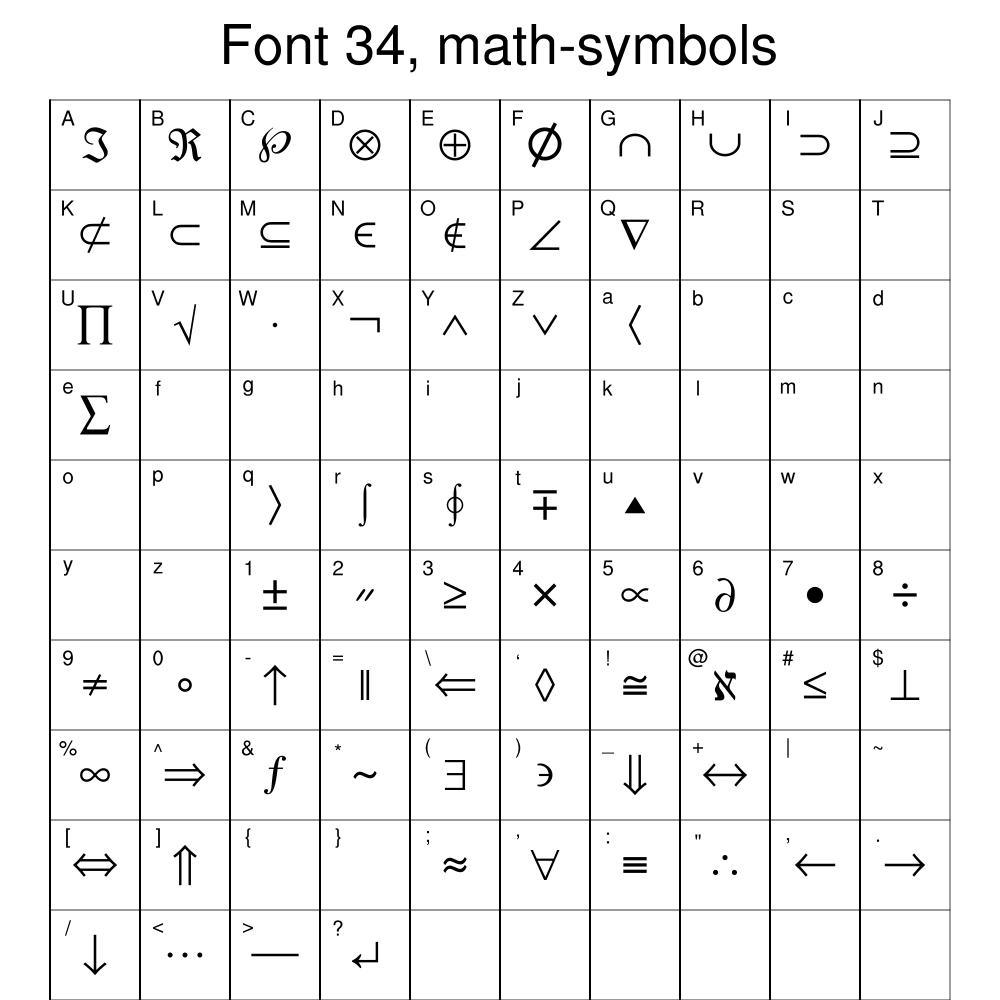
The best font table to use may be #34, as it has a few arrows in it:
http://www.ncl.ucar.edu/Document/Graphics/Images/font34.png
To draw an arrow you would do something like this:
txres = True
txres@txFontHeightF = 0.020
txres@txAngleF = 180. ; change angle of arrow (from right)
gsn_text_ndc(wks,"~F34~.",0.5,0.5,txres) ; . = draw arrow pointing
to right, but may rotate it
; using txAngleF
Hope that helps. If not, please respond to ncl-talk...
Adam
On 03/02/2012 03:35 AM, tzp2005011042 wrote:
> Hi, all,
> I want to add an arow between two point in my xy_plot, does anybody
> known how to do it?
> I'll be very appreciated for any advice.
> Nancy
>
>
>
>
> _______________________________________________
> ncl-talk mailing list
> List instructions, subscriber options, unsubscribe:
> http://mailman.ucar.edu/mailman/listinfo/ncl-talk
--
______________________________________________________________
Adam Phillips                                asphilli@ucar.edu
NCAR/Climate and Global Dynamics Division       (303) 497-1726
P.O. Box 3000
Boulder, CO 80307-3000    http://www.cgd.ucar.edu/cas/asphilli
_______________________________________________
ncl-talk mailing list
List instructions, subscriber options, unsubscribe:
http://mailman.ucar.edu/mailman/listinfo/ncl-talk
Received on Fri Mar 2 11:46:58 2012
This archive was generated by hypermail 2.1.8 : Mon Mar 05 2012 - 14:12:07 MST