Hi,
I am calculating eddy kinetic energy and writing it out in ascii file.
The problem that I am having is that when I am reading this ascii file
to make plots, the plots look weird. When I am plotting it out after
doing the calculation in the script in a script calculating kinetic
energy the plots looks fine. But when I am reading the same KE data from
an ascii file and making average of the two ascii files in program
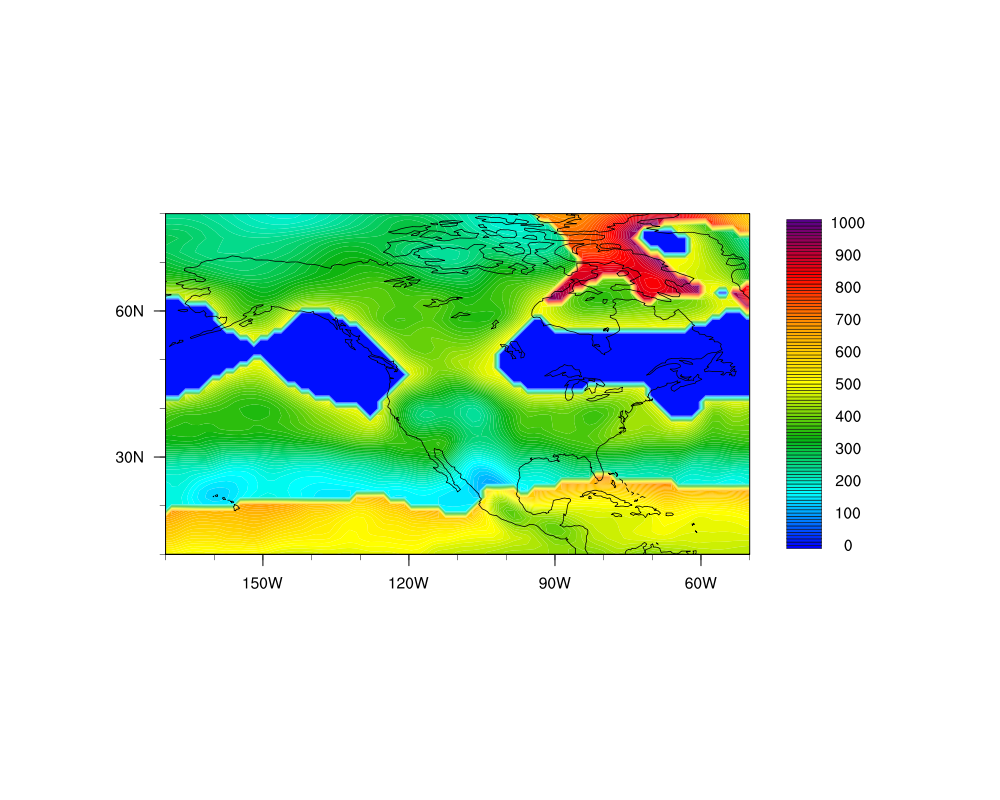
eke_plot_xseries1.ncl I am getting some odd looking plot.
I am attaching the program script, and two sample ascii files (eke_tes1
and eke_test2) and the weird plot showing the mean of the two ascii
files.
This is how I am writing the ascii files:
;*******************************************************
; Write monthly mean to ascii file
;*******************************************************
fmtx = "256f9.4"
opt_1 = True
opt_1@fout = "eke_test1"
write_matrix(eke_mon_avg,fmtx,opt_1)
When I am plotting this "eke_mon_avg" in this program it is fine.
Thanks,
Soumik
--
"Numbing the pain for a while will make it worse when you finally feel
it.
  ~J.K. Rowling"
*****************************************
Soumik Basu
Graduate Student, Research Assistant
International Arctic Research Center
University of Alaska Fairbanks
Fairbanks,Alaska,USA
*****************************************
_______________________________________________
ncl-talk mailing list
List instructions, subscriber options, unsubscribe:
http://mailman.ucar.edu/mailman/listinfo/ncl-talk
This archive was generated by hypermail 2.1.8 : Tue Mar 20 2012 - 15:27:15 MDT