Hi,
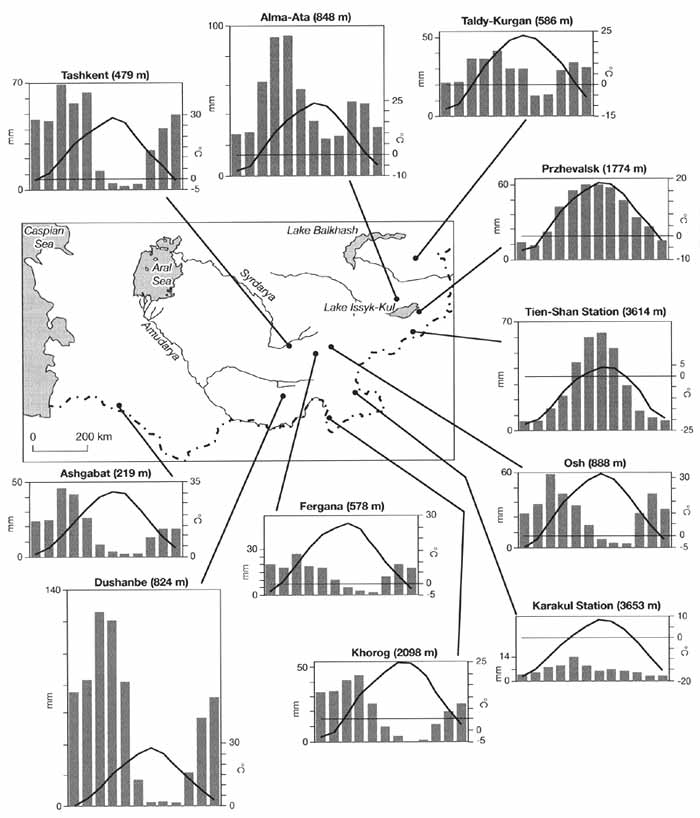
I am trying to make a plot like this one :
http://www.rusnature.info/reg/f16-5.jpg
I have looked through relevant examples on ncl website. I suppose I need to
use gsn_add_annotation to control the position of each plot on the map
(please let me know if there is a better way). How do I draw the line from
the position of each station to the plot?
Also, I have two sets of data for each station. Two sets of histograms
using left y-axis, and two curves using right y-axis. How can I set the
left vs. right y-axis for the histograms vs. curves?
Thanks!
_______________________________________________
ncl-talk mailing list
List instructions, subscriber options, unsubscribe:
http://mailman.ucar.edu/mailman/listinfo/ncl-talk
Received on Sun Mar 18 09:11:52 2012
This archive was generated by hypermail 2.1.8 : Tue Mar 20 2012 - 15:27:15 MDT