Date: Thu Apr 26 2012 - 08:47:40 MDT
Hi everyone,
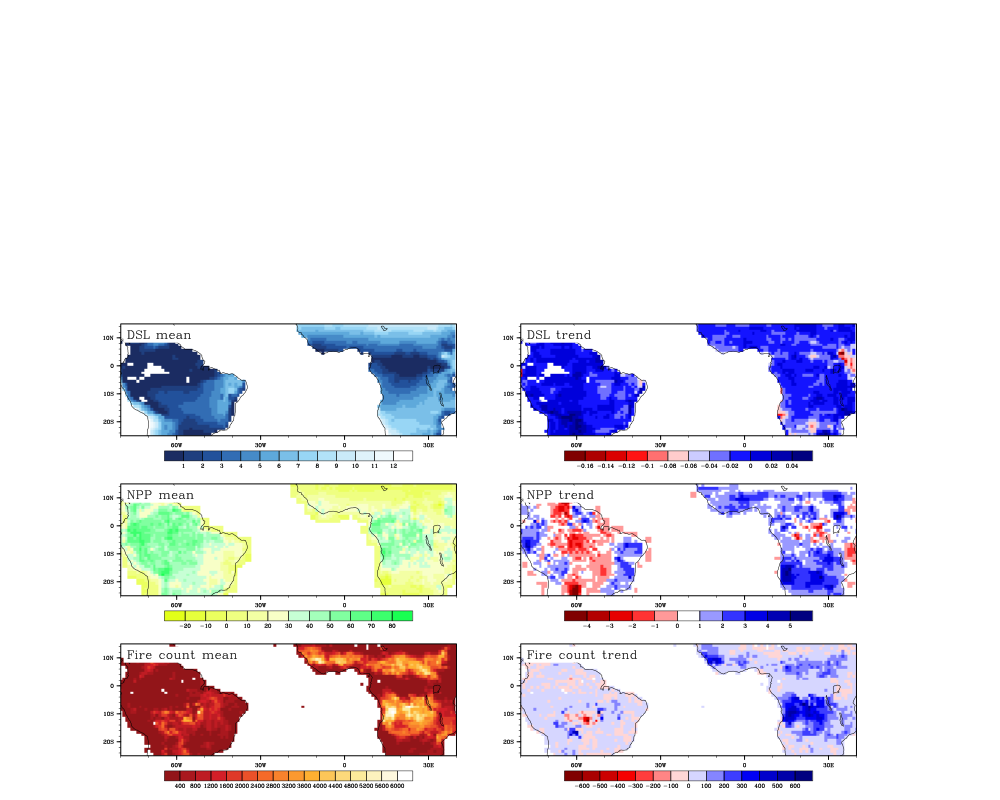
I've created a panel plot consisting of 6 maps, each using a different
colour table, based on the example panel_26.ncl from
http://www.ncl.ucar.edu/Applications/panel.shtml . Below is the relevant
part of the script (the data files are too big to attach here and
involve a lot of modification at the beginning of the script).
The problem I'm having is that each dataset has a different scale, and I
want to manually set the levels and the colours for each map, so that
certain colours fall at certain values (eg white at 0, red for negative
values etc.) I've attached what I've managed to produce so far, so
hopefully this question will make sense!
If anyone has any suggestions of a way to achieve this, it would be much
appreciated!
Thanks,
Imogen
wks = gsn_open_wks("png","dsl_npp_fire_mean_trend")
res = True
res@gsnDraw = False
res@gsnFrame = False
res@cnFillMode = "RasterFill"
res@gsnAddCyclic = True
res@mpOutlineOn = True
res@mpPerimOn = False
res@lbLabelBarOn = True
res@gsnLeftString = ""
res@gsnRightString = ""
res@cnLinesOn = False
res@cnFillOn = True
res@gsnSpreadColors = True
res@cnLevelSelectionMode = "AutomaticLevels"
nplots = 6
plots = new(nplots,graphic)
colormaps =
(/"WhiteBlue","GreenYellow","WhiteYellowOrangeRed","BlWhRe","BlWhRe","BlWhRe"/)
do n=0,nplots-1
gsn_define_colormap(wks,colormaps(n))
plots(n) = gsn_csm_contour_map(wks,data(n,:,:),res)
end do
pres = True
pres@gsnMaximize = False
pres@gsnFrame = False
pres@gsnPanelLabelBar = False
pres@pmLabelBarWidthF = 1
pres@gsnDraw = False
pplots = gsn_panel_return(wks,plots(0),(/1,1/),pres)
pres@gsnDraw = True
pres@gsnPanelLeft = 0.
pres@gsnPanelRight = 0.45
pres@gsnPanelTop = 1.
pres@gsnPanelFigureStringsPerimOn = False
pres@gsnPanelFigureStringsFontHeightF = 0.01
pres@amJust = "TopLeft"
fig_strs = (/"DSL mean","NPP mean","Fire count mean","DSL trend","NPP
trend","Fire count trend"/)
do n=0,2
gsn_define_colormap(wks,colormaps(n))
pres@gsnPanelFigureStrings = fig_strs(n)
pres@gsnPanelTop = 1-n*0.4
gsn_panel(wks,plots(n),(/1,1/),pres)
pres@txString = ""
end do
pres@gsnPanelLeft = 0.5
pres@gsnPanelRight = 0.95
pres@gsnPanelTop = 1.
do n=3,5
gsn_define_colormap(wks,colormaps(n))
pres@gsnPanelFigureStrings = fig_strs(n)
pres@gsnPanelTop = 1-(n-3)*0.4
gsn_panel(wks,plots(n),(/1,1/),pres)
res@gsnSpreadColors = True
pres@txString = ""
end do
frame(wks)
_______________________________________________
ncl-talk mailing list
List instructions, subscriber options, unsubscribe:
http://mailman.ucar.edu/mailman/listinfo/ncl-talk