Date: Thu May 24 2012 - 10:54:09 MDT
Hi Mark,
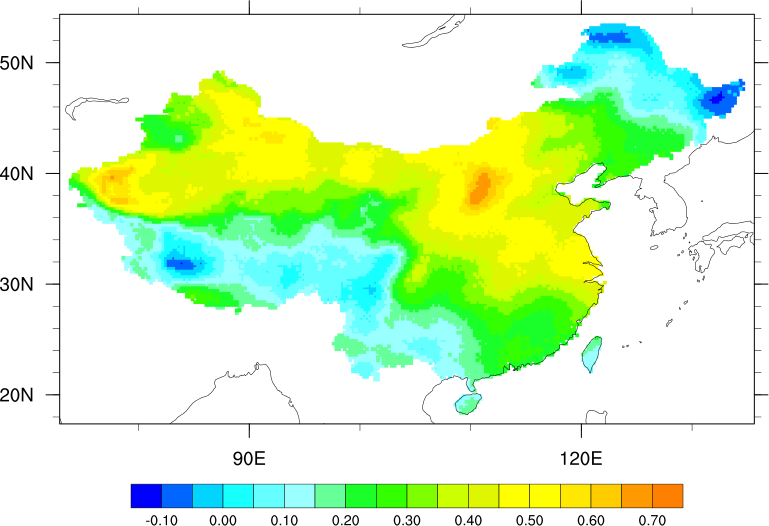
I think If you don't provide the bounds of your random data, then NCL is going to interpolate outside the area
You may be better of just creating a map, and then attaching colored markers to it. The markers can be colored based on what range they fall in.
Please see the attached script and PNG. You can play with the size of the markers via the gsMarkerSizeF resource.
--Mary
On May 24, 2012, at 9:49 AM, Mark Chan wrote:
> > begin
> > fname = "vec.dat"
> > lines = asciiread(fname,-1,"string")
> > lon = stringtofloat(str_get_field(lines(1:),1," "))
> > lat = stringtofloat(str_get_field(lines(1:),2," "))
> > pwv = stringtofloat(str_get_field(lines(1:),3," "))
> > delete(lines)
> >
> > wks = gsn_open_wks("x11","station")
> > gsn_define_colormap(wks,"gui_default")
> >
> > res = True
> > res@cnFillOn = True
> > res@gsnSpreadColors = True
> > res@lbLabelBarOn = True
> > res@cnLinesOn = False
> > res@cnLineLabelsOn = False
> > res@lbLabelAutoStride = True
> > res@cnFillMode = "RasterFill"
> >
> > res@sfXArray = lon
> > res@sfYArray = lat
> >
> > res@mpMinLatF = min(lat)-1
> > res@mpMinLonF = min(lon)-1
> > res@mpMaxLatF = max(lat)+1
> > res@mpMaxLonF = max(lon)+1
> > map = gsn_csm_contour_map(wks,pwv,res)
> > end
> >
_______________________________________________
ncl-talk mailing list
List instructions, subscriber options, unsubscribe:
http://mailman.ucar.edu/mailman/listinfo/ncl-talk
- application/octet-stream attachment: vec_mod.ncl