Date: Thu Jun 07 2012 - 16:20:56 MDT
Thank you very much
The sample example is great.
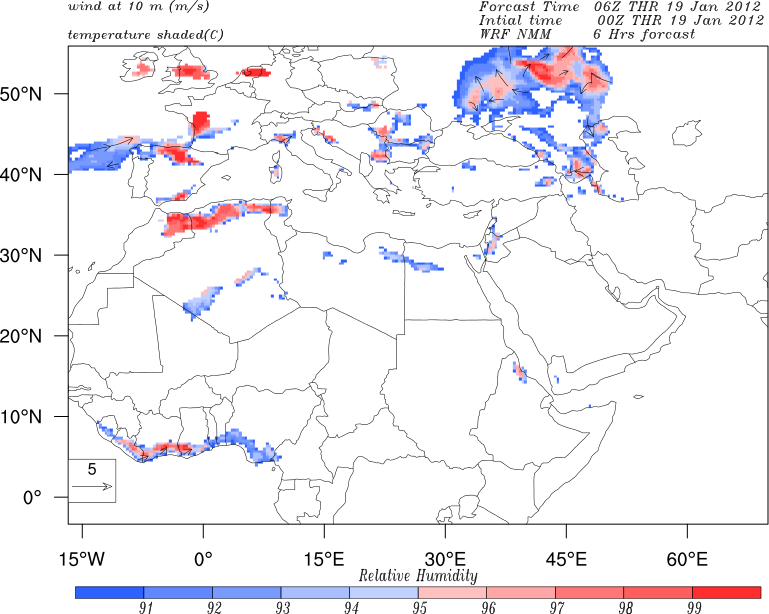
I have attached the intersection for the previous image .
I have edited the code as you said.
;;masking the RH
rh_only = rh ; trick to keep cv's and atts
rh_only = mask(rh,(rh.ge.90),True) ; all unsatisfied point will be
missing value
;; masking the u and v
u=mask(u,wind.lt.5.,True) ; all unsatisfied points will be missing values
v=mask(v,wind.lt.5.,True)
;; finding the intersection of the masked Rh and u ,v
u_rh=where(.not.ismissing(rh_only).and..not.ismissing(u),100,-999)
u_rh@_FillValue=-999
rh_only = where(ismissing(u_rh),rh_only@_FillValue,rh_only)
u = where(ismissing(u_rh),u@_FillValue,u)
v = where(ismissing(u_rh),v@_FillValue,v)
thanks
On Thu, Jun 7, 2012 at 10:35 PM, Adam Phillips <asphilli@ucar.edu> wrote:
> Hi Ahmed,
> You can use the where function to do this. A simple example:
> a = (/1,2,3,-999/)
> a@_FillValue = -999
> b = (/1,2,-999,4/)
> b@_FillValue = -999
> c = where(.not.ismissing(a).and..not.ismissing(b),100,-999) ; where both
> arrays are not missing, set to 100
> c@_FillValue = -999
> print(c)
>
> you can then use c to mask out a and b:
>
> a = where(ismissing(c),a@_FillValue,a)
> b = where(ismissing(c),b@_FillValue,b)
>
> Finally, I would suggest setting cnFillMode = "RasterFill" for your RH
> plot, so that you can see each individual grid cell that meets your > 90%
> criteria. The default, "AreaFill", will not necessarily show all grid
> cells, especially if there are numerous neighboring grid boxes that are
> missing.
>
> Hope that helps,
> Adam
>
>
> On 06/07/2012 12:16 PM, ahmed lasheen wrote:
>
> Hello
> I am trying to plot images for the fog , I am plotting both 10 m wind and
> relative humidity that satisfy certain condition for fog creation(for
> example RH > 90% and wind < 5 m/s).
> I used mask function for drawing them with these criteria .and I used the
> overlay function to plot both contours.
> I wondering if there is a method to plot the intersection of two masked
> contours.(drawing overlapping contour when both criteria exist)
> so that the resulted intersection represent fog directly.
> I have attached plot for overlapping wind and RH that I need to find way
> for plotting only the intersection between both contours.
> thanks in advance
>
>
> --
> ===============
> Ahmed Lasheen
> Junior researcher at Cairo Numerical Weather Prediction Center (CNWPC)
> Egyptian Meteorological Authority(EMA)
> Cairo,Egypt
> ===============
>
>
>
> _______________________________________________
> ncl-talk mailing list
> List instructions, subscriber options, unsubscribe:http://mailman.ucar.edu/mailman/listinfo/ncl-talk
>
>
> --
> ______________________________________________________________
> Adam Phillips asphilli@ucar.edu
> NCAR/Climate and Global Dynamics Division (303) 497-1726
> P.O. Box 3000
> Boulder, CO 80307-3000 http://www.cgd.ucar.edu/cas/asphilli
>
>
>
>
> _______________________________________________
> ncl-talk mailing list
> List instructions, subscriber options, unsubscribe:
> http://mailman.ucar.edu/mailman/listinfo/ncl-talk
>
>
--
===============
Ahmed Lasheen
Junior researcher at Cairo Numerical Weather Prediction Center (CNWPC)
Egyptian Meteorological Authority(EMA)
Cairo,Egypt
===============
_______________________________________________
ncl-talk mailing list
List instructions, subscriber options, unsubscribe:
http://mailman.ucar.edu/mailman/listinfo/ncl-talk