Thanks for reply Dennis,
It seems the difference between your result and mine is on the wind anomaly calculation. In your case, you first accumulated the data into one file and then calculated the anomaly. Could you post here how did you create fili = vName+".1970-2012."+lev+".nc" ; input file with daily means
Last time, I read the daily mean by the code given below. It may not be correct.
Thanks again for help,
Regards,
Joeky
---------
var = "uwnd" ; name of file
vName = "U" ; name for plots
fili = var+".day.mean.nc" ; input file
;========================
; get list of all files and open as "one big file"
;========================
all_files = systemfunc ("ls ./Reana1/uwnd/uwnd*.nc")
f = addfiles (all_files, "r") ; note the "s" of addfile
print(all_files)
;========================
; choose how files are combined and read in variable across files
;========================
ListSetType (f, "cat") ; concatenate or "merge" (default)
;***********************************************************
; Read user specified time and create required yyyyddd
;***********************************************************
time = f[:]->time ; all times on file
ymd = cd_calendar(time, -2) ; yyyymmdd
iStrt = ind(ymd.eq.ymdStrt) ; index start
iLast = ind(ymd.eq.ymdLast) ; index last
delete(time)
delete(ymd)
;***********************************************************
; Read user specified time and create required yyyyddd
;***********************************************************
time = f[:]->time(iStrt:iLast) ; time:units = "hours since"
TIME = cd_calendar(time, 0) ; type float
year = floattointeger( TIME(:,0) )
month = floattointeger( TIME(:,1) )
day = floattointeger( TIME(:,2) )
ddd = day_of_year(year, month, day)
yyyyddd = year*1000 + ddd ; needed for input
;***********************************************************
; Read data: short2flt
;***********************************************************
x = short2flt(f[:]->$var$(iStrt:iLast,{lev},:,:)) ; convert to float
printVarSummary(x)
________________________________
From: Dennis Shea <shea_at_ucar.edu>
To: juki juki <juky_emc2_at_yahoo.com>
Cc: NCL Talk <ncl-talk_at_ucar.edu>
Sent: Thursday, June 7, 2012 11:15 PM
Subject: Re: [ncl-talk] Wind anomaly, MJO_PC_INDEX and MJO clivar
I reran *all* the 'MJO Clivar' diagnostics. Everything works correctly.
[1] downloaded the NCEP data from the website below. Period 1979-2011
[2] computed the anomalies. These are *slightly* different due to
different climatological base periods (1980-2005 and 1979-2011).
[3] redid all the computations and plots
If the daily anomalies are computed correctly, everything works as in
the examples.
---
I have placed the anomalies and the scripts used in an ftp area.
ftp ftp.cgd.ucar.edu
anonymous
email
cd pub/shea/MJO
prompt
mget *
quit
---
The files and sizes are:
2636 Jun 7 07:52 mjoclicar_10.ncl
4786 Jun 7 07:52 mjoclivar_11.ncl
7275 Jun 7 07:52 mjoclivar_12.ncl
11249 Jun 7 07:52 mjoclivar_13.ncl
12992 Jun 7 07:52 mjoclivar_14.ncl
6635 Jun 7 07:57 mjoclivar_15.ncl
9302 Jun 7 08:03 mjoclivar_16.ncl
10530 Jun 7 07:52 mjoclivar_2.ncl
10374 Jun 7 07:52 mjoclivar_2.olr.ncl
10530 Jun 7 07:52 mjoclivar_2.uwnd_200.ncl
10530 Jun 7 07:52 mjoclivar_2.uwnd_850.ncl
10530 Jun 7 07:52 mjoclivar_2.vwnd_200.ncl
10530 Jun 7 07:52 mjoclivar_2.vwnd_850.ncl
8361 Jun 7 07:52 mjoclivar_3.ncl
3169 Jun 7 07:52 mjoclivar_4.ncl
2876 Jun 7 07:52 mjoclivar_5.ncl
5199 Jun 7 07:52 mjoclivar_6.ncl
2750 Jun 7 07:52 mjoclivar_7.ncl
8678 Jun 7 07:52 mjoclivar_8.ncl
7137 Jun 7 07:52 mjoclivar_9.ncl
37400 Jun 7 07:43 MJO_PC_INDEX.nc
1013804160 Jun 7 07:43 olr.day.anomalies.1979-2011.nc
615513004 Jun 7 07:43 pregpcp19962008.daily.nc
350655700 Jun 7 07:44 TRMM.200006-200109.thin.nc
1013804216 Jun 7 07:44 uwnd.day.anomalies.1979-2011.200.nc
1013804216 Jun 7 07:44 uwnd.day.anomalies.1979-2011.850.nc
1013804216 Jun 7 07:45 vwnd.day.anomalies.1979-2011.200.nc
1013804216 Jun 7 07:45 vwnd.day.anomalies.1979-2011.850.nc
On 6/6/12 3:15 AM, juki juki wrote:
> Thanks for reply Dennis.
>
>>What datasets were used?
>
> As in the website
> (http://www.ncl.ucar.edu/Applications/mjoclivar.shtml), I used
> http://www.esrl.noaa.gov/psd/data/gridded/data.ncep.reanalysis.html, for
> example for wind I used daily wind data
> (http://www.esrl.noaa.gov/psd/cgi-bin/db_search/DBListFiles.pl?did=32&tid=34020&vid=666
> <http://www.esrl.noaa.gov/psd/cgi-bin/db_search/DBListFiles.pl?did=32&tid=34020&vid=666>).
>
> For calculating the anomaly, I just simply modified mjoclivar_2.ncl.
> What I worried is about accumulating the daily data and then calculated
> anomaly from accumulated data. If anomaly is calculated from daily data
> (not from accumulated data) and then daily caclculated anomaly was
> accumulated, of course, the result will be different if it is calculated
> from accumulated data.
>
> All plot for OLR is the same as the example, only for wind is different
> and as we know olr data already accumulated by NOAA, but not the case
> for wind. Please see the code I used below.
>
> Again, thank you.
>
>
> Regards,
> Joeky
>
> -----the code
>
> load "$NCARG_ROOT/lib/ncarg/nclscripts/csm/gsn_code.ncl"
> load "$NCARG_ROOT/lib/ncarg/nclscripts/csm/gsn_csm.ncl"
> load "$NCARG_ROOT/lib/ncarg/nclscripts/csm/contributed.ncl"
>
> begin
> ;-------------------------------------------------------------
> ; User specifications
> ;-------------------------------------------------------------
> NC = True ; create netCDF?
> PLOT = False ; sample plots?
>
> ymdStrt = 19800101 ; start yyyymmdd
> ymdLast = 20120303 ; last
> yrStrt = ymdStrt/10000
> yrLast = ymdLast/10000
> lev = 200 ; desired level
> nhar = 4 ; number of fourier comp
>
> var = "uwnd" ; name of file
> vName = "U" ; name for plots
> fili = var+".day.mean.nc" ; input file
>
> ;========================
> ; get list of all files and open as "one big file"
> ;========================
> all_files = systemfunc ("ls ./Reana1/uwnd/uwnd*.nc")
> f = addfiles (all_files, "r") ; note the "s" of addfile
> print(all_files)
> ;========================
> ; choose how files are combined and read in variable across files
> ;========================
> ListSetType (f, "cat") ; concatenate or "merge" (default)
>
> if (NC) then
> diro= "./Anom/" ; output dir
> filo= var+".day."+lev+".anomalies."+yrStrt+"-"+yrLast+".nc" ; output file
> end if
>
> if (PLOT) then
> wksType = "ps"
> wksName = "mjoclivar" ; "mjo."+yrStrt+"_"+yrLast
> end if
>
> ;***********************************************************
> ; Read user specified time and create required yyyyddd
> ;***********************************************************
> ; f = addfile (diri+fili , "r")
>
> time = f[:]->time ; all times on file
> ymd = cd_calendar(time, -2) ; yyyymmdd
> iStrt = ind(ymd.eq.ymdStrt) ; index start
> iLast = ind(ymd.eq.ymdLast) ; index last
> delete(time)
> delete(ymd)
>
> ;***********************************************************
> ; Read user specified time and create required yyyyddd
> ;***********************************************************
> time = f[:]->time(iStrt:iLast) ; time:units = "hours since"
> TIME = cd_calendar(time, 0) ; type float
> year = floattointeger( TIME(:,0) )
> month = floattointeger( TIME(:,1) )
> day = floattointeger( TIME(:,2) )
> ddd = day_of_year(year, month, day)
> yyyyddd = year*1000 + ddd ; needed for input
>
> ;***********************************************************
> ; Read data: short2flt
> ;***********************************************************
> x = short2flt(f[:]->$var$(iStrt:iLast,{lev},:,:)) ; convert to float
> printVarSummary(x)
>
> ;***********************************************************
> ; Compute daily climatology: raw and then 'smoothed'
> ;***********************************************************
> xClmDay = clmDayTLL(x, yyyyddd) ; daily climatology at each grid point
> printVarSummary(xClmDay)
>
> ;***********************************************************
> ; Compute smoothed daily climatology using 'nhar' harmonics
> ;***********************************************************
> xClmDay_sm = smthClmDayTLL(xClmDay, nhar)
> printVarSummary(xClmDay_sm)
>
> ;***********************************************************
> ; Compute daily anomalies using raw and smoothed climatologies
> ;***********************************************************
> xAnom = calcDayAnomTLL (x, yyyyddd, xClmDay)
> printVarSummary(xAnom)
> printMinMax(xAnom, True)
>
> xAnom_sm = calcDayAnomTLL (x, yyyyddd, xClmDay_sm)
> xAnom_sm_at_long_name = "Anomalies from Smooth Daily Climatology"
> printVarSummary(xAnom_sm)
> printMinMax(xAnom_sm, True)
>
> delete( x ) ; no longer needed
>
>
> ;***********************************************************
> ; Create netCDF: convenience use 'simple' method
> ;***********************************************************
>
> dimx = dimsizes(xAnom)
> ntim = dimx(0)
> nlat = dimx(1)
> mlon = dimx(2)
>
> if (NC) then
>
> lat = f[0]->lat
> lon = f[0]->lon
>
> system("/bin/rm -f "+diro+filo) ; rm any pre-exist file, if any
> fnc = addfile (diro+filo, "c")
>
> filAtt = 0
> filAtt_at_title = vName+": Daily Anomalies: "+yrStrt+"-"+yrLast
> filAtt_at_source_file = fili
> filAtt_at_creation_date = systemfunc("date")
> fileattdef( fnc, filAtt ) ; copy file attributes
>
> setfileoption(fnc,"DefineMode",True)
> varNC = vName+"_anom"
> varNC_sm = vName+"_anom_sm"
>
> dimNames = (/"time", "lat", "lon"/)
> dimSizes = (/ -1 , nlat, mlon/)
> dimUnlim = (/ True , False, False/)
> filedimdef(fnc,dimNames,dimSizes,dimUnlim)
>
> filevardef(fnc, "time" ,typeof(time),getvardims(time))
> filevardef(fnc, "lat" ,typeof(lat) ,getvardims(lat))
> filevardef(fnc, "lon" ,typeof(lon) ,getvardims(lon))
> filevardef(fnc, varNC ,typeof(xAnom) ,getvardims(xAnom))
> filevardef(fnc, varNC_sm,typeof(xAnom) ,getvardims(xAnom))
>
> filevarattdef(fnc,"time" ,time) ; copy time attributes
> filevarattdef(fnc,"lat" ,lat) ; copy lat attributes
> filevarattdef(fnc,"lon" ,lon) ; copy lon attributes
> filevarattdef(fnc,varNC ,xAnom)
> filevarattdef(fnc,varNC_sm,xAnom_sm)
>
> fnc->time = (/time/)
> fnc->lat = (/lat/)
> fnc->lon = (/lon/)
> fnc->$varNC$ = (/xAnom /)
> fnc->$varNC_sm$ = (/xAnom_sm/)
> end if
>
> ;************************************************
> ; plotting parameters
> ;************************************************
> if (PLOT) then
> LAT = (/ 60, 45, 5, -5, -45, 60 /)
> LON = (/270, 30, 90, 90, 180, 0 /)
> nPts = dimsizes( LAT )
>
> plot = new ( nPts, graphic)
> data = new ( (/2,366/), typeof(xClmDay), getFillValue(xClmDay))
>
> wks = gsn_open_wks (wksType,wksName)
>
> res = True ; plot mods desired
> res_at_gsnDraw = False
> res_at_gsnFrame = False
> res_at_trXMinF = 1
> res_at_trXMaxF = 366
> ;res_at_tiMainString = ""
> res_at_xyLineThicknesses = (/1.0, 2.0/) ; make 2nd lines thicker
> res_at_xyLineColors = (/"blue","red"/) ; change line color
> res_at_xyMonoDashPattern = True ; all solid
>
> do np=0,nPts-1
> data(0,:) = xClmDay(:,{LAT(np)},{LON(np)})
> data(1,:) = xClmDay_sm(:,{LAT(np)},{LON(np)})
> res_at_gsnCenterString = "lat="+LAT(np)+" lon="+LON(np)
> plot(np) = gsn_csm_y (wks,data,res) ; create plot
> end do
> resP = True ; modify the panel plot
> resP_at_txString = vName+": Raw/Smooth Daily Climatology: "+yrStrt+"-"+yrLast
> resP_at_gsnMaximize = True
> resP_at_gsnPaperOrientation = "portrait"
> gsn_panel(wks,plot,(/(nPts/2),2/),resP) ; now draw as one plot
>
> ;==========
> ; Plot anomalies for an arbitrarily selected near equatorial location
> ; Time: Oct 1, 1996 to April 1,1997 [arbitrary selection]
> ;==========
> LATX = 0
> LONX = 90
>
> yyyymmdd = cd_calendar(time, -2)
> ;;yrfrac = yyyymmdd_to_yyyyfrac (yyyymmdd, 0)
> ;;delete(yrfrac_at_long_name)
>
> xAnom_at_long_name = "Anomalies from Raw" ; short labels for plot
> xAnom_sm_at_long_name = "Anomalies from Smooth"
>
> ntBegin = ind(yyyymmdd.eq.20011001)
> ntEnd = ind(yyyymmdd.eq.20020401)
> monthLabels = (/1,4,7,10/)
> monNam = (/"Jan","Feb","Mar","Apr","May","Jun" \
> ,"Jul","Aug","Sep","Oct","Nov","Dec" /)
> xVal = new(ntim, typeof(xAnom&time) , "No_FillValue") ; bigger than
> xLab = new(ntim, "string", "No_FillValue") ; needed
> xValm = new(ntim, typeof(xAnom&time) , "No_FillValue") ; bigger than
>
> ntm = -1
> cr = inttochar(10) ; carriage return
> do nt=ntBegin,ntEnd
> if (day(nt).eq.1) then
> ntm = ntm + 1
> xVal(ntm) = xAnom&time(nt)
> xLab(ntm) = monNam(month(nt)-1)
> if (month(nt).eq.1) then
> xLab(ntm) = xLab(ntm) + cr +sprinti("%0.4i", year(nt))
> end if
> end if
> end do
>
> rxy = True
> rxy_at_gsnDraw = False
> rxy_at_gsnFrame = False
> rxy_at_gsnYRefLine = 0.0 ; create a reference line
> rxy_at_gsnAboveYRefLineColor = "red" ; above ref line fill red
> rxy_at_gsnBelowYRefLineColor = "blue" ; below ref line fill blue
> rxy_at_xyLineThicknessF = 2.0
> rxy_at_vpHeightF = 0.4 ; resize
> rxy_at_vpWidthF = 0.8
> rxy_at_tmXBMode = "Explicit"
> rxy_at_tmXBValues = xVal(0:ntm)
> rxy_at_tmXBLabels = xLab(0:ntm)
>
> plot(0) = gsn_csm_xy (wks,time(ntBegin:ntEnd) \
> ,xAnom(ntBegin:ntEnd,{0},{90}),rxy)
> plot(1) = gsn_csm_xy (wks,time(ntBegin:ntEnd) \
> ,xAnom_sm(ntBegin:ntEnd,{0},{90}),rxy)
> resP_at_txString = vName+": Anomalies: (0,90E)"
> gsn_panel(wks,plot(0:1),(/2,1/),resP)
>
> end if
> end
>
> ------------------------------------------------------------------------
> *From:* Dennis Shea <shea_at_ucar.edu>
> *To:* juki juki <juky_emc2_at_yahoo.com>
> *Cc:* NCL Talk <ncl-talk_at_ucar.edu>
> *Sent:* Wednesday, June 6, 2012 11:20 AM
> *Subject:* Re: [ncl-talk] Wind anomaly, MJO_PC_INDEX and MJO clivar
>
> The real key is the daily anomalies. If they are not correct, none
> of the MJO diagnostics are correct. You should look very carefully
> at how the anomalies were generated. What datasets were used?
> For debugging and testing, use a smaller temporal sample and
> plot the data.
>
>
> On 6/3/12 10:58 PM, juki juki wrote:
> > Dear All;
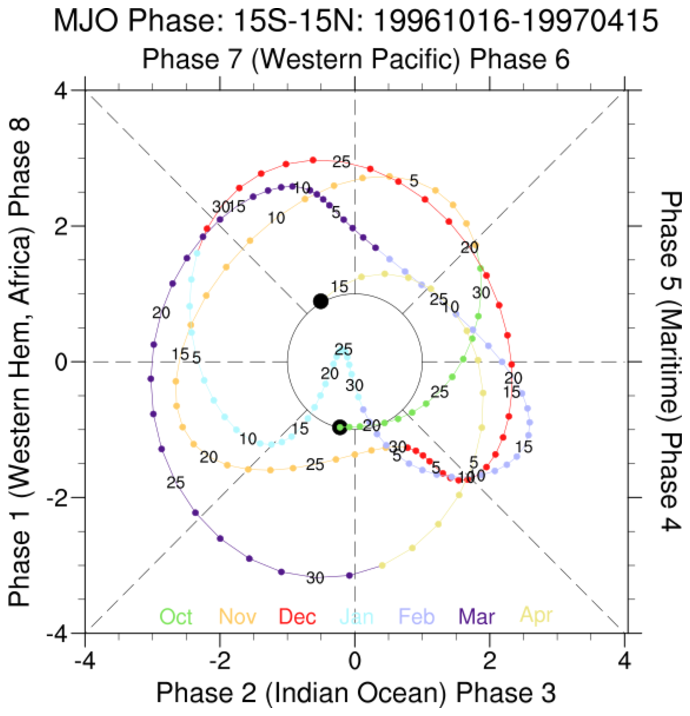
> > As my previous email that I would like to plot MJO phase diagram by
> > usinghttp://www.ncl.ucar.edu/Applications/Scripts/mjoclivar_15.ncl. To
> > see the performance of the code, first I plot same data period as in the
> > website. The result is very different from the example
> > (http://www.ncl.ucar.edu/Applications/Images/mjoclivar_15_lg.png) in
> > which the location of all MJO phases for all months is different from
> > that in the website.
> > Thus, my MJO_PC_INDEX.nc <http://MJO_PC_INDEX.nc>
> <http://mjo_pc_index.nc/> may NOT be correct.
> > As we know the input of mjoclivar_15.ncl is MJO_PC_INDEX.nc
> > <http://MJO_PC_INDEX.nc> which is creted by
> > http://www.ncl.ucar.edu/Applications/Scripts/mjoclivar_14.ncl. Moreover,
> > the input of
> > http://www.ncl.ucar.edu/Applications/Scripts/mjoclivar_14.ncl are:
> >
> >
> > filolr = "olr.day.anomalies.1980-2012.nc
> <http://olr.day.anomalies.1980-2012.nc>
> > <http://olr.day.anomalies.1980-2012.nc/>"
> > filu200 = "uwnd.day.200.anomalies.1980-2012.nc
> <http://uwnd.day.200.anomalies.1980-2012.nc>
> > <http://uwnd.day.200.anomalies.1980-2012.nc/>"
> > filu850 = "uwnd.day.850.anomalies.1980-2012.nc
> <http://uwnd.day.850.anomalies.1980-2012.nc>
> > <http://uwnd.day.850.anomalies.1980-2012.nc/>"
> > Among these 3 inputs, it seems the wind anomalies are not correct because
> > when I try to calculate Conventional (covariance) univariate EOF
> > analysis <http://www.ncl.ucar.edu/Applications/Scripts/mjoclivar_12.ncl>
> > fortime span 1995-1999 (as in the website) using
> > http://www.ncl.ucar.edu/Applications/Scripts/mjoclivar_12.ncl, the
> > result of OLR is close to the website, but for U850 and U200 is
> > different and significant different for EOF-3 (enclosed). Thus, I think
> > my wind anomalies is not correctly calculated.
> > I calculated wind anomalies from daily data as the code below
> > (enclosed). I don’t know whether the way to merge the files and then
> > calculate anomaly from those files is correct or not. Probably you have
> > suggestion and help for that.
> > Thanks you,
> > JoeKy
> >
> >
> > _______________________________________________
> > ncl-talk mailing list
> > List instructions, subscriber options, unsubscribe:
> > http://mailman.ucar.edu/mailman/listinfo/ncl-talk
>
>
>
>
>
>
> _______________________________________________
> ncl-talk mailing list
> List instructions, subscriber options, unsubscribe:
> http://mailman.ucar.edu/mailman/listinfo/ncl-talk
_______________________________________________
ncl-talk mailing list
List instructions, subscriber options, unsubscribe:
http://mailman.ucar.edu/mailman/listinfo/ncl-talk
Received on Thu Jun 7 15:42:01 2012
This archive was generated by hypermail 2.1.8 : Tue Jun 12 2012 - 13:58:38 MDT