I reran *all* the 'MJO Clivar' diagnostics. Everything works correctly.
[1] downloaded the NCEP data from the website below. Period 1979-2011
[2] computed the anomalies. These are *slightly* different due to
different climatological base periods (1980-2005 and 1979-2011).
[3] redid all the computations and plots
If the daily anomalies are computed correctly, everything works as in
the examples.
---
I have placed the anomalies and the scripts used in an ftp area.
ftp ftp.cgd.ucar.edu
anonymous
email
cd pub/shea/MJO
prompt
mget *
quit
---
The files and sizes are:
2636 Jun 7 07:52 mjoclicar_10.ncl
4786 Jun 7 07:52 mjoclivar_11.ncl
7275 Jun 7 07:52 mjoclivar_12.ncl
11249 Jun 7 07:52 mjoclivar_13.ncl
12992 Jun 7 07:52 mjoclivar_14.ncl
6635 Jun 7 07:57 mjoclivar_15.ncl
9302 Jun 7 08:03 mjoclivar_16.ncl
10530 Jun 7 07:52 mjoclivar_2.ncl
10374 Jun 7 07:52 mjoclivar_2.olr.ncl
10530 Jun 7 07:52 mjoclivar_2.uwnd_200.ncl
10530 Jun 7 07:52 mjoclivar_2.uwnd_850.ncl
10530 Jun 7 07:52 mjoclivar_2.vwnd_200.ncl
10530 Jun 7 07:52 mjoclivar_2.vwnd_850.ncl
8361 Jun 7 07:52 mjoclivar_3.ncl
3169 Jun 7 07:52 mjoclivar_4.ncl
2876 Jun 7 07:52 mjoclivar_5.ncl
5199 Jun 7 07:52 mjoclivar_6.ncl
2750 Jun 7 07:52 mjoclivar_7.ncl
8678 Jun 7 07:52 mjoclivar_8.ncl
7137 Jun 7 07:52 mjoclivar_9.ncl
37400 Jun 7 07:43 MJO_PC_INDEX.nc
1013804160 Jun 7 07:43 olr.day.anomalies.1979-2011.nc
615513004 Jun 7 07:43 pregpcp19962008.daily.nc
350655700 Jun 7 07:44 TRMM.200006-200109.thin.nc
1013804216 Jun 7 07:44 uwnd.day.anomalies.1979-2011.200.nc
1013804216 Jun 7 07:44 uwnd.day.anomalies.1979-2011.850.nc
1013804216 Jun 7 07:45 vwnd.day.anomalies.1979-2011.200.nc
1013804216 Jun 7 07:45 vwnd.day.anomalies.1979-2011.850.nc
On 6/6/12 3:15 AM, juki juki wrote:
> Thanks for reply Dennis.
>
>>What datasets were used?
>
> As in the website
> (http://www.ncl.ucar.edu/Applications/mjoclivar.shtml), I used
> http://www.esrl.noaa.gov/psd/data/gridded/data.ncep.reanalysis.html, for
> example for wind I used daily wind data
> (http://www.esrl.noaa.gov/psd/cgi-bin/db_search/DBListFiles.pl?did=32&tid=34020&vid=666
> <http://www.esrl.noaa.gov/psd/cgi-bin/db_search/DBListFiles.pl?did=32&tid=34020&vid=666>).
>
> For calculating the anomaly, I just simply modified mjoclivar_2.ncl.
> What I worried is about accumulating the daily data and then calculated
> anomaly from accumulated data. If anomaly is calculated from daily data
> (not from accumulated data) and then daily caclculated anomaly was
> accumulated, of course, the result will be different if it is calculated
> from accumulated data.
>
> All plot for OLR is the same as the example, only for wind is different
> and as we know olr data already accumulated by NOAA, but not the case
> for wind. Please see the code I used below.
>
> Again, thank you.
>
>
> Regards,
> Joeky
>
> -----the code
>
> load "$NCARG_ROOT/lib/ncarg/nclscripts/csm/gsn_code.ncl"
> load "$NCARG_ROOT/lib/ncarg/nclscripts/csm/gsn_csm.ncl"
> load "$NCARG_ROOT/lib/ncarg/nclscripts/csm/contributed.ncl"
>
> begin
> ;-------------------------------------------------------------
> ; User specifications
> ;-------------------------------------------------------------
> NC = True ; create netCDF?
> PLOT = False ; sample plots?
>
> ymdStrt = 19800101 ; start yyyymmdd
> ymdLast = 20120303 ; last
> yrStrt = ymdStrt/10000
> yrLast = ymdLast/10000
> lev = 200 ; desired level
> nhar = 4 ; number of fourier comp
>
> var = "uwnd" ; name of file
> vName = "U" ; name for plots
> fili = var+".day.mean.nc" ; input file
>
> ;========================
> ; get list of all files and open as "one big file"
> ;========================
> all_files = systemfunc ("ls ./Reana1/uwnd/uwnd*.nc")
> f = addfiles (all_files, "r") ; note the "s" of addfile
> print(all_files)
> ;========================
> ; choose how files are combined and read in variable across files
> ;========================
> ListSetType (f, "cat") ; concatenate or "merge" (default)
>
> if (NC) then
> diro= "./Anom/" ; output dir
> filo= var+".day."+lev+".anomalies."+yrStrt+"-"+yrLast+".nc" ; output file
> end if
>
> if (PLOT) then
> wksType = "ps"
> wksName = "mjoclivar" ; "mjo."+yrStrt+"_"+yrLast
> end if
>
> ;***********************************************************
> ; Read user specified time and create required yyyyddd
> ;***********************************************************
> ; f = addfile (diri+fili , "r")
>
> time = f[:]->time ; all times on file
> ymd = cd_calendar(time, -2) ; yyyymmdd
> iStrt = ind(ymd.eq.ymdStrt) ; index start
> iLast = ind(ymd.eq.ymdLast) ; index last
> delete(time)
> delete(ymd)
>
> ;***********************************************************
> ; Read user specified time and create required yyyyddd
> ;***********************************************************
> time = f[:]->time(iStrt:iLast) ; time:units = "hours since"
> TIME = cd_calendar(time, 0) ; type float
> year = floattointeger( TIME(:,0) )
> month = floattointeger( TIME(:,1) )
> day = floattointeger( TIME(:,2) )
> ddd = day_of_year(year, month, day)
> yyyyddd = year*1000 + ddd ; needed for input
>
> ;***********************************************************
> ; Read data: short2flt
> ;***********************************************************
> x = short2flt(f[:]->$var$(iStrt:iLast,{lev},:,:)) ; convert to float
> printVarSummary(x)
>
> ;***********************************************************
> ; Compute daily climatology: raw and then 'smoothed'
> ;***********************************************************
> xClmDay = clmDayTLL(x, yyyyddd) ; daily climatology at each grid point
> printVarSummary(xClmDay)
>
> ;***********************************************************
> ; Compute smoothed daily climatology using 'nhar' harmonics
> ;***********************************************************
> xClmDay_sm = smthClmDayTLL(xClmDay, nhar)
> printVarSummary(xClmDay_sm)
>
> ;***********************************************************
> ; Compute daily anomalies using raw and smoothed climatologies
> ;***********************************************************
> xAnom = calcDayAnomTLL (x, yyyyddd, xClmDay)
> printVarSummary(xAnom)
> printMinMax(xAnom, True)
>
> xAnom_sm = calcDayAnomTLL (x, yyyyddd, xClmDay_sm)
> xAnom_sm@long_name = "Anomalies from Smooth Daily Climatology"
> printVarSummary(xAnom_sm)
> printMinMax(xAnom_sm, True)
>
> delete( x ) ; no longer needed
>
>
> ;***********************************************************
> ; Create netCDF: convenience use 'simple' method
> ;***********************************************************
>
> dimx = dimsizes(xAnom)
> ntim = dimx(0)
> nlat = dimx(1)
> mlon = dimx(2)
>
> if (NC) then
>
> lat = f[0]->lat
> lon = f[0]->lon
>
> system("/bin/rm -f "+diro+filo) ; rm any pre-exist file, if any
> fnc = addfile (diro+filo, "c")
>
> filAtt = 0
> filAtt@title = vName+": Daily Anomalies: "+yrStrt+"-"+yrLast
> filAtt@source_file = fili
> filAtt@creation_date = systemfunc("date")
> fileattdef( fnc, filAtt ) ; copy file attributes
>
> setfileoption(fnc,"DefineMode",True)
> varNC = vName+"_anom"
> varNC_sm = vName+"_anom_sm"
>
> dimNames = (/"time", "lat", "lon"/)
> dimSizes = (/ -1 , nlat, mlon/)
> dimUnlim = (/ True , False, False/)
> filedimdef(fnc,dimNames,dimSizes,dimUnlim)
>
> filevardef(fnc, "time" ,typeof(time),getvardims(time))
> filevardef(fnc, "lat" ,typeof(lat) ,getvardims(lat))
> filevardef(fnc, "lon" ,typeof(lon) ,getvardims(lon))
> filevardef(fnc, varNC ,typeof(xAnom) ,getvardims(xAnom))
> filevardef(fnc, varNC_sm,typeof(xAnom) ,getvardims(xAnom))
>
> filevarattdef(fnc,"time" ,time) ; copy time attributes
> filevarattdef(fnc,"lat" ,lat) ; copy lat attributes
> filevarattdef(fnc,"lon" ,lon) ; copy lon attributes
> filevarattdef(fnc,varNC ,xAnom)
> filevarattdef(fnc,varNC_sm,xAnom_sm)
>
> fnc->time = (/time/)
> fnc->lat = (/lat/)
> fnc->lon = (/lon/)
> fnc->$varNC$ = (/xAnom /)
> fnc->$varNC_sm$ = (/xAnom_sm/)
> end if
>
> ;************************************************
> ; plotting parameters
> ;************************************************
> if (PLOT) then
> LAT = (/ 60, 45, 5, -5, -45, 60 /)
> LON = (/270, 30, 90, 90, 180, 0 /)
> nPts = dimsizes( LAT )
>
> plot = new ( nPts, graphic)
> data = new ( (/2,366/), typeof(xClmDay), getFillValue(xClmDay))
>
> wks = gsn_open_wks (wksType,wksName)
>
> res = True ; plot mods desired
> res@gsnDraw = False
> res@gsnFrame = False
> res@trXMinF = 1
> res@trXMaxF = 366
> ;res@tiMainString = ""
> res@xyLineThicknesses = (/1.0, 2.0/) ; make 2nd lines thicker
> res@xyLineColors = (/"blue","red"/) ; change line color
> res@xyMonoDashPattern = True ; all solid
>
> do np=0,nPts-1
> data(0,:) = xClmDay(:,{LAT(np)},{LON(np)})
> data(1,:) = xClmDay_sm(:,{LAT(np)},{LON(np)})
> res@gsnCenterString = "lat="+LAT(np)+" lon="+LON(np)
> plot(np) = gsn_csm_y (wks,data,res) ; create plot
> end do
> resP = True ; modify the panel plot
> resP@txString = vName+": Raw/Smooth Daily Climatology: "+yrStrt+"-"+yrLast
> resP@gsnMaximize = True
> resP@gsnPaperOrientation = "portrait"
> gsn_panel(wks,plot,(/(nPts/2),2/),resP) ; now draw as one plot
>
> ;==========
> ; Plot anomalies for an arbitrarily selected near equatorial location
> ; Time: Oct 1, 1996 to April 1,1997 [arbitrary selection]
> ;==========
> LATX = 0
> LONX = 90
>
> yyyymmdd = cd_calendar(time, -2)
> ;;yrfrac = yyyymmdd_to_yyyyfrac (yyyymmdd, 0)
> ;;delete(yrfrac@long_name)
>
> xAnom@long_name = "Anomalies from Raw" ; short labels for plot
> xAnom_sm@long_name = "Anomalies from Smooth"
>
> ntBegin = ind(yyyymmdd.eq.20011001)
> ntEnd = ind(yyyymmdd.eq.20020401)
> monthLabels = (/1,4,7,10/)
> monNam = (/"Jan","Feb","Mar","Apr","May","Jun" \
> ,"Jul","Aug","Sep","Oct","Nov","Dec" /)
> xVal = new(ntim, typeof(xAnom&time) , "No_FillValue") ; bigger than
> xLab = new(ntim, "string", "No_FillValue") ; needed
> xValm = new(ntim, typeof(xAnom&time) , "No_FillValue") ; bigger than
>
> ntm = -1
> cr = inttochar(10) ; carriage return
> do nt=ntBegin,ntEnd
> if (day(nt).eq.1) then
> ntm = ntm + 1
> xVal(ntm) = xAnom&time(nt)
> xLab(ntm) = monNam(month(nt)-1)
> if (month(nt).eq.1) then
> xLab(ntm) = xLab(ntm) + cr +sprinti("%0.4i", year(nt))
> end if
> end if
> end do
>
> rxy = True
> rxy@gsnDraw = False
> rxy@gsnFrame = False
> rxy@gsnYRefLine = 0.0 ; create a reference line
> rxy@gsnAboveYRefLineColor = "red" ; above ref line fill red
> rxy@gsnBelowYRefLineColor = "blue" ; below ref line fill blue
> rxy@xyLineThicknessF = 2.0
> rxy@vpHeightF = 0.4 ; resize
> rxy@vpWidthF = 0.8
> rxy@tmXBMode = "Explicit"
> rxy@tmXBValues = xVal(0:ntm)
> rxy@tmXBLabels = xLab(0:ntm)
>
> plot(0) = gsn_csm_xy (wks,time(ntBegin:ntEnd) \
> ,xAnom(ntBegin:ntEnd,{0},{90}),rxy)
> plot(1) = gsn_csm_xy (wks,time(ntBegin:ntEnd) \
> ,xAnom_sm(ntBegin:ntEnd,{0},{90}),rxy)
> resP@txString = vName+": Anomalies: (0,90E)"
> gsn_panel(wks,plot(0:1),(/2,1/),resP)
>
> end if
> end
>
> ------------------------------------------------------------------------
> *From:* Dennis Shea <shea@ucar.edu>
> *To:* juki juki <juky_emc2@yahoo.com>
> *Cc:* NCL Talk <ncl-talk@ucar.edu>
> *Sent:* Wednesday, June 6, 2012 11:20 AM
> *Subject:* Re: [ncl-talk] Wind anomaly, MJO_PC_INDEX and MJO clivar
>
> The real key is the daily anomalies. If they are not correct, none
> of the MJO diagnostics are correct. You should look very carefully
> at how the anomalies were generated. What datasets were used?
> For debugging and testing, use a smaller temporal sample and
> plot the data.
>
>
> On 6/3/12 10:58 PM, juki juki wrote:
> > Dear All;
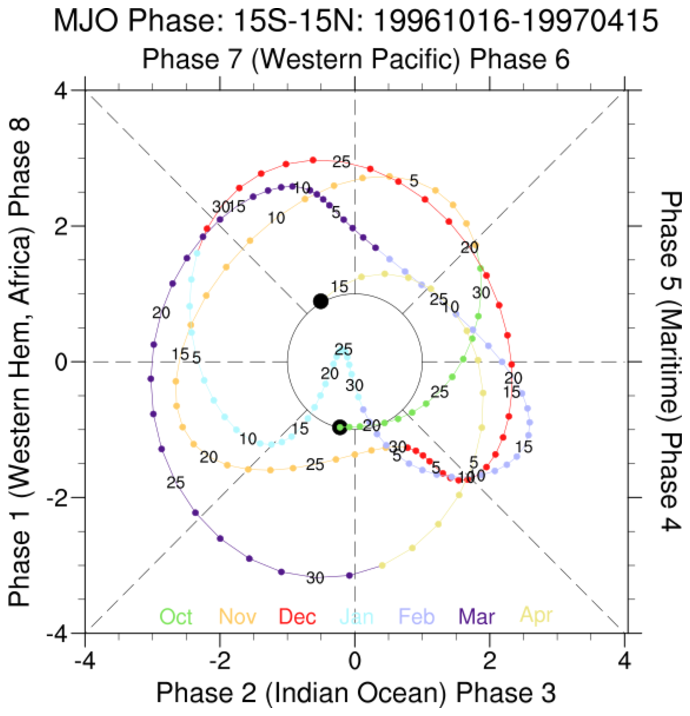
> > As my previous email that I would like to plot MJO phase diagram by
> > usinghttp://www.ncl.ucar.edu/Applications/Scripts/mjoclivar_15.ncl. To
> > see the performance of the code, first I plot same data period as in the
> > website. The result is very different from the example
> > (http://www.ncl.ucar.edu/Applications/Images/mjoclivar_15_lg.png) in
> > which the location of all MJO phases for all months is different from
> > that in the website.
> > Thus, my MJO_PC_INDEX.nc <http://MJO_PC_INDEX.nc>
> <http://mjo_pc_index.nc/> may NOT be correct.
> > As we know the input of mjoclivar_15.ncl is MJO_PC_INDEX.nc
> > <http://MJO_PC_INDEX.nc> which is creted by
> > http://www.ncl.ucar.edu/Applications/Scripts/mjoclivar_14.ncl. Moreover,
> > the input of
> > http://www.ncl.ucar.edu/Applications/Scripts/mjoclivar_14.ncl are:
> >
> >
> > filolr = "olr.day.anomalies.1980-2012.nc
> <http://olr.day.anomalies.1980-2012.nc>
> > <http://olr.day.anomalies.1980-2012.nc/>"
> > filu200 = "uwnd.day.200.anomalies.1980-2012.nc
> <http://uwnd.day.200.anomalies.1980-2012.nc>
> > <http://uwnd.day.200.anomalies.1980-2012.nc/>"
> > filu850 = "uwnd.day.850.anomalies.1980-2012.nc
> <http://uwnd.day.850.anomalies.1980-2012.nc>
> > <http://uwnd.day.850.anomalies.1980-2012.nc/>"
> > Among these 3 inputs, it seems the wind anomalies are not correct because
> > when I try to calculate Conventional (covariance) univariate EOF
> > analysis <http://www.ncl.ucar.edu/Applications/Scripts/mjoclivar_12.ncl>
> > fortime span 1995-1999 (as in the website) using
> > http://www.ncl.ucar.edu/Applications/Scripts/mjoclivar_12.ncl, the
> > result of OLR is close to the website, but for U850 and U200 is
> > different and significant different for EOF-3 (enclosed). Thus, I think
> > my wind anomalies is not correctly calculated.
> > I calculated wind anomalies from daily data as the code below
> > (enclosed). I don’t know whether the way to merge the files and then
> > calculate anomaly from those files is correct or not. Probably you have
> > suggestion and help for that.
> > Thanks you,
> > JoeKy
> >
> >
> > _______________________________________________
> > ncl-talk mailing list
> > List instructions, subscriber options, unsubscribe:
> > http://mailman.ucar.edu/mailman/listinfo/ncl-talk
>
>
>
>
>
>
> _______________________________________________
> ncl-talk mailing list
> List instructions, subscriber options, unsubscribe:
> http://mailman.ucar.edu/mailman/listinfo/ncl-talk
_______________________________________________
ncl-talk mailing list
List instructions, subscriber options, unsubscribe:
http://mailman.ucar.edu/mailman/listinfo/ncl-talk
Received on Thu Jun 7 08:16:04 2012
This archive was generated by hypermail 2.1.8 : Tue Jun 12 2012 - 13:58:38 MDT