Date: Fri Jun 22 2012 - 07:43:19 MDT
Greetings,
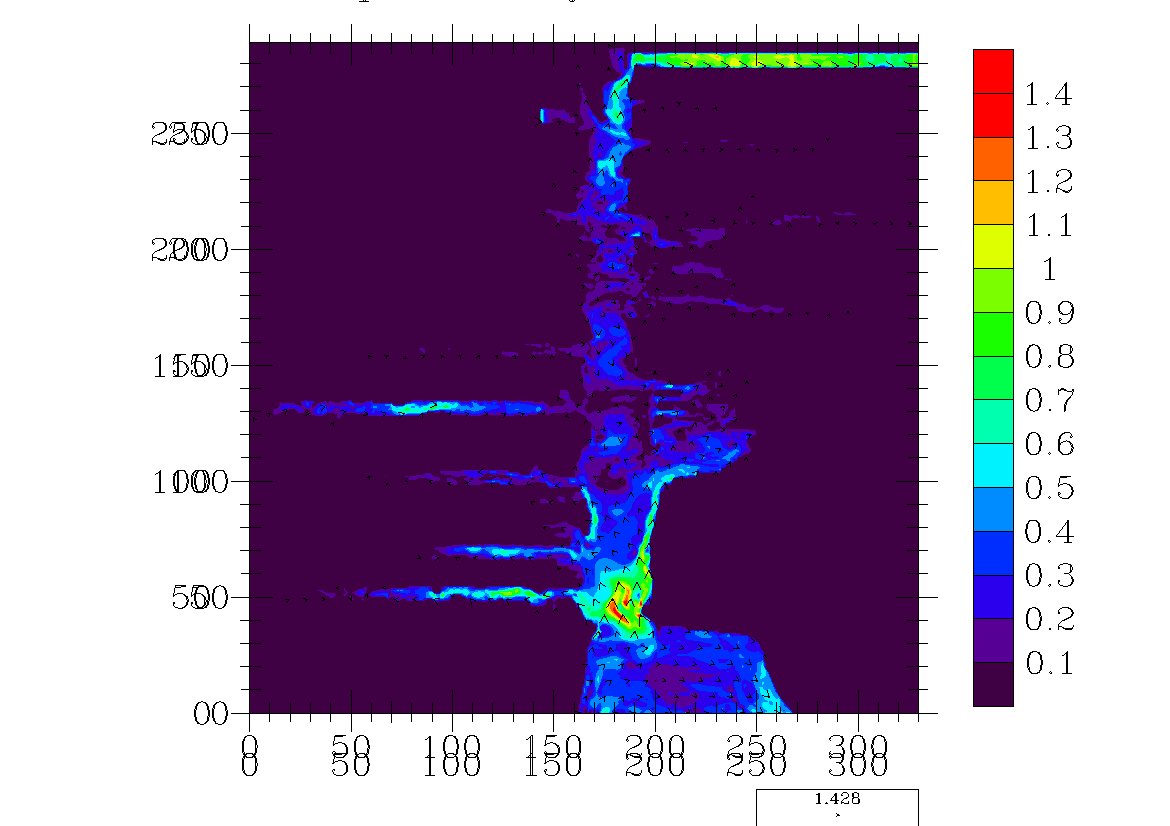
I have little knowledge of NCL, but I just started learning earlier this
week due to limitations in grads. I've been trying to plot CBOFS data
which is netcdf and on an *orthogonal curvilinear grid*, but I can't retain
the correct shape of the grid when plotting (see attached script and
resulting plot).
the variables im trying to plot with contours and vectors are* u and
v*components of current, and are 2 dimensional arrays with dimensions
*eta_u, xi_u* and *eta_v, xi_v* respectively. the variables *lat_u, lon_u,
lat_v, lon_v* are also available and are in 2 dimensions.
u and v have slightly different dimensions for some reason; u is 291 x 330
and the v is 290 x 331, which is why im forcing them to conform in the
first few lines of the script.
I understand that the script is a mess; trial and error is part of the
learning process. Mainly, I just want to know the best approach at plotting
the data without it being distorted...you may notice in the attached image
that the entrance to the chesapeake is facing north/south...when in reality
it faces east! I'm clearly missing something here.
Also, I tried using rcm2rgrid but the image comes out much more distorted
and unrecognizable with blotches and horizontal/vertical lines.
Any insight or guidance in the right direction would be greatly appreciated
here!
Regards,
Brandon Capasso
_______________________________________________
ncl-talk mailing list
List instructions, subscriber options, unsubscribe:
http://mailman.ucar.edu/mailman/listinfo/ncl-talk
- application/octet-stream attachment: plot_vectors