Hi Adam,
Thanks for the reply.I made those changes but I am still getting the
similar plots. Can you please suggest what else can cause it. here is
the complete plotting resources:
;*******************************************************
;Plot resources for eady growth first set (non shaded)
;******************************************************
wks =
gsn_open_wks("png","eady_eke_var_diff_spring_winter")
gsn_define_colormap(wks,"BlAqGrYeOrReVi200")
res = True
res@cnLinesOn = True
res@tmLabelAutoStride = True
res@tmXTOn = False
res@tmYROn = False
res@cnLevelSelectionMode = "ManualLevels"
res@cnMinLevelValF = 0
res@cnMaxLevelValF = 2.0
res@cnLevelSpacingF = 0.2
res@cnLineLabelFontHeightF= 0.015
res@cnInfoLabelOn = False ; turn off cn
info label
res@cnLineLabelsOn = False
res@lbLabelBarOn = False
res@gsnDraw = False
res@gsnFrame = False
res@gsnMaximize = True
res@pmLabelBarDisplayMode = "Never"
;*************************************************
; Plot resources for eke first set (shaded)
;*************************************************
plot = new(4,graphic) ; create a plot array
sres = True
sres@gsnDraw = False
sres@gsnFrame = False
sres@gsnMaximize = True
sres@gsnSpreadColors = True
sres@cnFillOn = True
sres@cnLinesOn = False
sres@cnLevelSelectionMode = "ManualLevels"
sres@cnMinLevelValF = 0
sres@cnMaxLevelValF = 250
sres@cnLevelSpacingF = 5
sres@cnInfoLabelOn = False ; turn
off cn info label
sres@cnLineLabelsOn = False
sres@tmLabelAutoStride = True
sres@tmXTOn = False
sres@tmYROn = False
sres@mpLimitMode = "LatLon"
sres@mpMinLatF = 10.
sres@mpMaxLatF = 80.
sres@mpMinLonF = 130.
sres@mpMaxLonF = 330.
sres@mpGeophysicalLineThicknessF = 1.75
sres@mpCenterLonF = 210
sres@mpShapeMode = "FreeAspect"
sres@lbOrientation = "vertical" ;vertical label bar
sres@lbLabelBarOn = False
sres@lbLabelAutoStride = True
;*********************************
; Plot first set (four means)
;*********************************
plot_eke1 = gsn_csm_contour_map(wks,eke_var(:,:),sres)
plot_eady1 = gsn_csm_contour(wks,eady_var(:,:),res)
overlay(plot_eke1,plot_eady1)
plot(0) = plot_eke1
plot_eke2 = gsn_csm_contour_map(wks,eke_var_ens(:,:),sres)
plot_eady2 = gsn_csm_contour(wks,eady_var_ens(:,:),res)
overlay(plot_eke2,plot_eady2)
plot(1) = plot_eke2
res@gsnLeftString = " "
plot_eke3 = gsn_csm_contour_map(wks,eke_var1(:,:),sres)
plot_eady3 = gsn_csm_contour(wks,eady_var1(:,:),res)
overlay(plot_eke3,plot_eady3)
plot(2) = plot_eke3
plot_eke4 = gsn_csm_contour_map(wks,eke_var_ens1(:,:),sres)
plot_eady4 = gsn_csm_contour(wks,eady_var_ens1(:,:),res)
overlay(plot_eke4,plot_eady4)
plot(3) = plot_eke4
;************************************************
; create first set panel plot(four means)
;************************************************
resPanel = True
resPanel@gsnFrame = False
resPanel@gsnSpreadColors = True
resPanel@gsnPanelLabelBar = True ; add
color bar
resPanel@gsnPanelFigureStrings = (/"a","b","c","d"/)
resPanel@gsnPanelFigureStringsFontHeightF = 0.02
resPanel@gsnPanelFigureStringsPerimOn = True
resPanel@gsnPanelDebug = True
resPanel@gsnPanelTop = 0.9
resPanel@gsnPanelBottom = 0.3 ;move bottom up
from 0 to 0.4
resPanel@gsnPanelLeft = 0.0
resPanel@gsnPanelRight = 0.9
resPanel@gsnPanelDebug = True
resPanel@lbOrientation = "Vertical"
resPanel@lbLabelAutoStride = False
resPanel@lbLabelStride = 5
gsn_panel(wks,plot,(/2,2/),resPanel)
;*****************************************************************
; create plot resources eady growth diff next set of plots(non shaded)
;*****************************************************************
plot1 = new(2,graphic) ; create a plot array
dres = True
dres@gsnMaximize = True
dres@cnLinesOn = True
dres@cnLevelSelectionMode = "ManualLevels"
dres@cnMinLevelValF = 0
dres@cnMaxLevelValF = 3
dres@cnLevelSpacingF = 0.2
dres@cnInfoLabelOn = False
dres@cnLineLabelsOn = False
dres@cnLineLabelDensityF = 1.
dres@cnLineLabelFontHeightF = 0.015
dres@cnLineLabelInterval = 3
dres@tmLabelAutoStride = True
dres@tmXTOn = False
dres@tmYROn = False
dres@lbLabelBarOn = False
dres@gsnDraw = False
dres@gsnFrame = False
dres@gsnMaximize = True
;*****************************************************
; create plot resources eke next set of plots(shaded)
;******************************************************
dbres = True
dbres@gsnMaximize = True
dbres@gsnSpreadColors = True
dbres@gsnDraw = False
dbres@gsnFrame = False
dbres@cnFillOn = True
dbres@cnLinesOn = False
dbres@cnLevelSelectionMode = "ManualLevels"
dbres@cnMinLevelValF = -40
dbres@cnMaxLevelValF = 40
dbres@cnLevelSpacingF = 0.5
dbres@cnInfoLabelOn = False
dbres@cnLineLabelsOn = False
dbres@tmLabelAutoStride = True
dbres@tmXTOn = False
dbres@tmYROn = False
dbres@lbOrientation = "Vertical"
dbres@lbLabelBarOn = False
dbres@lbLabelStride = 20.
dbres@lbLabelAutoStride = False
dbres@mpLimitMode = "LatLon"
dbres@mpMinLatF = 10.
dbres@mpMaxLatF = 80.
dbres@mpMinLonF = 130.
dbres@mpMaxLonF = 330.
dbres@mpCenterLonF = 210
dbres@mpGeophysicalLineThicknessF= 1.75
getvalues plot(3)
"vpWidthF" : vpw
"vpHeightF" : vph
end getvalues
; By default, you can't skew the width/height of a map plot.
; You must also set mpShapeMode to "FreeAspect" to indicate
; that you really want to skew the map.
dbres@mpShapeMode = "FreeAspect"
dbres@vpWidthF = vpw
dbres@vpHeightF = vph
; ## SHADED
plot1_eke1 = gsn_csm_contour_map(wks,eke_diff,dbres)
plot1_eke2 = gsn_csm_contour_map(wks,eke_diff1,dbres)
; ## NON-SHADED
plot1_eady1 = gsn_csm_contour(wks,eady_diff,dres)
plot1_eady2 = gsn_csm_contour(wks,eady_diff1,dres)
overlay(plot1_eke1,plot1_eady1)
overlay(plot1_eke2,plot1_eady2)
plot1(0) = plot1_eke1
plot1(1) = plot1_eke2
;************************************************
; create next set panel plot
;************************************************
dresPanel = True
dresPanel@gsnFrame = False
dresPanel@gsnSpreadColors = True
dresPanel@gsnMaximize = True ; use full
page
dresPanel@gsnPanelLabelBar = True ; add
color bar
dresPanel@gsnPanelTop = 0.45
dresPanel@gsnPanelBottom = 0.1
dresPanel@gsnPanelLeft = 0.0
dresPanel@gsnPanelRight = 0.9
dresPanel@gsnPanelFigureStrings = (/"e","f"/)
dresPanel@gsnPanelFigureStringsFontHeightF = 0.02
dresPanel@gsnPanelFigureStringsPerimOn = True
dresPanel@gsnPanelDebug = True
dresPanel@lbOrientation = "Vertical"
dresPanel@lbLabelAutoStride = False
dresPanel@lbLabelStride = 10
gsn_panel (wks,plot1,(/1,2/),dresPanel)
frame(wks)
Thanks,
Soumik
On 2012-07-05 19:20, Adam Phillips wrote:
> Hi Soumik,
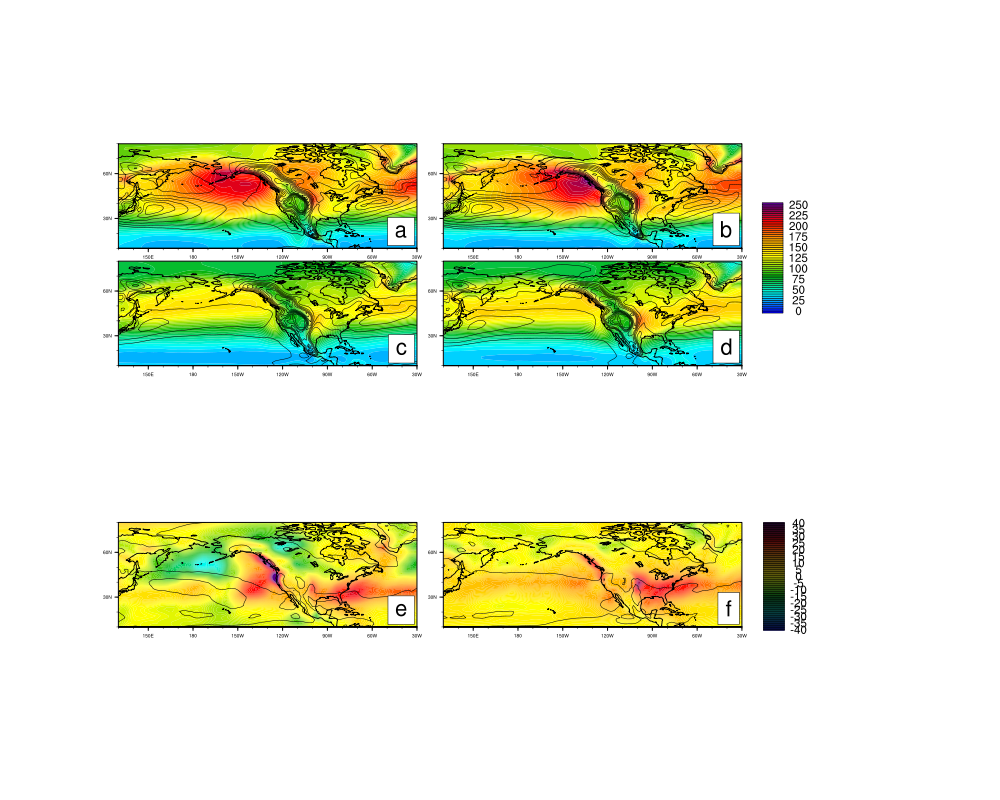
> Your top 4 plots are not taking up all of the space you are allotting
> to them. They are maxed out on the page horizontally, and they are
> only taking up roughly 0.5-0.9 of vertical NDC space. To take up more
> space, NCL would need to alter the aspect ratio of the plot(s),
> something it won't do unless you tell it to. (Setting
> res@mpShapeMode=
> "FreeAspect" would do that. )
>
> Try setting gsnPanelTop for your bottom 2 plots to 0.45 (instead of
> 0.3)..
> Hope that helps.. Adam
>
>
> On Jul 5, 2012, at 6:21 PM, Soumik Basu <sbasu@iarc.uaf.edu> wrote:
>
>> Hi,
>>
>> I am trying to create a panel plot containing 6 plots. But I am
>> having
>> problem with the space between the plots.I am plotting the first
>> four
>> plots with a particular colorbar and the last two with another
>> colorbar.
>> Can anybody please suggest me what is going wrong.
>>
>> The panel plot resources (I am sending only the two separate
>> resource
>> parts of my script) I am using are as follows:
>>
>> ;************************************************
>> ; create first set panel plot(top four of the panel)
>> ;************************************************
>> resPanel = True
>>
>> resPanel@gsnFrame = False
>>
>> resPanel@gsnSpreadColors = True
>> resPanel@gsnPanelLabelBar = True
>> ; add
>> color bar
>> resPanel@gsnPanelFigureStrings = (/"a","b","c","d"/)
>> resPanel@gsnPanelFigureStringsFontHeightF = 0.02
>> resPanel@gsnPanelFigureStringsPerimOn = True
>> resPanel@gsnPanelDebug = True
>> resPanel@gsnPanelTop = 0.9
>> resPanel@gsnPanelBottom = 0.3 ;move
>> bottom up
>> from 0 to 0.4
>> resPanel@gsnPanelLeft = 0.0
>> resPanel@gsnPanelRight = 0.9
>> resPanel@gsnPanelDebug = True
>>
>> resPanel@lbOrientation = "Vertical"
>> resPanel@lbLabelAutoStride = False
>> resPanel@lbLabelStride = 5
>>
>> gsn_panel(wks,plot,(/2,2/),resPanel)
>>
>> ;************************************************
>> ; create last 2 of panel plot
>> ;************************************************
>> dresPanel = True
>>
>> dresPanel@gsnFrame = False
>> dresPanel@gsnSpreadColors = True
>> dresPanel@gsnMaximize = True
>> ; use full
>> page
>> dresPanel@gsnPanelLabelBar = True
>> ; add
>> color bar
>> dresPanel@gsnPanelTop = 0.3
>> dresPanel@gsnPanelBottom = 0.1
>> dresPanel@gsnPanelLeft = 0.0
>> dresPanel@gsnPanelRight = 0.9
>> dresPanel@gsnPanelFigureStrings = (/"e","f"/)
>> dresPanel@gsnPanelFigureStringsFontHeightF = 0.02
>> dresPanel@gsnPanelFigureStringsPerimOn = True
>> dresPanel@gsnPanelDebug = True
>>
>> dresPanel@lbOrientation = "Vertical"
>> dresPanel@lbLabelAutoStride = False
>> dresPanel@lbLabelStride = 10
>>
>> gsn_panel (wks,plot1,(/1,2/),dresPanel)
>> frame(wks)
>>
>>
>> Thanks,
>> Soumik
>>
>>
>> --
>> "Numbing the pain for a while will make it worse when you finally
>> feel it.
>> ~J.K. Rowling"
>> *****************************************
>> Soumik Basu
>> Graduate Student, Research Assistant
>> International Arctic Research Center
>> University of Alaska Fairbanks
>> Fairbanks,Alaska,USA
>> *****************************************
>> <eady_eke_var_diff_spring_winter.000001.png>
>> _______________________________________________
>> ncl-talk mailing list
>> List instructions, subscriber options, unsubscribe:
>> http://mailman.ucar.edu/mailman/listinfo/ncl-talk
--
"Numbing the pain for a while will make it worse when you finally feel
it.
  ~J.K. Rowling"
*****************************************
Soumik Basu
Graduate Student, Research Assistant
International Arctic Research Center
University of Alaska Fairbanks
Fairbanks,Alaska,USA
*****************************************
_______________________________________________
ncl-talk mailing list
List instructions, subscriber options, unsubscribe:
http://mailman.ucar.edu/mailman/listinfo/ncl-talk
This archive was generated by hypermail 2.1.8 : Mon Jul 09 2012 - 10:45:32 MDT