Hi:
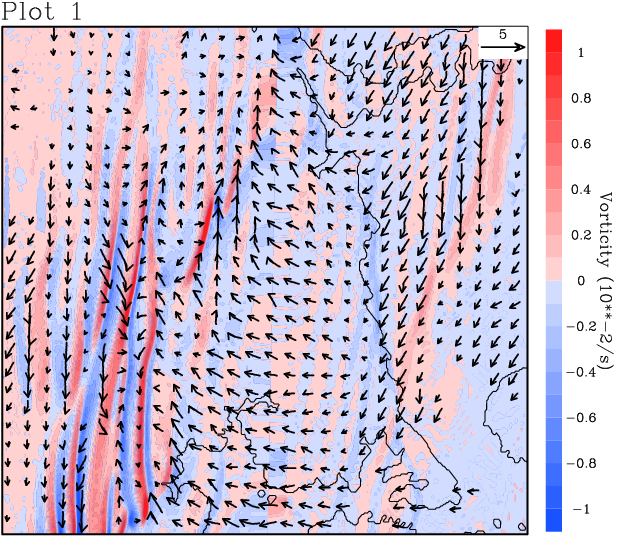
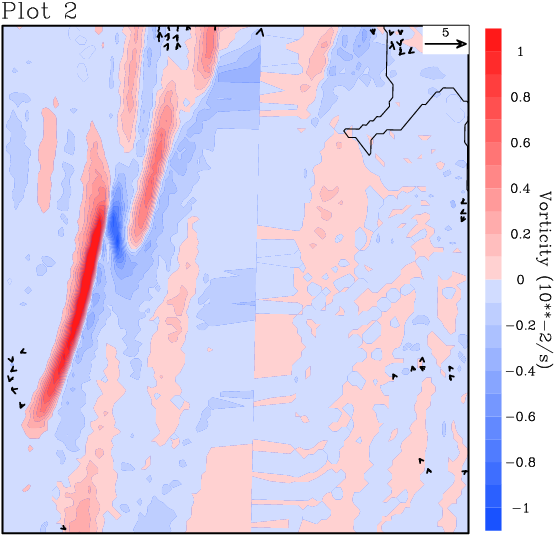
I have a regional model output (100m resolution). When I ploted an area about 30x30km (plot_1.png attached) using plot_1.ncl, the plot seems OK. However, when I tried to plot an area about 10x10km within the 30x30km area, the plotted wind vectors are quite odd (plot_2.png by plot_2.ncl), and wind vectors were not plotted in most areas. Can anyone help me fix the problem? Thanks!
Ed
_______________________________________________
ncl-talk mailing list
List instructions, subscriber options, unsubscribe:
http://mailman.ucar.edu/mailman/listinfo/ncl-talk
This archive was generated by hypermail 2.1.8 : Mon Jul 09 2012 - 10:45:32 MDT