Date: Mon Aug 27 2012 - 20:32:03 MDT
Dear Mary,
Thank you very much, you are right! Through adding add a draw and frame pair it works.
res@gsnDraw = False
res@gsnFrame = False
.......
draw(plot2)
frame(wks)
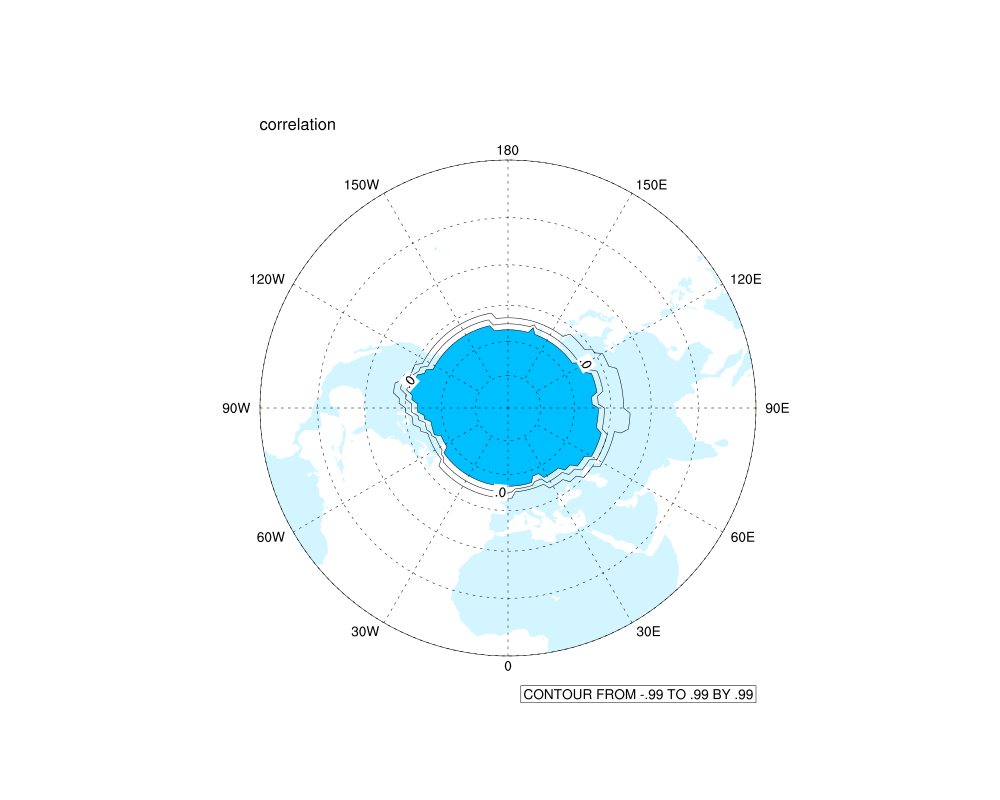
However, the output pic just shaded the high value part and NOT shaded the low value part(please see the attched t.png).
I'm so sorry that I did not express my problems clear in previous letter.The other key problem of my scripts lies in that the NCL just shaded the lower value part of my pics. But, What I need is both the low part shaded in cold color (light blue) and low part shaded in warm color (light yellow).
Actually, this is script is used to shaded the significant confidence in a correlation map. I seperate the significant area into 3 parts:
1) if below significant level (prob .gt. 0.05), then sig=0 (sig is the new varible for shaded).
2) if above significant level (prob .le. 0.05) .and. ccr .le. 0 (ccr is correlation coefficient), then sig= -1.0 (sig is the new varible for shaded);
3) if above significant level (prob .le. 0.05) .and. ccr .ge. 0 (ccr is correlation coefficient), then sig= 1.0 (sig is the new varible for shaded).
I want to shade the correlation map into three parts:
1) sig=0,no shadeing;
2) sig=-1, light blue;
3) sig=1, light yellow.
Into ncl codes, it like this:
opt = True
.......
opt@cnInfoLabelOn = True;False
opt@gsnDraw = False
opt@gsnFrame = False
opt@gsnShadeHigh = 12 ; Use fill color #150 (yellow)
opt@gsnShadeLow = 7 ; You can use color indices or named colors.
plot2 = gsn_contour_shade(plot2, -0.99,0.99, opt)
draw(plot2)
frame(wks)
These script work well in early versions lower then 6.0.0. Now I'm using 6.0.0 (not 6.1.0-beta, because 6.1.0-beta seems not installed well in my computer Mac OS X Lion 10.7.4 x86_64) and these codes are not working well. So, I'm really a little puzzle about this problem.
Best Regards,
Li
At 2012-08-28 01:26:47,"Mary Haley" <haley@ucar.edu> wrote:
I think you just need to add a draw and frame call after gsn_contour_shade:
draw(plot2)
frame(wks)
--Mary
On Aug 25, 2012, at 7:59 PM, heaven_bird334 wrote:
Hi,
I met a strange problem that the "gsn_contour_shade" seems not working for "ExplicitLevels" cnLevelSelectionMode. It seems can not add the shaded area for coutours. I have attached the script(t.nc), input data(t.nc) and ouput pic(t.png) behind this email. And the following is the detailing infos:
@> ncl -x t.ncl
Copyright (C) 1995-2011 - All Rights Reserved
University Corporation for Atmospheric Research
NCAR Command Language Version 6.0.0
The use of this software is governed by a License Agreement.
See http://www.ncl.ucar.edu/ for more details.
Loading file "$NCARG_ROOT/lib/ncarg/nclscripts/csm/gsn_code.ncl"
+
Loading file "$NCARG_ROOT/lib/ncarg/nclscripts/csm/gsn_csm.ncl"
+
Loading file "$NCARG_ROOT/lib/ncarg/nclscripts/csm/contributed.ncl"
+
Loading file "$NCARG_ROOT/lib/ncarg/nclscripts/csm/shea_util.ncl"
+
+ begin
+ f=addfile("t.nc","r")
+ sig=f->sig ; Three values in this var, -1,0,1
+ printVarSummary(sig)
+
+ ;wks = gsn_open_wks("x11","t")
+ & nbsp; wks = gsn_open_wks("png","t")
+ gsn_define_colormap(wks,"amwg_blueyellowred")
+ res = True
+ res@cnLineLabelBackgroundColor = "white" ; white bckgrnd around label
+ res@gsnAddCyclic = True
+ res@gsnPolar = "NH" ; select northern hemisphere
+ res@mpCenterLonF = 0
+
+ res@cnLineLabelsOn = True; False ; turn on line labels
+ res@cnFillOn ; = False
+ res@cnLinesOn = True; False
+ res@cnLevelSelectionMode = "ExplicitLevels" ; set manual contour levels
+ res@cnLevels = (/-0.99,0.,0.99/)
+ plot2 = gsn_csm_contour_map_polar(wks,sig(:,:),res)
+ opt = True
+ opt@cnInfoLabelOn = True;False
+ opt@gsnDraw = False
+ opt@gsnFrame = False
+ opt@gsnShadeHigh = 12 ; Use fill color #150 (yellow)
+ opt@gsnShadeLow = 7 ; You can use color indices or named colors.
+ plot2 = gsn_contour_shade(plot2, -0.99,0.99, opt) ; Shade contours > -4 yellow, and shade contour
+
+
+ end
Variable: sig
Type: float
Total Size: 21312 bytes
5328 values
Number of Dimensions: 2
Dimensions and sizes: [lat | 37] x [lon | 144]
Coordinates:
lat: [ 0..90]
lon: [ 0..357.5]
Number Of Attributes: 4
units :
long_name : correlation
_FillValue : -99.99
missing_value : -99.99
Any suggestion or commont is thankworthy!
Best Regards,
Li
<t.nc><t.ncl><t.png>_______________________________________________
ncl-talk mailing list
List instructions, subscriber options, unsubscribe:
http://mailman.ucar.edu/mailman/listinfo/ncl-talk
Received on Mon Aug 27 20:47:20 2012