Date: Mon Sep 24 2012 - 08:55:26 MDT
Hi all,
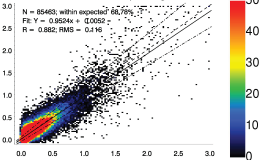
I want to make a scatter plot, with color coded as a function of density
(looks like the plot attached below).
Generally I use gsn_csm_xy to make scatter plot. Does anyone know how to
make a scatterplot as shown?
Thanks in advance,
Xiaoyan
[image: Inline image 1]
_______________________________________________
ncl-talk mailing list
List instructions, subscriber options, unsubscribe:
http://mailman.ucar.edu/mailman/listinfo/ncl-talk