Date: Sun Oct 14 2012 - 02:49:35 MDT
Hello helpful NCL folk,
I am having an issue with making a panelled version of a number of bar
chart plots. The bar chart plots I am trying to panel are actually one bar
chart overlain on another. The base plot has solid filled and outlined
bars; the overlying plot has transparent but outlined bars. The problem I
have is that when I do gsn_panel, the base plot for various panels (not
all!) becomes messed up (the height and/or colour of one or more bars is
incorrect).
Below I include the code I have put together to demonstrate the issue using
some randomly generated data.
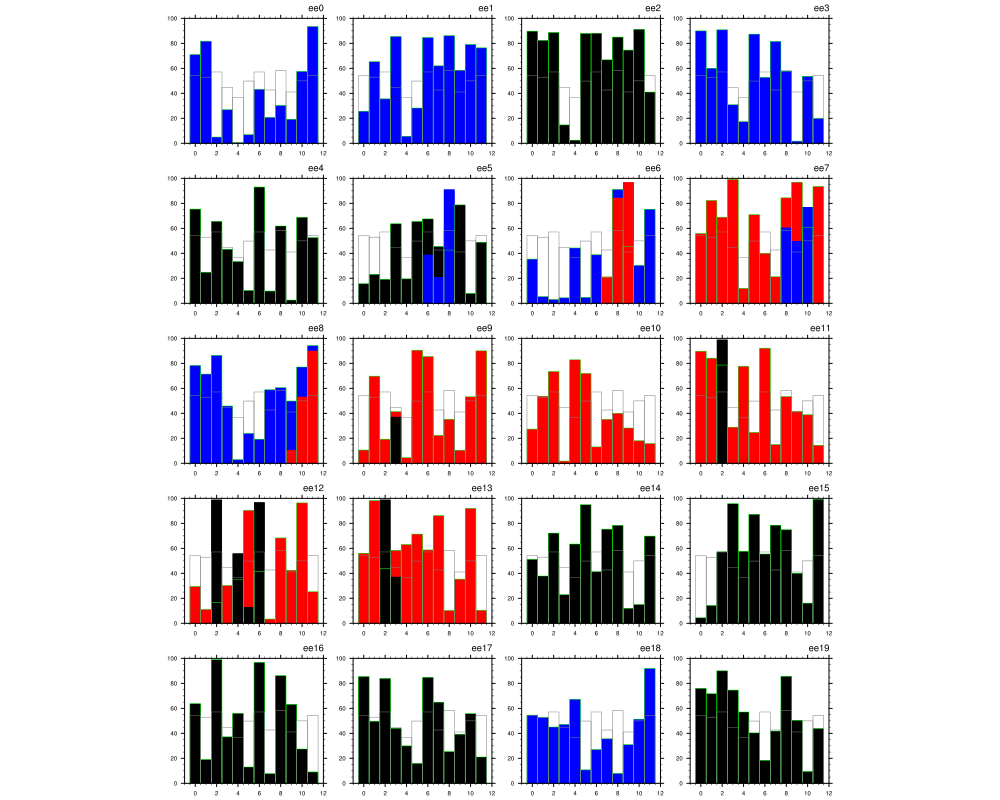
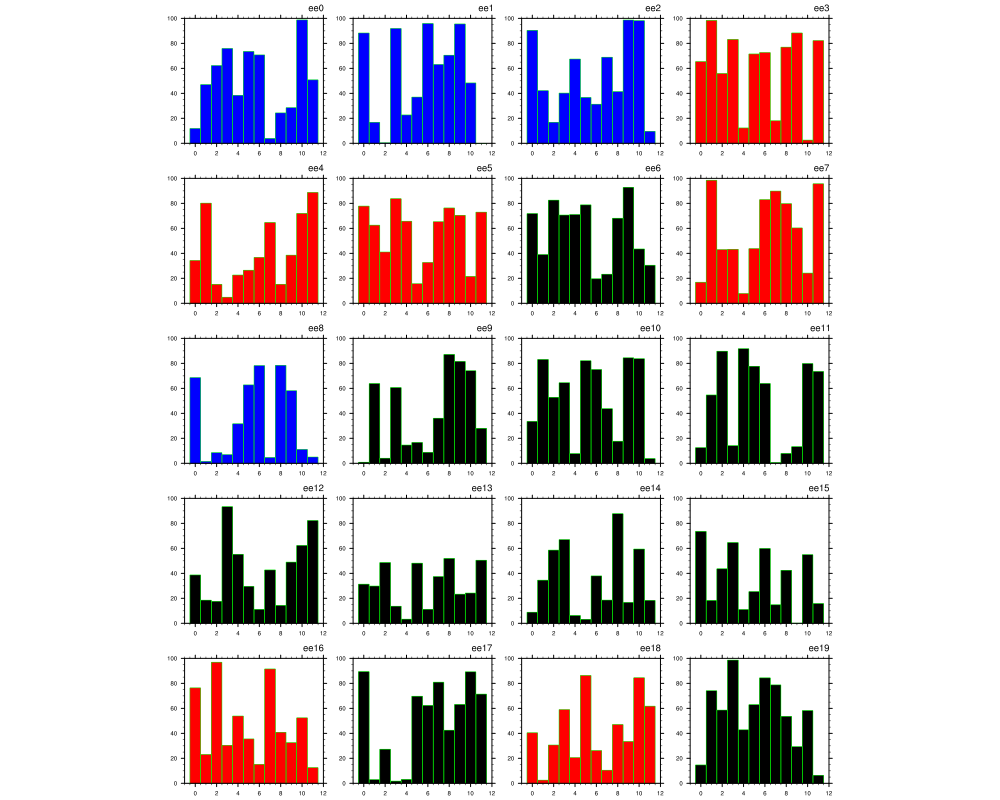
I also attach 2 plots:
1) PlotA-with_overlay was made by retaining the line:
overlay(plot_bar,plot_bar2) ; left in for pdf a, commented out for b
2) PlotB-no_overlay for which I commented this line out.
I have outlined the bars in the base plot in a separate colour from the
bars, and various plots are different colours to make the problem more
obvious. For clarification, all bars on a single panel are supposed to be
the same colour, i.e. as they are in PlotB. The data comprising the bar
charts is randomly generated, as is the colour of the bar charts.
Could you please advise me where I might be going wrong with these plots? I
am using NCL 6.0.0.
Many thanks,
Kay
----------------------------------------------------------------------------------------------------------------------------------------------
load "$NCARG_ROOT/lib/ncarg/nclscripts/csm/gsn_code.ncl"
load "$NCARG_ROOT/lib/ncarg/nclscripts/csm/gsn_csm.ncl"
load "$NCARG_ROOT/lib/ncarg/nclscripts/csm/contributed.ncl"
begin
month_strings = (/ "J", "F", "M", "A", "M", "J", "J", "A", "S", "O", "N",
"D" /)
M = 20
N = dimsizes(month_strings)
; make some dummy data
bar_plot_data = new((/M,N/),float)
seed = stringtointeger(systemfunc("date -u
+%s"))/stringtointeger(systemfunc("date -u +%S"))
random_setallseed(36484749, seed)
do i = 0,M-1
bar_plot_data(i,:) = random_uniform(0., 100., N)
end do
bar_plot_data2 = dim_avg_n(bar_plot_data,0)
text_value = floattoint(random_uniform(0, 3, M))
;-----------------------------------------------------------------------
; PLOTTING
wks = gsn_open_wks("png","PlotA-with_overlay")
; wks = gsn_open_wks("png","PlotB-no_overlay")
gsn_define_colormap(wks,"hlu_default")
; make arrays for storing plot panels and annotation
plot = new((M),graphic)
; set some fixed things
bar_colour = (/ 2, 4, 1 /)
; set fixed resources for solid bars
barres1 = True
barres1@gsnDraw = False
barres1@gsnFrame = False
barres1@vpWidthF = 0.5
barres1@vpHeightF = 0.45
barres1@gsnXYBarChart = True ; Create bar plot
barres1@xyLineColor = 3
barres1@trXMinF = -1
barres1@trXMaxF = N
barres1@trYMinF = 0
barres1@trYMaxF = 100
barres1@gsnLeftStringFontHeightF = 25
barres1@gsnLeftStringOrthogonalPosF = 0.03
barres1@gsnRightStringFontHeightF = 25
barres1@gsnRightStringOrthogonalPosF = 0.03
barres1@tiMainOn = False
; set fixed resources for grey outline bars
barres2 = barres1
barres2@xyLineColor = 26 ;"grey"
barres2@gsnXYBarChartColors = -1
barres2@tmXBOn = False
barres2@tmYLOn = False
barres2@tmXTOn = False
barres2@tmYROn = False
barres2@gsnLeftString = ""
barres2@gsnRightString = ""
; loop through each panel of the plot
do ee = 0,M-1
; first make the solid bar plot and overlay with grey outline bars
bar_data = bar_plot_data(ee,:)
barres1@gsnXYBarChartColors = bar_colour(text_value(ee)) ;
Color for bars
barres1@gsnRightString = "ee"+ee
barres1@gsnLeftString = ""
plot_bar = gsn_csm_xy (wks,ispan(0,N-1,1),bar_data,barres1)
plot_bar2 = gsn_csm_xy (wks,ispan(0,N-1,1),bar_plot_data2,barres2)
; now draw the result for comparison to the panelled plot
; draw(plot_bar)
; frame(wks)
; draw(plot_bar2)
; frame(wks)
overlay(plot_bar,plot_bar2) ; left in for pdf A, commented out for B
; save this plot to the array for later panelling and delete the
intermediate plots
plot(ee) = plot_bar
delete(plot_bar)
delete(plot_bar2)
delete(bar_data)
end do ; ee
; panel the plots
print("Panelling!")
;************************************************
resP = True ; modify the panel plot
resP@gsnMaximize = True
resP@gsnPanelYWhiteSpacePercent = 3
resP@gsnPanelXWhiteSpacePercent = 3
gsn_panel(wks,plot,(/5,4/),resP) ; now draw as one plot
;************************************************
end
_______________________________________________
ncl-talk mailing list
List instructions, subscriber options, unsubscribe:
http://mailman.ucar.edu/mailman/listinfo/ncl-talk