Date: Thu Nov 08 2012 - 15:16:41 MST
Hello,
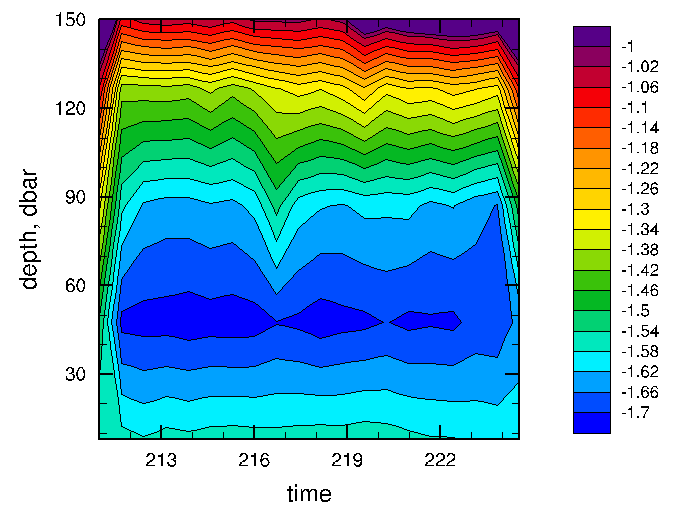
I'm using natgrid function to plot an ascii file.I have a trouble with the
boundaries, for some reason the values close to the right and left
boundaries drop (see the plot).It's not consistent with the data from the
file. These values aren't realistic. And if I extend time (X-axis) to later
or earlier times, the values on the boundaries still have a tendency to
drop.
Do you have any idea how to fix that?
--
regards
*******************************************************
*Alex Semenov*
*
*
PhD Student - Research Assistant
International Arctic Research Center
Department of atmospheric sciences
University of Alaska Fairbanks
930 Koyukuk dr, 408c3
Fairbanks, AK, USA, 99775
work phone +19074742672
_______________________________________________
ncl-talk mailing list
List instructions, subscriber options, unsubscribe:
http://mailman.ucar.edu/mailman/listinfo/ncl-talk
- text/plain attachment: code.txt