Date: Fri Dec 21 2012 - 18:41:59 MST
Hi all,
I have the file gfs.t00z.pgrb2bf00 (renamed 00.grb2), from
ftp://ftpprd.ncep.noaa.gov/pub/data/nccf/com/gfs/prod/gfs.2012121000/
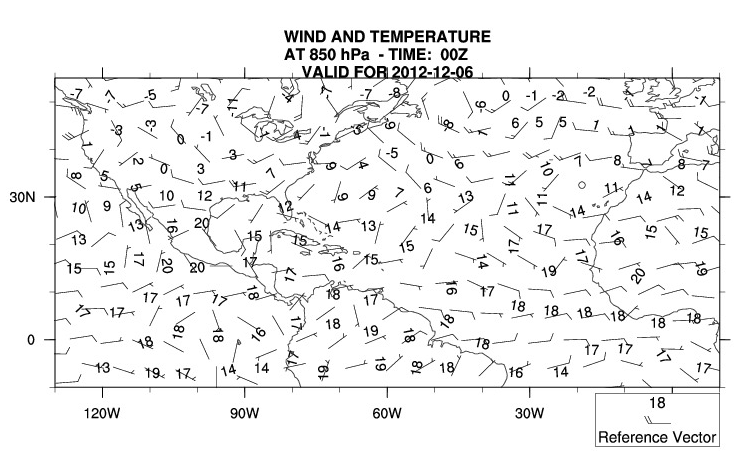
With the script (attached) I plot the map w_850.png (attached)
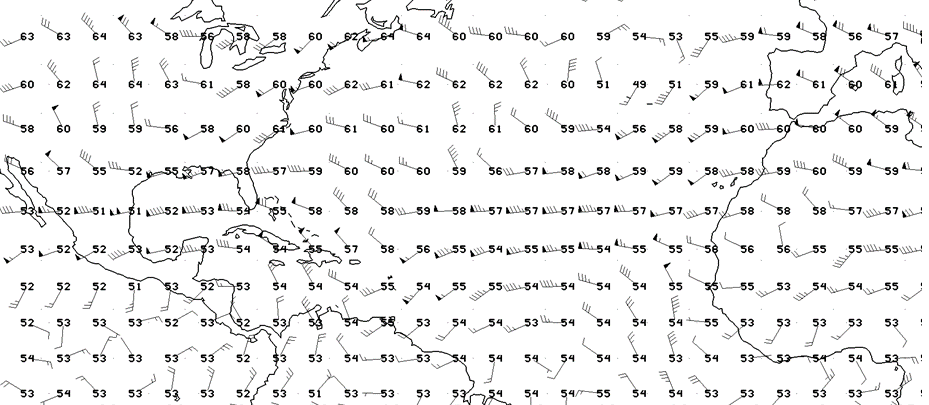
Now, how do I plot wind barbs and temperature values just like the plot
N_T_W.png (attached)?
Thanks,
Fernando
_______________________________________________
ncl-talk mailing list
List instructions, subscriber options, unsubscribe:
http://mailman.ucar.edu/mailman/listinfo/ncl-talk