Date: Mon Mar 25 2013 - 04:25:28 MDT
Hi
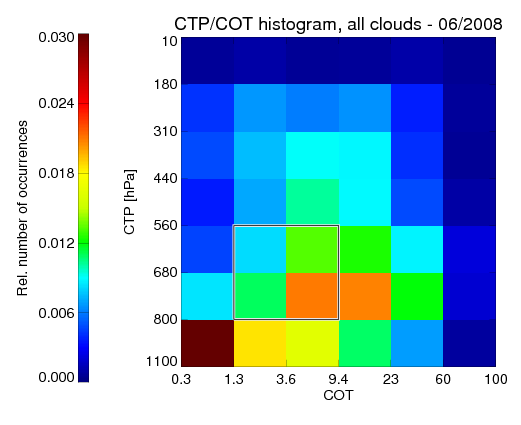
I would like to produce a 2d histogram as in the attachment. So it
should be similar to the raster plot on
http://www.ncl.ucar.edu/Applications/raster.shtml example 5 the second
one, I think. But I need to set not only sfXArray but also on the x-axis
should be the values of sfXArray only.
Does anybody have an idea how to get a similar plot?
Cheers, Michi//
_______________________________________________
ncl-talk mailing list
List instructions, subscriber options, unsubscribe:
http://mailman.ucar.edu/mailman/listinfo/ncl-talk