Date: Thu Apr 04 2013 - 14:19:37 MDT
Hi,
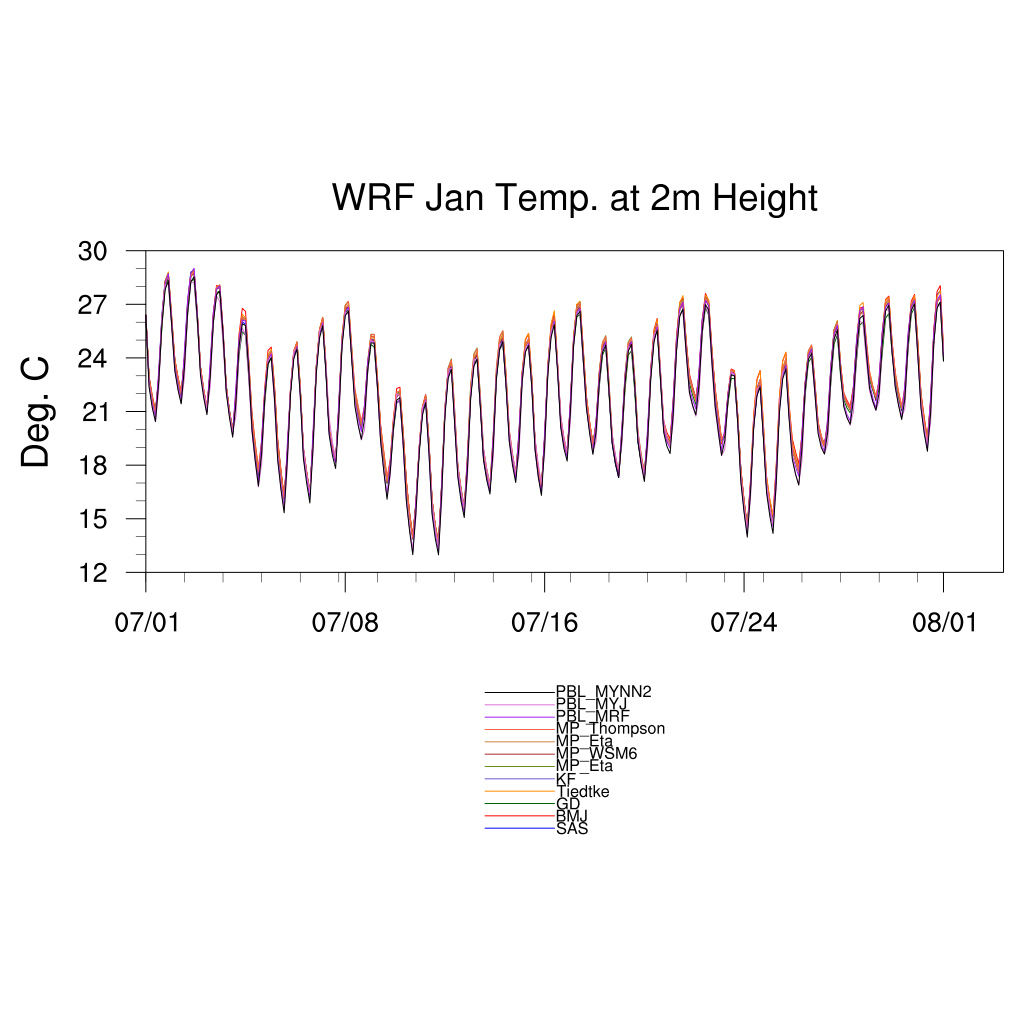
I want to split the legend into two groups as I am plotting 12 time
series in the same plot (attached image). I do not get any example in
the NCL's legend example page. Below I am attaching the plotting
parameters I have used. Can any one please help me.
Thanks in advance
Kamal
;************************************************
; plotting parameters
;************************************************
wks = gsn_open_wks("png","WRF_Temp_Jul_M_tseries")
;---Plotting options for time series plot
res = True
res@gsnMaximize = True
res@vpWidthF = 0.8
res@vpHeightF = 0.3
res@tmXTOn = False
res@tmYLFormat = "f" ; remove trailing ".0"
;************************************************
; Resource for Legend
;************************************************
res@pmLegendDisplayMode = "Always" ; turn on legend
res@pmLegendWidthF = 0.12 ; Change width and
res@pmLegendHeightF = 0.15 ; height of legend.
res@lgLabelFontHeightF = .011 ; change font height
res@lgPerimOn = False ; no box around
;************************************************
; Turn on lat / lon labeling
;************************************************
res@pmTickMarkDisplayMode = "Always" ; turn on tickmarks
res@tmXTOn = False ; turn off top labels
res@tmYROn = False ; turn off right labels
res@xyLineThicknesses = (/2.,2.,2.,2., 2.,2.,2.,2., 2.,2.,2.,2./)
; line thicknesses
res@xyDashPatterns = (/0.,0.,0.,0., 0.,0.,0.,0., 0.,0.,0.,0./)
; make all lines solid
res@xyLineColors =
(/"blue","red","darkgreen","darkorange","slateblue","olivedrab","brown","peru","tomato","purple","orchid","black"/) ; change line
color
res@xyExplicitLegendLabels =
(/"SAS","BMJ","GD","Tiedtke","KF","MP_Eta","MP_WSM6","MP_Eta","MP_Thompson","PBL_MRF","PBL_MYJ","PBL_MYNN2"/)
;--------------------------------------------------
; The time_axis_label function adds additional
; resources to "res" to produce nicely-formatted
; time labels on X axis. This function only works
; if you have a time "units" recognized by the
; cd_calendar function.
;---------------------------------------------------
restick = True
restick@ttmFormat = "%N/%D"
time_axis_labels(times,res,restick)
res@tiMainString = "WRF Jan Temp. at 2m Height"
res@tiYAxisString = data@units
res@tiMainFontHeightF = 0.025
res@tiYAxisFontHeightF = 0.025
res@tiXAxisFontHeightF = 0.025
plot = gsn_csm_xy(wks,times,data,res)
_______________________________________________
ncl-talk mailing list
List instructions, subscriber options, unsubscribe:
http://mailman.ucar.edu/mailman/listinfo/ncl-talk