Date: Fri Apr 05 2013 - 17:20:27 MDT
Hi Kamal,
Something was wrong with my mailer and I could not see your attached plot.
I created an example for you. In order to do what I think you're asking for,
you need to create separate XY plots, each with a subset of the curves,
and its own legend. You will need to move the legend to a different place
so they don't overlap.
Then, you can use te "overlay" procedure to overlay all the plots on top of each other.
See example xy_32.ncl (which I've attached) at:
http://www.ncl.ucar.edu/Applications/overlay.shtml#ex32
--Mary
On Apr 4, 2013, at 2:19 PM, mmkamal@uwaterloo.ca wrote:
> --=_667dsi2retk4
> Content-Type: text/plain;
> charset=ISO-8859-1;
> DelSp="Yes";
> format="flowed"
> Content-Disposition: inline
> Content-Transfer-Encoding: 7bit
>
> Hi,
>
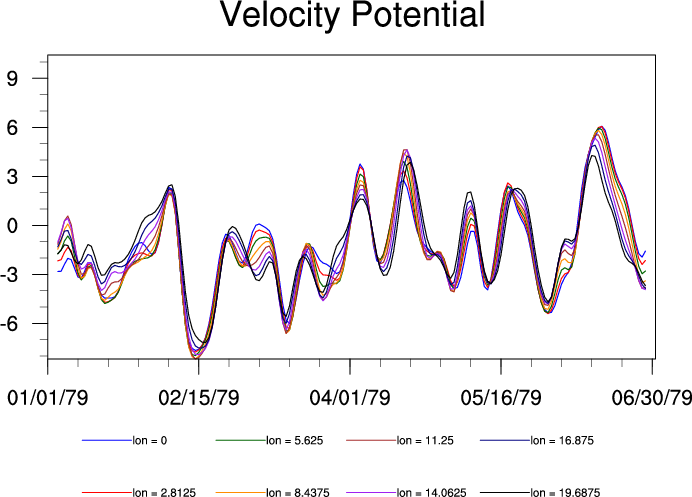
> I want to split the legend into two groups as I am plotting 12 time
> series in the same plot (attached image). I do not get any example in
> the NCL's legend example page. Below I am attaching the plotting
> parameters I have used. Can any one please help me.
>
>
> Thanks in advance
> Kamal
>
>
>
> ;************************************************
> ; plotting parameters
> ;************************************************
>
> wks = gsn_open_wks("png","WRF_Temp_Jul_M_tseries")
>
> ;---Plotting options for time series plot
> res = True
> res@gsnMaximize = True
>
> res@vpWidthF = 0.8
> res@vpHeightF = 0.3
>
> res@tmXTOn = False
> res@tmYLFormat = "f" ; remove trailing ".0"
>
> ;************************************************
> ; Resource for Legend
> ;************************************************
>
> res@pmLegendDisplayMode = "Always" ; turn on legend
>
> res@pmLegendWidthF = 0.12 ; Change width and
> res@pmLegendHeightF = 0.15 ; height of legend.
> res@lgLabelFontHeightF = .011 ; change font height
> res@lgPerimOn = False ; no box around
>
> ;************************************************
> ; Turn on lat / lon labeling
> ;************************************************
> res@pmTickMarkDisplayMode = "Always" ; turn on tickmarks
> res@tmXTOn = False ; turn off top labels
> res@tmYROn = False ; turn off right labels
>
> res@xyLineThicknesses = (/2.,2.,2.,2., 2.,2.,2.,2., 2.,2.,2.,2./)
> ; line thicknesses
> res@xyDashPatterns = (/0.,0.,0.,0., 0.,0.,0.,0., 0.,0.,0.,0./)
> ; make all lines solid
>
> res@xyLineColors =
> (/"blue","red","darkgreen","darkorange","slateblue","olivedrab","brown","peru","tomato","purple","orchid","black"/) ; change line
> color
>
> res@xyExplicitLegendLabels =
> (/"SAS","BMJ","GD","Tiedtke","KF","MP_Eta","MP_WSM6","MP_Eta","MP_Thompson","PBL_MRF","PBL_MYJ","PBL_MYNN2"/)
>
> ;--------------------------------------------------
> ; The time_axis_label function adds additional
> ; resources to "res" to produce nicely-formatted
> ; time labels on X axis. This function only works
> ; if you have a time "units" recognized by the
> ; cd_calendar function.
> ;---------------------------------------------------
> restick = True
>
> restick@ttmFormat = "%N/%D"
> time_axis_labels(times,res,restick)
>
> res@tiMainString = "WRF Jan Temp. at 2m Height"
> res@tiYAxisString = data@units
>
> res@tiMainFontHeightF = 0.025
> res@tiYAxisFontHeightF = 0.025
> res@tiXAxisFontHeightF = 0.025
>
> plot = gsn_csm_xy(wks,times,data,res)
>
>
>
> _______________________________________________
> ncl-talk mailing list
> List instructions, subscriber options, unsubscribe:
> http://mailman.ucar.edu/mailman/listinfo/ncl-talk
>
_______________________________________________
ncl-talk mailing list
List instructions, subscriber options, unsubscribe:
http://mailman.ucar.edu/mailman/listinfo/ncl-talk
- application/octet-stream attachment: xy_32.ncl