Date: Tue Jun 25 2013 - 16:30:31 MDT
Cara-Lyn,
In the future it would help if you could also include the script you're using. I don't know what subset of the array you are plotting, or what resources you've already set.
Your data doesn't contain coordinate arrays, but it contains arrays on the file that look like they are coordinates for your data, so I used these to create coordinate arrays.
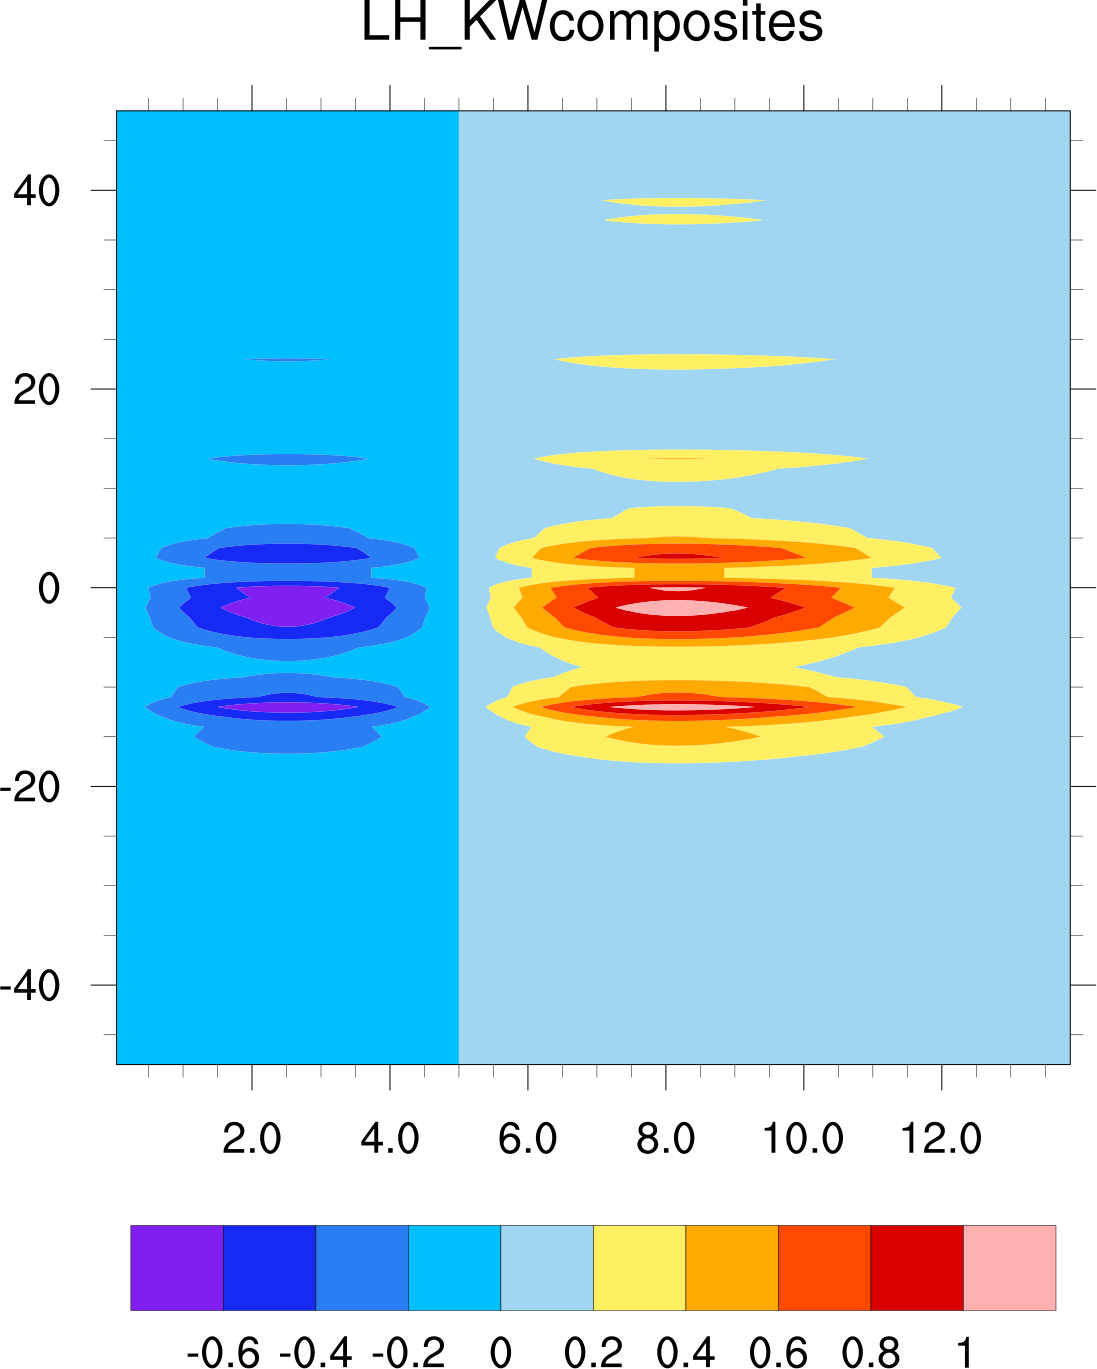
I then used gsn_csm_contour instead of gsn_contour, so that the coordinate arrays are automatically used for the X and Y axis. I did make the X axis linear, since your X values were pretty irregularly spaced.
See attached. If this is not what you want, email ncl-talk again.
--Mary
On Jun 25, 2013, at 2:06 PM, Cara-Lyn Lappen wrote:
> hi
>
> I have some data Im contouring and it keeps plotting the Y axis as logarithmic even though its supposed to default to linear.
> I tried manually set this axis to linear using the resource res@tmYLStyle = "Linear", but it will not change the plot to linear.
> Never had this problem before. I get a warning that says "warning:tmYLStyle is not a valid resource in LH_KW_contour at this time"
>
> Im using gsn_contour to do the plotting. Ive attached an ncdump of the netcdf file that contains the variables Im plotting:
>
>
> <x>
>
> Any help that anyone can offer would be much appreciated,
>
> Cara-Lyn_______________________________________________
> ncl-talk mailing list
> List instructions, subscriber options, unsubscribe:
> http://mailman.ucar.edu/mailman/listinfo/ncl-talk
_______________________________________________
ncl-talk mailing list
List instructions, subscriber options, unsubscribe:
http://mailman.ucar.edu/mailman/listinfo/ncl-talk
- application/octet-stream attachment: lh_kw_nc.ncl