Date: Sat Sep 28 2013 - 11:13:59 MDT
Hi ncl-talk,
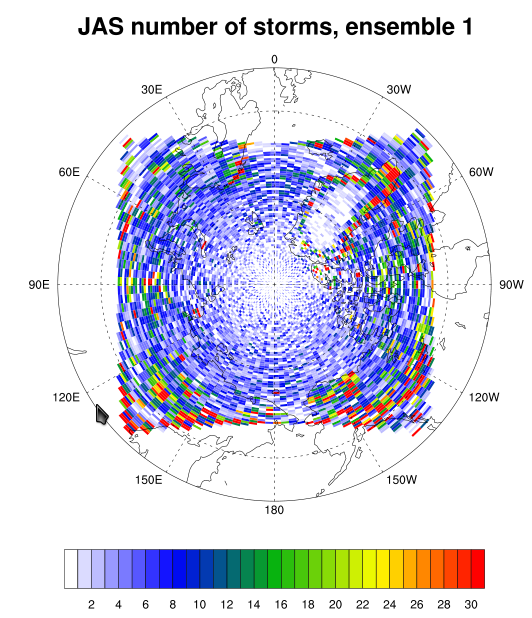
I am trying to calculate and subsequently plot the number of cyclones
per grid cell in
the Arctic Ocean domain based on the data from the ascii file
(all_sum_ens1.asc). A while ago, Adam Phillips suggested the approach
to calculate the number of storms and although the code compiled, I
believe that the pattern of cyclone density was wrong, particularly
over the Central Arctic. In the attached plot, you can see that the
cyclone density over the Central Arctic is close to 0 which is too
low. I was hoping you could suggest another approach to calculate the
number of storms (density)
passing each grid cell?
Adam Phillips suggested to calculate density by setting "arr" array:
arr = new((/100,110/),integer,-999)
arr!0 = "lat"
arr&lat = fspan(53.82,90,100)
arr&lat@units = "degrees_north"
arr!1 = "lon"
arr&lon = fspan(0,358.9,110)
arr&lon@units = "degrees_east"
printVarSummary(arr)
arr = 0 ; set array to all 0's
do gg = 0,dimsizes(slp)-1
if (.not.ismissing(lat(gg)).and..not.ismissing(lon(gg))) then ;
check to make sure lat/lons are present
arr({lat(gg)},{lon(gg)}) = (/ arr({lat(gg)},{lon(gg)})+1 /)
end if
Attached you will find the code and plot.
The data file (ascii) is on your ftp server under name all_sum_ens3.asc.
_______________________________________________
ncl-talk mailing list
List instructions, subscriber options, unsubscribe:
http://mailman.ucar.edu/mailman/listinfo/ncl-talk
- text/plain attachment: ncl_code.txt