Date: Sun Nov 03 2013 - 22:08:44 MST
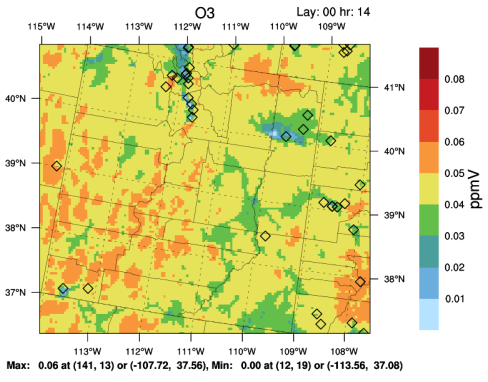
Hi Mary, thanks a lot for the pointers! I've been able to make the
corrections and to display the "locations" of the observation sites on the
map as shown in the attached figure. You're absolute right, the problem
has been the dimension sizes of the arrays that I want to pass to
gsn_add_polymarker.
[image: Inline image 1]
My next hurdle is to display the observation values that can be shown as
colors based on the same color map used for the model data. I prefer not
to define separate color labels for the observation data that is shown in
the example plots #3 in: http://ncl.ucar.edu/Applications/polyg.shtml
What would be the appropriate approach to accomplish this? Again, really
appreciate any help for this!
Thanks,
Chao-Jung
On Sun, Nov 3, 2013 at 7:30 PM, Mary Haley <haley@ucar.edu> wrote:
>
> On Nov 1, 2013, at 10:13 AM, Chao-Jung Chien <chaojung.chien@gmail.com>
> wrote:
>
> Thanks Paula for the pointer! I've looked at the examples there, and I am
> still struggling getting my observation data plotted. Any help from you or
> the community is appreciated!
>
> Here is the header info from my netcdf formatted observational data:
>
> -------------------------------------------- header info of obs. data in
> ncf ----------------------------------------
> netcdf AQS_houly_O3.2010 {
> dimensions:
> TSTEP = UNLIMITED ; // (8760 currently)
> DATE-TIME = 2 ;
> LAY = 1 ;
> VAR = 4 ;
> COL = 593 ;
> variables:
> int TFLAG(TSTEP, VAR, DATE-TIME) ;
> TFLAG:units = "<YYYYDDD,HHMMSS>" ;
> TFLAG:long_name = "TFLAG " ;
> TFLAG:var_desc = "Timestep-valid flags: (1) YYYYDDD or
> (2) HHMMSS " ;
> int STNID(TSTEP, LAY, COL) ;
> STNID:long_name = "STNID " ;
> STNID:units = "none " ;
> STNID:var_desc =
> "StationID:SiteCode_CountyCode_SiteCode(00_000_0000)
> " ;
> float LAT(TSTEP, LAY, COL) ;
> LAT:long_name = "LAT " ;
> LAT:units = "degrees " ;
> LAT:var_desc = "Latitude for monitor station
> " ;
> float LON(TSTEP, LAY, COL) ;
> LON:long_name = "LON " ;
> LON:units = "degrees " ;
> LON:var_desc = "Longitude for monitor station
> " ;
> float G_O3(TSTEP, LAY, COL) ;
> G_O3:long_name = "O3 " ;
> G_O3:units = "ppmV " ;
> G_O3:var_desc = "Observed value, or MISSING < -999.0
> " ;
>
> // global attributes:
> :IOAPI_VERSION = "$Id: @(#) ioapi library version 3.0 $
> " ;
> :EXEC_ID = "????????????????
> " ;
> :FTYPE = -1 ;
> :CDATE = 2013303 ;
> :CTIME = 234853 ;
> :WDATE = 2013303 ;
> :WTIME = 234853 ;
> :SDATE = 2010001 ;
> :STIME = 0 ;
> :TSTEP = 10000 ;
> :NTHIK = 1 ;
> :NCOLS = 593 ;
> :NROWS = 1 ;
> :NLAYS = 1 ;
> :NVARS = 4 ;
> :GDTYP = 1 ;
> :P_ALP = 0. ;
> :P_BET = 0. ;
> :P_GAM = 0. ;
> :XCENT = 0. ;
> :YCENT = 0. ;
> :XORIG = 0. ;
> :YORIG = 0. ;
> :XCELL = 0. ;
> :YCELL = 0. ;
> :VGTYP = -9999 ;
> :VGTOP = -9.999e+36f ;
> :VGLVLS = 0.f, 0.f ;
> :GDNAM = "LATLON " ;
> :UPNAM = "" ;
> :VAR-LIST = "STNID LAT LON
> O3 " ;
> :FILEDESC = "Obs. Query to IOAPI format for overlay plots
> " ;
> :HISTORY = "" ;
> }
>
>
> ------------------------------------------------------------------------------------------------------------------------
>
> As you can see, the file is time-stamped with concentration values for
> each station which has associated lat lon values.
>
> I am already able to plot the base map with model results using
> "gsn_csm_contour_map", and I assume I will need to use "gsn_add_polymarker"
> function to overlay the stations results to the map. I try the
> following script in ncl for observation station:
>
>
> ---------------------------------------------------------------------------------
> ; read obs data in ncf format
>
> o = addfile("AQS_houly_O3.2010.nc <http://aqs_houly_o3.2010.nc/>","r")
> obs_spec = o->G_O3
> obs_lat = o->LAT
> obs_lon = o->LON
> obs_spec@obs_lat = obs_lat
> obs_spec@obs_lon = obs_lon
>
> olat = dimsizes(obs_lat(:,0))
> olon = dimsizes(obs_lat(0,:))
>
>
> ; plot polymarkers
> polyres = True
> polyres@gsMarkerIndex = 9
> polyres@gsMarkerSizeF = 2.0
>
> dum1 = gsn_add_polymarker(wks,plot,olon,olat,polyres)
>
>
> -----------------------------------------------------------------------------------
>
> but are getting the error:
>
> fatal:Number of subscripts do not match number of dimensions of
> variable,(2) Subscripts used, (3) Subscripts expected
>
> It seems there is probably an easy fix, but I'd be more than happy to hear
> from the experts whether I am in the right direction of creating the
> observation overlay plots.
>
> Thanks so much!
> Chao-Jung
>
>
> Chao-Jung,
>
> The error message is telling you that you are trying to subscript a
> 3-dimensional array as if it were a 2-dimensional array.
>
> The problem is with this code:
>
> olat = dimsizes(obs_lat(:,0))
> olon = dimsizes(obs_lat(0,:))
>
>
> "obs_lat" and "obs_lon" are 3-dimensional.
>
> I don't think those are the lines that you want anyway, because you are
> simply getting the dimension sizes of the arrays and then passing this to
> gsn_add_polymarker, which doesn't make sense.
>
> I think you mean to do this:
>
> it = 0 ; or whatever time step you
> want
>
> obs_lat = o->LAT(it,:,:)
> obs_lon = o->LON(it,:,:)
>
> ; plot polymarkers
> polyres = True
> polyres@gsMarkerIndex = 9
> polyres@gsMarkerSizeF = 2.0
>
> dum1 = gsn_add_polymarker(wks,plot,obs_lon,obs_lat,polyres)
>
>
> Note that I'm now passing obs_lon and obs_lat directly.
>
> --Mary
>
>
>
>
>
>
> On Thu, Oct 31, 2013 at 8:54 AM, Paula Doubrawa <pdoubraw@indiana.edu>wrote:
>
>> Hello,
>>
>> check out example 2 here
>>
>> http://www.ncl.ucar.edu/Applications/station.shtml
>>
>> station data colored according to a colorbar
>>
>> Paula
>>
>>
>> On Thu, Oct 31, 2013 at 11:52 AM, Chao-Jung Chien <
>> chaojung.chien@gmail.com> wrote:
>>
>>> Thanks Rick! Yes, I've looked at the polygons examples, and I can plot
>>> the stations over the model results on a map. But what I really want is to
>>> be able to show the actual values of the stations (rather than just
>>> dots/markers) that use the same color scales as those for model results.
>>> The model results are being shown using gsn_csm_contour_map. It seems
>>> gsn_add_polymarker can only put the location markers on the plot, rather
>>> than their own values?
>>>
>>> Again, any help on this is appreciated!
>>>
>>> Chao-Jung
>>>
>>>
>>>
>>> On Thu, Oct 31, 2013 at 6:20 AM, <brownrig@ucar.edu> wrote:
>>>
>>>> Hi,
>>>>
>>>> Have you checked out the examples at:
>>>>
>>>> http://ncl.ucar.edu/Applications/polyg.shtml
>>>>
>>>> Example #3 in particular seems to come closest to what you want to do.
>>>> The first half of that script deals with subsetting and manipulating data
>>>> into an appropriate form; depending upon your data, you may likely be able
>>>> to ignore that part. Everything from the comment "create plot" to the end
>>>> would be relevent to creating your plot, with the real essense of it being
>>>> those 8 lines after the comment "plot original data".
>>>>
>>>> Hope that helps...
>>>> Rick
>>>>
>>>>
>>>> On Wed, 30 Oct 2013 22:12:48 -0700
>>>> Chao-Jung Chien <chaojung.chien@gmail.com> wrote:
>>>>
>>>>> Hi, sorry for the newbie question. I am trying to create a similar
>>>>> plot
>>>>> like attached using NCL. Notice that the observational data are
>>>>> presented
>>>>> in diamonds, which are overlaying a gridded model results over a
>>>>> certain
>>>>> region (map).
>>>>>
>>>>> Both observation and model data are already in netcdf file formats. The
>>>>> observation data have the time-stamped values and associated lat/lon
>>>>> info
>>>>> for each station.
>>>>>
>>>>> Any existing NCL examples or pointers on how to create such an overlay
>>>>> plot
>>>>> are greatly appreciated.
>>>>>
>>>>> Thanks,
>>>>> Chao-Jung
>>>>>
>>>>
>>>>
>>>
>>> _______________________________________________
>>> ncl-talk mailing list
>>> List instructions, subscriber options, unsubscribe:
>>> http://mailman.ucar.edu/mailman/listinfo/ncl-talk
>>>
>>>
>>
> _______________________________________________
> ncl-talk mailing list
> List instructions, subscriber options, unsubscribe:
> http://mailman.ucar.edu/mailman/listinfo/ncl-talk
>
>
>
_______________________________________________
ncl-talk mailing list
List instructions, subscriber options, unsubscribe:
http://mailman.ucar.edu/mailman/listinfo/ncl-talk