Date: Mon Nov 25 2013 - 20:48:38 MST
Hi folks,
I followed scatter_9.ncl in
http://www.ncl.ucar.edu/Applications/interp1d.shtml to fit a
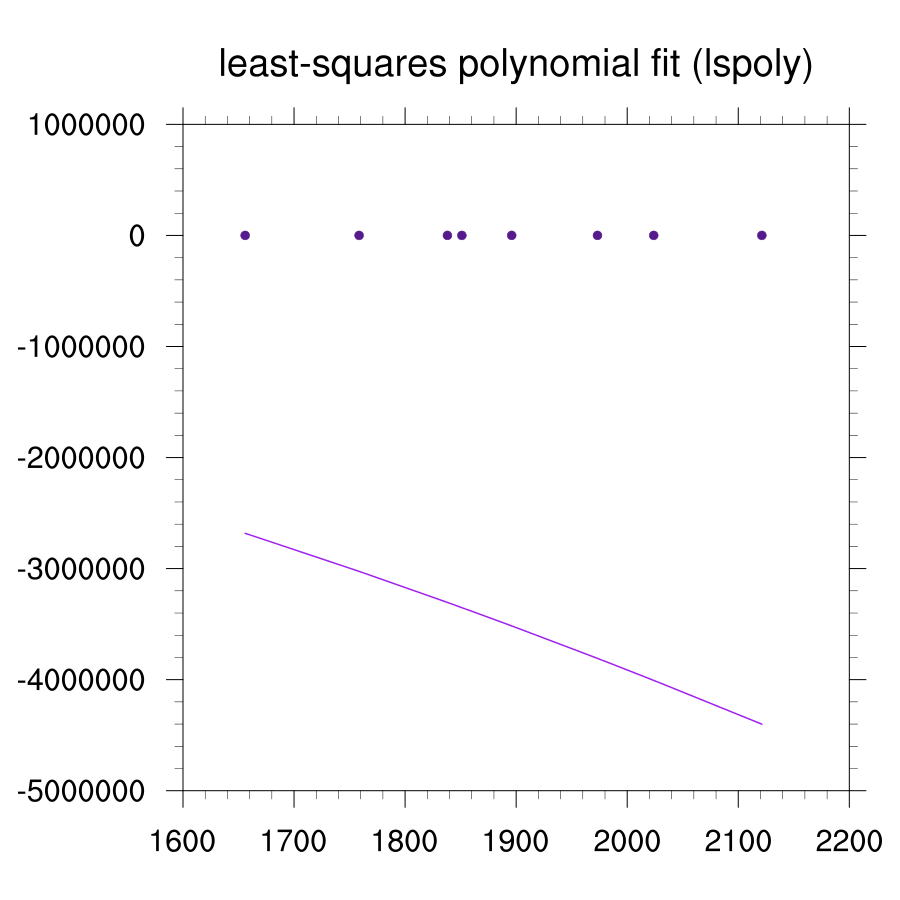
curve. But when the input data (e.g., x, y) was replaced by my
series, the fitted curve is completely out of data range, which
is obviously wrong.
The script, data and output figure are attached.
A trivial slip is coefficients should be timed by "x" rather
than "y" in line 24 of original example script. Am I right?
Hui Wu
;----------------------------------------------------------------------
; scatter_9.ncl
;
; Concepts illustrated:
; - Drawing a scatter plot with a line through it
; - Generating dummy data using "random_uniform"
; - Using "lspoly" to approximate a line through a random set of points
;----------------------------------------------------------------------
load "$NCARG_ROOT/lib/ncarg/nclscripts/csm/gsn_code.ncl"
load "$NCARG_ROOT/lib/ncarg/nclscripts/csm/gsn_csm.ncl"
;----------------------------------------------------------------------
begin
data = asciiread("/media/TOSHIBA/Untitled 1.txt", -1, "string")
x = stringtofloat(str_get_field(data(1:22:3), 2, " "))
y = new((/2, dimsizes(x)/), float)
y(0,:) = stringtofloat(str_get_field(data(1:22:3), 3, " "))
;---Generate some random data
; nx = 20
; x = ispan(1,nx,1)
; y = new((/2,nx/),float)
; y(0,:) = random_uniform(1.,50.,nx)
;
; Calculate a set of coefficients for a lesat-squares
; polynomial fit. All weights are set to 1.
;
c = lspoly(x, y(0,:), 1, 3)
y(1,:) = c(0) + c(1)*x + c(2)*(x^2)
;---Start the graphics.
wks = gsn_open_wks ("png","scatter_09") ; open workstation
res = True ; plot mods desired
res@gsnMaximize = True
res@tiMainString = "least-squares polynomial fit (lspoly)"
res@xyMarkLineModes = (/"Markers","Lines"/)
res@xyMarker = 16 ; Change type, size, and
res@xyMarkerSizeF = 0.008 ; color of marker
res@xyMarkerColor = "purple4"
res@xyDashPattern = 0 ; Change type, thickness,
res@xyLineThicknessF = 3.0 ; and color of line
res@xyLineColor = "purple"
plot = gsn_csm_xy (wks, x, y, res)
end
X Y
(0) 1655.981 533
(1) 1682.03 336.5
(2) 1750.101 464
(3) 1758.582 446.25
(4) 1762.833 519.25
(5) 1784.497 482.8333
(6) 1838.11 688.8333
(7) 1841.767 515.25
(8) 1844.658 627.0833
(9) 1851.094 440.9167
(10) 1876.948 597.6667
(11) 1881.497 546.25
(12) 1895.963 648.25
(13) 1912.66 493
(14) 1949.357 889.3333
(15) 1973.219 631.25
(16) 1984.093 442.0833
(17) 1994.771 439.5
(18) 2023.853 577.75
(19) 2031.365 755.0833
(20) 2092.364 698.5
(21) 2121.23 548.8333
(22) 2152.423 762.6667
(23) 2158.989 539.05
(24) 2168.472 478.5833
(25) 2186.927 990.3333
(26) 2322.844 938.9167
(27) 2362.603 1035.667
(28) 2395.142 588.25
(29) 2447.299 805.3
_______________________________________________
ncl-talk mailing list
List instructions, subscriber options, unsubscribe:
http://mailman.ucar.edu/mailman/listinfo/ncl-talk