Date: Sat Dec 14 2013 - 16:32:27 MST
Hi all,
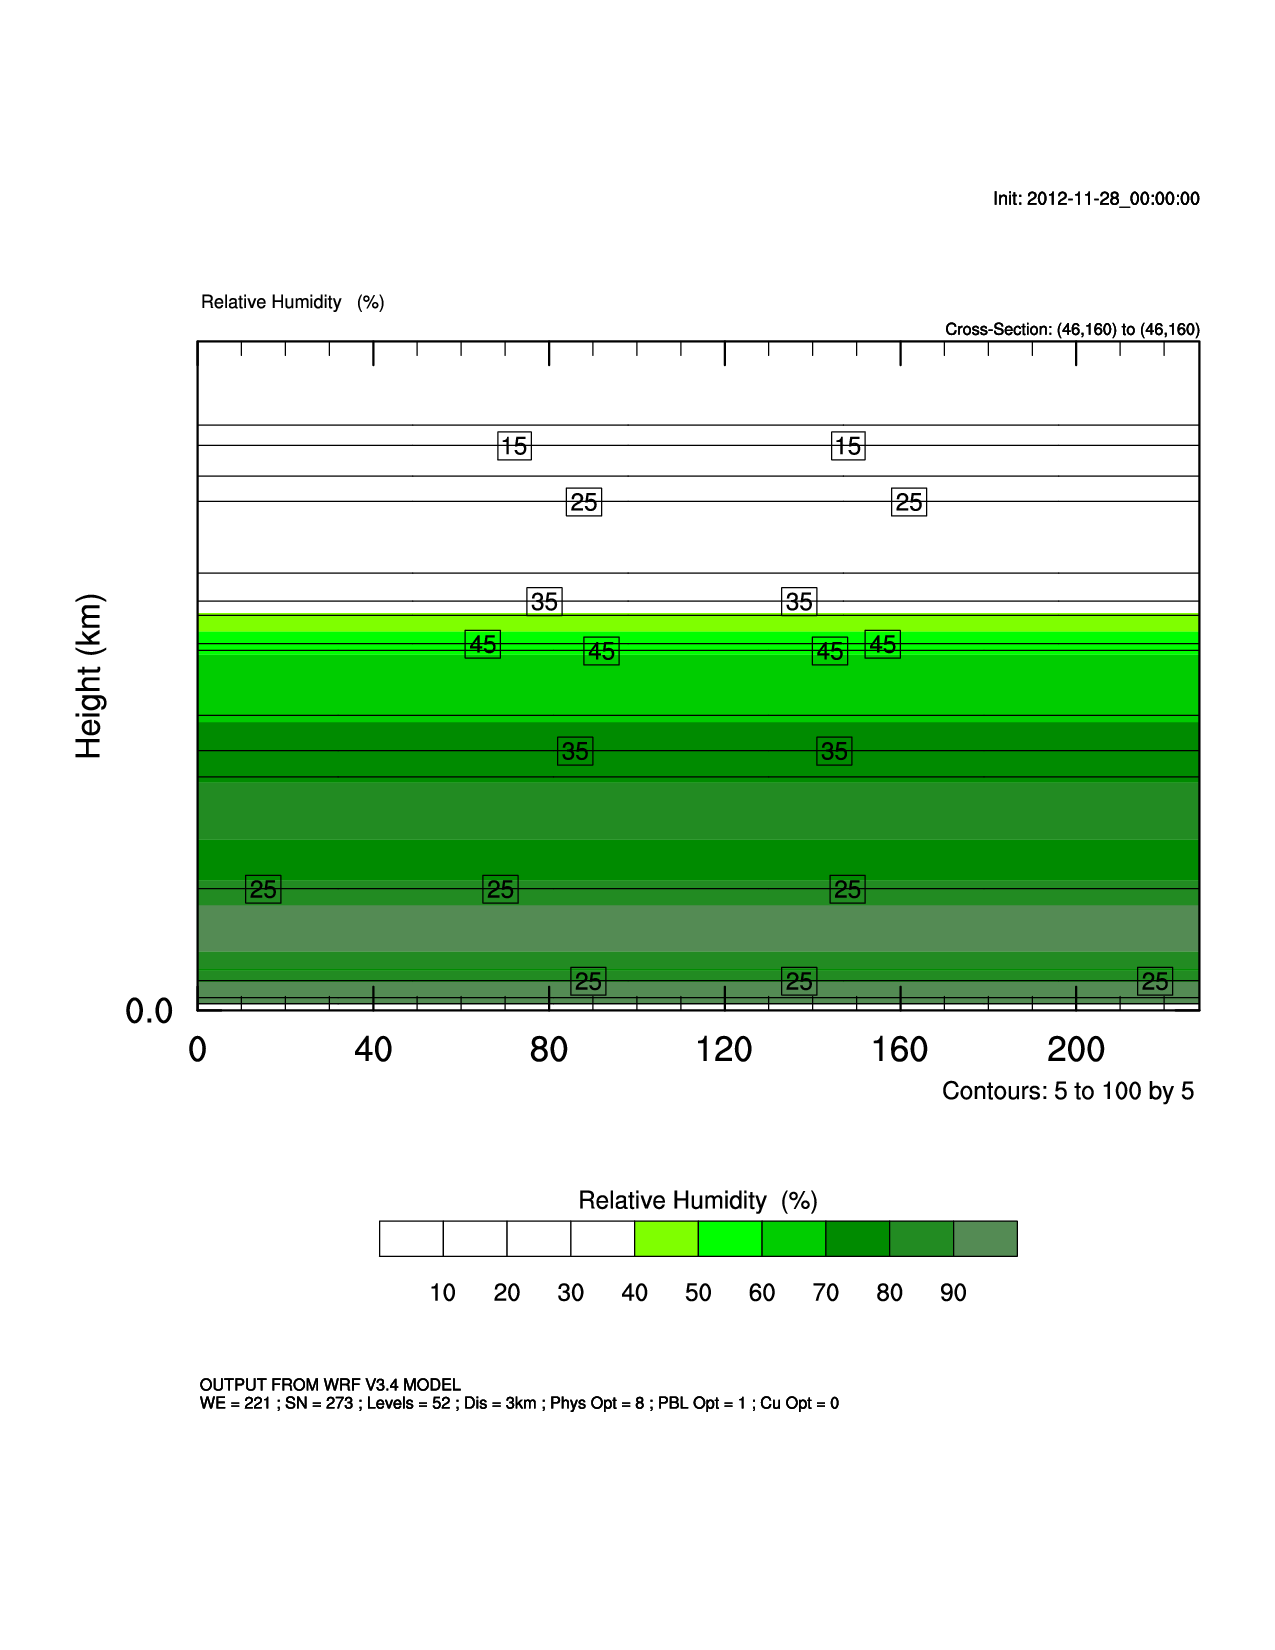
I am trying to make a cross section plot from WRF data from 2 points. I get
a plot, but it is only making a plot of one point and it is not going to
the next point, so all my plots are just constant value contours with
height. I am not sure where my problem is. I've attached an image to show.
Code:
load "$NCARG_ROOT/lib/ncarg/nclscripts/csm/gsn_code.ncl"
load "$NCARG_ROOT/lib/ncarg/nclscripts/csm/contributed.ncl"
load "$NCARG_ROOT/lib/ncarg/nclscripts/wrf/WRFUserARW.ncl"
load "$NCARG_ROOT/lib/ncarg/nclscripts/wrf/WRF_contributed.ncl"
begin
case ="run3.1"
cmd ="ls -1 /data2/eiserloh/data/AR/" + case + "/wrfout_d02_2012*" ;frost
files = systemfunc(cmd) + ".nc"
a = addfiles(files,"r")
times = wrf_user_list_times(a) ; get times in the files
ntimes = dimsizes(times)
pt_a= wrf_user_ll_to_ij(a[0],-126.0,41.0,True)
pt_b= wrf_user_ll_to_ij(a[0],-121.8,35.0,True)
print(pt_a)
print(pt_b)
plane=(/ pt_a(0),pt_a(1),pt_b(0),pt_b(1) /)
print(plane)
pltres=True
type = "ps"
do it=0,ntimes-1
print("Working on time: " + times(it))
wks = gsn_open_wks(type,"cxsect_line1"+"_"+tostring(it))
; Extract cross section from point A to point B, as defined in "plane"
; And vertically interpolate to either height or p coordinates
z = wrf_user_getvar(a[it],"z",0)
rh = wrf_user_getvar(a[it],"rh",0)
u = wrf_user_getvar(a[it],"ua",0)
v = wrf_user_getvar(a[it],"va",0)
ws = ((u^2)+(v^2))^(0.5)
rh_plane = wrf_user_intrp3d(rh,z,"v",plane,0.,True) ;True if cross sect
from ptA to ptB
ws_plane = wrf_user_intrp3d(ws,z,"v",plane,0.,True)
res = True
res@gsnDraw = False
res@gsnFrame= False
; Options for XY Plots
opts_xy = res
opts_xy@tiYAxisString = "Height (km)"
opts_xy@cnMissingValPerimOn = True
opts_xy@cnMissingValFillColor = 0
opts_xy@cnMissingValFillPattern = 11
opts_xy@tmYLMode = "Explicit"
opts_xy@tmYLValues = fspan(0,15,1)
; Create tick marks
opts_xy@tmYLLabels = sprintf("%.1f",fspan(0,15,1)) ;
Create labels
opts_xy@tiXAxisFontHeightF = 0.020
opts_xy@tiYAxisFontHeightF = 0.020
opts_xy@tmXBMajorLengthF = 0.02
opts_xy@tmYLMajorLengthF = 0.02
opts_xy@tmYLLabelFontHeightF = 0.015
opts_xy@PlotOrientation = ws_plane@Orientation
; Plotting options for RH
opts_rh = opts_xy
opts_rh@ContourParameters = (/ 10., 90., 10. /)
opts_rh@pmLabelBarOrthogonalPosF = -0.07
opts_rh@cnFillOn = True
opts_rh@cnFillColors = (/"White","White","White", \
"White","Chartreuse","Green", \
"Green3","Green4", \
"ForestGreen","PaleGreen4"/)
; Plotting options for windspeed
opts_ws = opts_xy
opts_ws@ContourParameters =(/5.0,100.0,5.0/)
opts_ws@cnFillOn = False
;Get the contour info for the rh and temp
contour_ws = wrf_contour(a[it],wks,ws_plane,opts_ws)
contour_rh = wrf_contour(a[it],wks,rh_plane,opts_rh)
; MAKE PLOTS
plot = wrf_overlays(a[it],wks,(/contour_rh,contour_ws/),pltres)
delete(wks)
end do
end
--
Arthur J. Eiserloh, Jr.
San Jose State University
Graduate Student
Dept. of Meteorology and Climate Science
_______________________________________________
ncl-talk mailing list
List instructions, subscriber options, unsubscribe:
http://mailman.ucar.edu/mailman/listinfo/ncl-talk