Date: Mon Dec 16 2013 - 09:31:58 MST
What you are doing should work, but it's hard to tell from your script below. Also, why are you doing this:
> res@xyExplicitLegendLabels =stringtochar(label1)
You want this to stay a string, so I think you just want:
> res@xyExplicitLegendLabels =label1
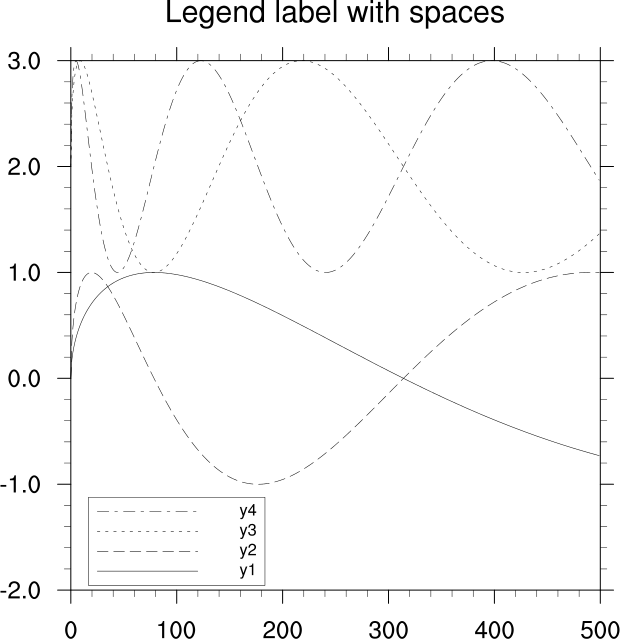
You may need to add several spaces before you see any effect.
Please run the attached script, and you should see the spaces in the labels. Note that I had to make the legend wider in order to keep the legend labels from getting smaller in order to fit in the given legend box size.
--Mary
On Dec 15, 2013, at 7:16 AM, ren.whc@gmail.com wrote:
> hello
> I'm trying to add one or two <space> between legend line and lebel in xy plot so that they would not be so close , I add some space in
> res@xyExplicitLegendLabels = (/" Ensemble Mean"/)
> but there are no space in the plot ,the result is the same as (/"Ensemble Mean"/) .
> I want <AR0@X)GCAYF7WX_S(12-15-22-15-19).jpg> to be <WD7)QI25G@CCO[{I(12-15-22-15-19).jpg> <5]`@5%Z$7199Z28$(12-15-22-15-19).jpg>,could you help me ?
>
> all codes are as follows
> res = True
> res@vpHeightF = 0.5 ; Changes the aspect ratio
> res@vpWidthF = 0.7
> res@vpXF = 0.10 ; change start locations
> res@vpYF = 0.85 ; the plot
> res@gsnDraw = False
> res@gsnFrame = False
>
> res@xyDashPatterns = (/0,0,1,0,1,0,1,0,1,0,1,0,1,0,1,0,1,0,1,0,1,0,1,0/)
> res@xyLineColors = (/"red","black",\
> "gray","gray","gray","gray","gray","gray","gray","gray","gray","gray","gray","gray","gray","gray","gray","gray","gray","gray","gray","gray","gray","gray"/)
> res@xyLineThicknesses = (/3,3,1,1,1,1,1,1,1,1,1,1,1,1,1,1,1,1,1,1,1,1,1,1/)
> res@tmXBMode = "Explicit"
> res@tmXBValues = ispan(ybg,yed,25)
> res@tmXBLabels = ispan(ybg,yed,25)
> ; res@tmXBLabelStride = 10
> res@tmXBMinorValues =ispan(ybg,yed,5)
> ;res@tmLabelAutoStride = True ; nice stride on labels
> res@gsnStringFontHeightF = 0.03
> ; res@tiMainString = "Arctic Oscillation Index - historical"
> res@tiMainFontHeightF =0.02
>
>
> res@trXMinF = 1901
> res@trXMaxF = 2005
> res@trYMinF = -5
> res@trYMaxF = 5
>
> res@tmXBLabelFontHeightF = 0.014
> res@tmYLLabelFontHeightF = 0.014
>
> plot1 = gsn_csm_xy(wks,ispan(ybg,yed,1),data_output,res)
> res@pmLegendDisplayMode = "Always" ; turn on legend
> res@lgPerimOn = False
> res@pmLegendWidthF = 0.1 ; Change width and
> res@pmLegendHeightF = 0.07 ; height of legend.
> res@lgLabelFontHeightF = .012 ; change font height
> res@pmLegendOrthogonalPosF = -0.3 ; move up slightly
> res@lgBoxMinorExtentF = 0.6
> delete(res@xyLineColors)
> res@xyLineColors = "red"
> res@xyExplicitLegendLabels = (/" Ensemble Mean"/)
> res@pmLegendParallelPosF = 0.75
>
> plot2 = gsn_csm_xy(wks,ispan(ybg,yed,1),data_output(0,:),res)
> res@xyLineColors = "black"
> label1=(/" OBS-HadSLP2"/)
> print(strlen(label1))
> res@xyExplicitLegendLabels =stringtochar(label1)
> res@pmLegendParallelPosF = 0.25
>
> plot3 = gsn_csm_xy(wks,ispan(ybg,yed,1),data_output(1,:),res)
> overlay(plot1,plot3)
> overlay(plot1,plot2)
> draw(plot1)
> frame(wks)
>
> ren.whc@gmail.com
> <AR0@X)GCAYF7WX_S{LB2}X2.jpg><AR0@X)GCAYF7WX_S{LB2}X2.jpg>_______________________________________________
> ncl-talk mailing list
> List instructions, subscriber options, unsubscribe:
> http://mailman.ucar.edu/mailman/listinfo/ncl-talk
_______________________________________________
ncl-talk mailing list
List instructions, subscriber options, unsubscribe:
http://mailman.ucar.edu/mailman/listinfo/ncl-talk
- application/octet-stream attachment: xy.ncl