Date: Tue Jan 14 2014 - 09:50:44 MST
Good Afternoon,
I am attempting to plot water vapor mixing ratio (calculated to be in g/kg)
contoured with wind barbs. Unfortunately, I cannot get the contours to
appear. I am using the same exact routine that I did for contouring wind
magnitudes (which contours just fine).
The only difference is that my water vapor mixing ratio variable (qvap) has
to be calculated instead of being drawn directly as a variable from the
model itself. This should not make a difference though. I checked the
status of the qvap variable (using printVarSummary, printMinMax, and print)
and the numbers look excellent at all levels, with no missing values or
anything else out of the ordinary. By deductive reasoning, it should be
easy to contour like the wind magnitude. I honestly do not know what could
be wrong with the variable data and why it cannot be contoured. Perhaps the
numbers are distributed in such a way that they cannot be contoured
properly? Perhaps I need another special resource? I appreciate any input
that can be provided.
I am attaching the code with problems contouring the water vapor
(ruc_qheight.ncl), as well as the similar code that does work for wind
magnitudes (ruc_wheight.ncl) so that they can be compared/contrasted (if
necessary). I also imported my data file (via ftp) which is the
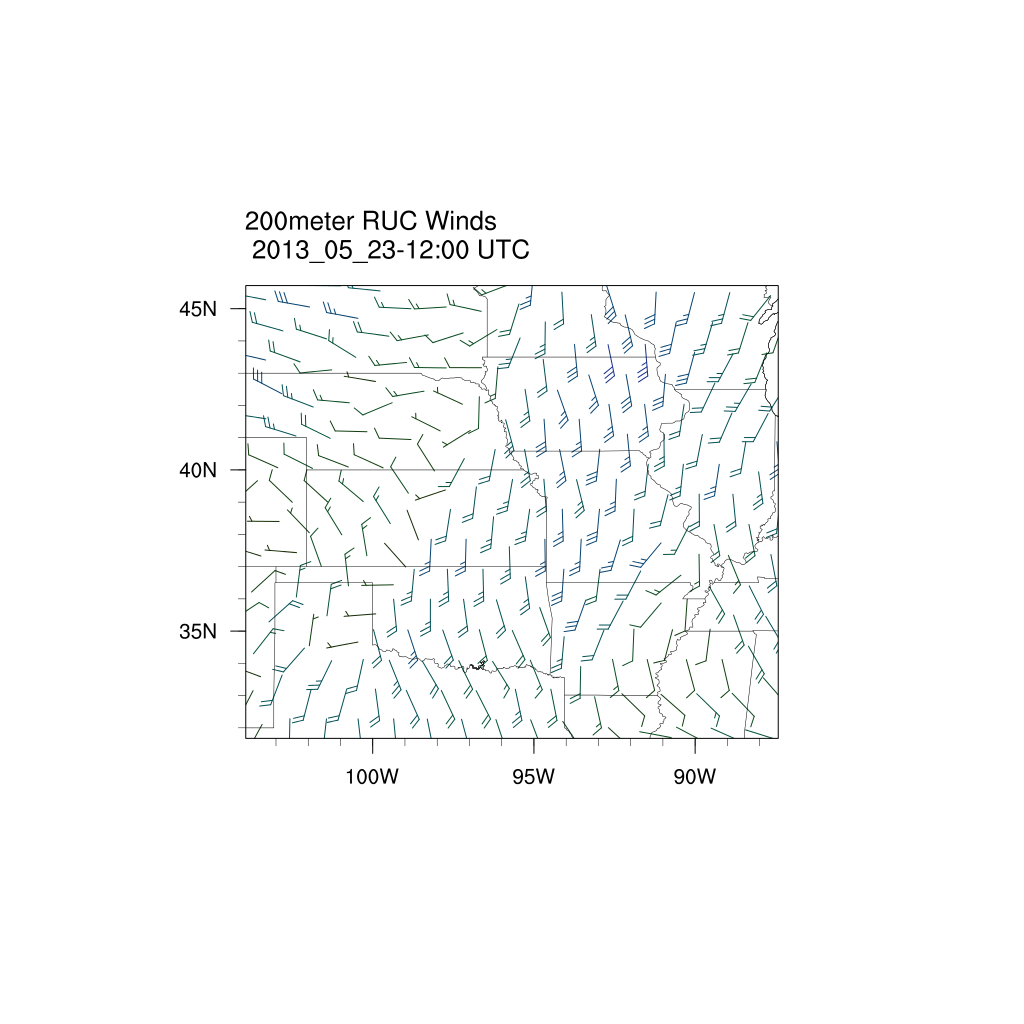
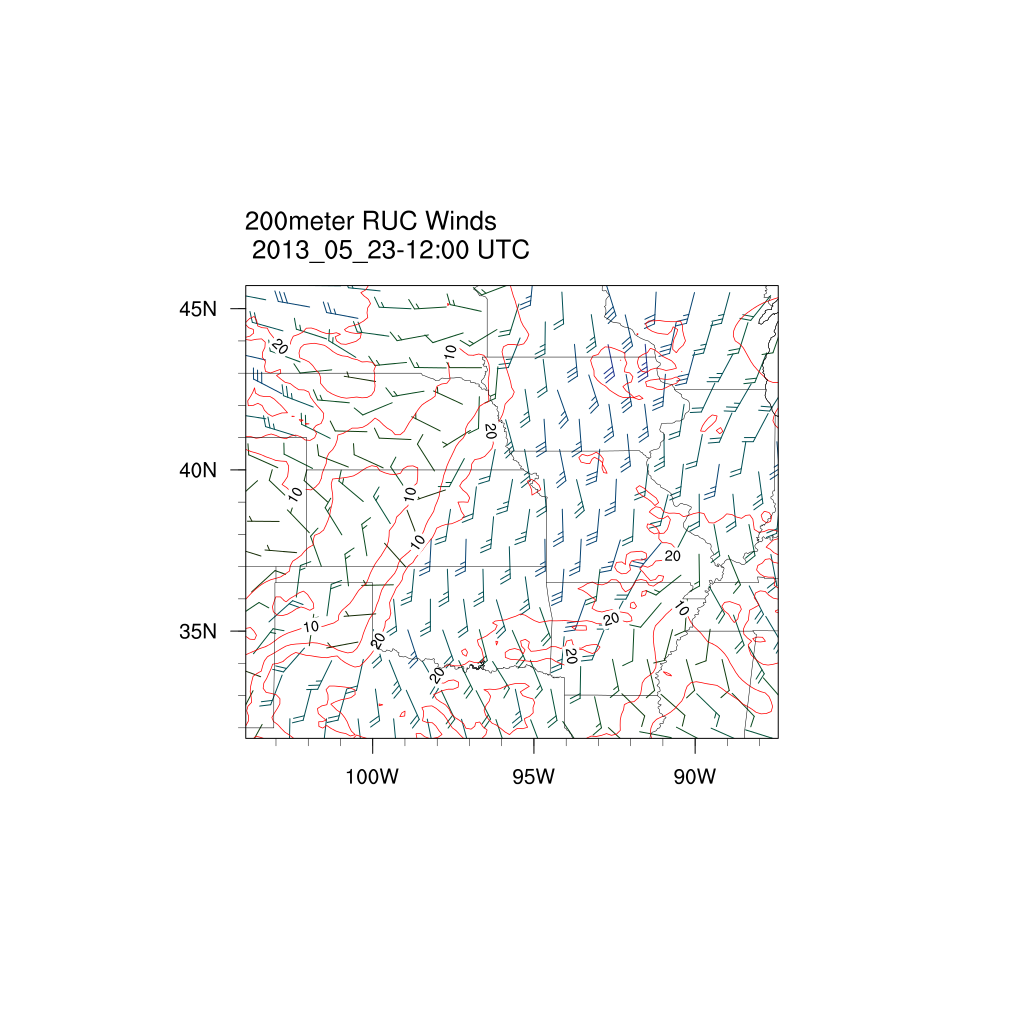
cat_file.cdf. The images attached are with wind magnitude contours (which
works) and qvapor contours (which are missing).
Again, any help would be greatly appreciated.
Brian Squitieri
Graduate Research Assistant
Iowa State University
_______________________________________________
ncl-talk mailing list
List instructions, subscriber options, unsubscribe:
http://mailman.ucar.edu/mailman/listinfo/ncl-talk

- application/octet-stream attachment: ruc_qheight.ncl

- application/octet-stream attachment: ruc_wheight.ncl