Hi, Cala:
I don't know why your do loop is outside of "begin end" command.
I usually put do end do inside "begin end"
-----Original Message-----
From: ncl-talk-request@ucar.edu
Sent: Friday, February 28, 2014 1:00 PM
To: ncl-talk@ucar.edu
Subject: ncl-talk Digest, Vol 123, Issue 33
Send ncl-talk mailing list submissions to
ncl-talk@ucar.edu
To subscribe or unsubscribe via the World Wide Web, visit
http://mailman.ucar.edu/mailman/listinfo/ncl-talk
or, via email, send a message with subject or body 'help' to
ncl-talk-request@ucar.edu
You can reach the person managing the list at
ncl-talk-owner@ucar.edu
When replying, please edit your Subject line so it is more specific
than "Re: Contents of ncl-talk digest..."
Today's Topics:
1. Contour Smoothing (Clark, Brandi L)
2. Re: Contour Smoothing (Adam Phillips)
3. compute Pearson correlation coefficient in NCL (zhangbinrc)
4. Unusual ind()/ind_resolve() behaviour (Will Hobbs)
5. Re: compute Pearson correlation coefficient in NCL (Dennis Shea)
6. Re: Unusual ind()/ind_resolve() behaviour (Dennis Shea)
7. Re: Unusual ind()/ind_resolve() behaviour (Will Hobbs)
8. BUS ERROR (Thomas Tobian)
9. Re: BUS ERROR (Karin Meier-Fleischer)
10. looping to create a graph from many different files (Ciara O'Hara)
11. Re: Why doesn't my text show up in my plot?
(Craig Tierney - NOAA Affiliate)
12. Re: Adding polygons to a Skew-T plot (Mary Haley)
13. Re: Why doesn't my text show up in my plot? (Mary Haley)
----------------------------------------------------------------------
Message: 1
Date: Thu, 27 Feb 2014 20:46:36 +0000
From: "Clark, Brandi L" <brandi.clark@mavs.uta.edu>
Subject: Contour Smoothing
To: "ncl-talk@ucar.edu" <ncl-talk@ucar.edu>
Message-ID:
<21fdebcca0d54d52a8364c912525cd34@BN1PR01MB183.prod.exchangelabs.com>
Content-Type: text/plain; charset="us-ascii"
I am trying to smooth the surface temperature contours on a cylindrical
equidistant map of the CESM RCP 8.5 simulation for July 2020. I don't
understand the documentation on the NCL webpage for the function smth9
http://www.ncl.ucar.edu/Document/Functions/Built-in/smth9.shtml. It looks
like I will need to use Example 2:
Define g(ntim, nlvl, nlat, mlon) where ntim = 50, nlvl = 30, nlat = 64, mlon
= 128.
The rightmost dimension is to be treated as "cyclic". The user should not
add a cyclic point for the rightmost dimension; it is accounted for
internally. All times and levels will be smoothed and returned in a new
arraygsmth.
Note: gsmth will not have any of the attributes or coordinate information of
the input g. Note: gsmth will not have any of the attributes or coordinate
information of the input g. If this is desired, use the
smth9_Wrap<http://www.ncl.ucar.edu/Document/Functions/Contributed/smth9_Wrap.shtml>function
instead.
gsmth = smth9(g, 0.50, 0.25, True) ; heavy local smoothing
I am not sure what the parameters of g represent (ntim, nlvl, nlat, mlon),
and I'm not sure what a cyclic point is.
This is the code for my map, and I realize that the smoothing code is wrong.
I just don't know what values to use.
; RCP 8.5 Surface Temperature Plot for year 2020
; July Monthly Average
; Cylindrical Equidistant Map
load "$NCARG_ROOT/lib/ncarg/nclscripts/csm/gsn_code.ncl"
load "$NCARG_ROOT/lib/ncarg/nclscripts/csm/gsn_csm.ncl"
begin
fname = addfile ("b40.rcp8_5.1deg.007.cam2.h0.2020-07.nc", "r") ;
read in file from path
st = fname ->TS
wks = gsn_open_wks("ps","RCP8.5_ST_2020_Map")
gsn_define_colormap(wks,"BlAqGrYeOrRe") ; choose colormap
res = True ; plot mods desired
res@mpFillOn = False ; turn off
gray fill
res@mpOutlineBoundarySets = "geophysicalandusstates" ; turn on
countries and US states
res@cnFillOn = True ; turn on
color fill
res@cnLinesOn = False ; turn off
contour lines
res@cnLevelSelectionMode = "ManualLevels" ; set label
bar manually
res@cnMinLevelValF = 290 ;
sets min temp on label bar
res@cnMaxLevelValF = 310 ;
sets max temp on label bar
res@cnLevelSpacingF = 0.5 ; label
bar interval
res@lbLabelStride = 10
res@lbBoxLinesOn = True ;
draw outline around individual colors
res@gsnSpreadColors = True
; use full range of colormap
res@pmTickMarkDisplayMode = "Always"; use NCL default lat/lon labels
res@gsnAddCyclic = False ; data already has cyclic point
; this
must also be set for any zoom
; note that the gsn_csm_*map_ce templates automatically set
; res@mpLimitMode="LatLon" for you. If you are plotting a different
projection,
; you may have to set this resource.
res@mpMinLatF = 20 ; range to zoom in on
res@mpMaxLatF = 40
res@mpMinLonF = 250
res@mpMaxLonF = 270
res@mpCenterLonF = 260
g(ntim, nlvl, nlat, mlon)
gsmth = smth9(g, 0.50, 0.25, True) ; heavy local smoothing
plot = gsn_csm_contour_map_ce(wks,st(0,{15:45},{250:270}), res)
end
-Brandi
?
-------------- next part --------------
An HTML attachment was scrubbed...
URL:
http://mailman.ucar.edu/pipermail/ncl-talk/attachments/20140227/7a2bf5cd/attachment.html
------------------------------
Message: 2
Date: Thu, 27 Feb 2014 17:57:03 -0700
From: Adam Phillips <asphilli@ucar.edu>
Subject: Re: Contour Smoothing
To: "Clark, Brandi L" <brandi.clark@mavs.uta.edu>,
"ncl-talk@ucar.edu" <ncl-talk@ucar.edu>
Message-ID: <530FDEDF.4040601@ucar.edu>
Content-Type: text/plain; charset="iso-8859-1"
Hi Brandi,
A cyclic point is, in this case, an added longitude line at say 360E to
ensure that the data on the longitude line just west of 360E gets
smoothed correctly. When the documentation says that the rightmost
dimension is to be treated as cyclic, it means that when smoothing the
last instance of the rightmost dimension the first instance of said
dimension is used. (ex. If your longitudes are every 2 degrees starting
at 0E and ending at 358E, the function will use data at 356, 358, and 0E
to smooth the data at 358E.)
With regards to what g represents in the example:
You included it in your email:
"Define g(ntim, nlvl, nlat, mlon) where ntim = 50, nlvl = 30, nlat = 64,
mlon = 128."
So g is of size 50(timesteps) x 30(levels) x 64(latitudes) x 128(longitudes)
The key with using smth9 and smth9_Wrap is that the two rightmost
dimensions of your input array must be latitude and longitude.
So, applying smth9 to your coding:
(st is dimensioned time x lat x lon)
st = smth9_Wrap(st, 0.50, 0.25, True) ; heavy local smoothing, use
smth9_Wrap to keep metadata
plot = gsn_csm_contour_map_ce(wks,st(0,{15:45},{250:270}), res)
Hope that helps. If not, or if you have further questions please respond
to ncl-talk only.
Adam
On 2/27/14, 1:46 PM, Clark, Brandi L wrote:
>
> I am trying to smooth the surface temperature contours on a
> cylindrical equidistant map of the CESM RCP 8.5 simulation for July
> 2020. I don't understand the documentation on the NCL webpage for the
> function smth9
> http://www.ncl.ucar.edu/Document/Functions/Built-in/smth9.shtml. It
> looks like I will need to use Example 2:
>
> Define g(ntim, nlvl, nlat, mlon) where ntim = 50, nlvl = 30, nlat =
> 64, mlon = 128.
>
> The rightmost dimension is to be treated as "cyclic". The user should
> /not/ add a cyclic point for the rightmost dimension; it is accounted
> for internally. All times and levels will be smoothed and returned in
> a new array/gsmth/.
>
> Note: /gsmth/ will not have any of the attributes or coordinate
> information of the input /g/. Note: gsmth will not have any of the
> attributes or coordinate information of the input g. If this is
> desired, use the *smth9_Wrap*
> <http://www.ncl.ucar.edu/Document/Functions/Contributed/smth9_Wrap.shtml>function
> instead.
>
> gsmth =*smth9*(g, 0.50, 0.25, True) ; heavy local smoothing
>
>
> I am not sure what the parameters of g represent (ntim, nlvl, nlat, mlon),
> and I'm not sure what a cyclic point is.
>
> This is the code for my map, and I realize that the smoothing code is
> wrong. I just don't know what values to use.
>
> ; RCP 8.5 Surface Temperature Plot for year 2020
> ; July Monthly Average
> ; Cylindrical Equidistant Map
> load "$NCARG_ROOT/lib/ncarg/nclscripts/csm/gsn_code.ncl"
> load "$NCARG_ROOT/lib/ncarg/nclscripts/csm/gsn_csm.ncl"
> begin
> fname = addfile ("b40.rcp8_5.1deg.007.cam2.h0.2020-07.nc", "r"); read
> in file from path
> st = fname ->TS
> wks = gsn_open_wks("ps","RCP8.5_ST_2020_Map")
> gsn_define_colormap(wks,"BlAqGrYeOrRe") ; choose colormap
> res = True ; plot mods desired
> res@mpFillOn = False ; turn off gray fill
> res@mpOutlineBoundarySets = "geophysicalandusstates"; turn on
> countries and US states
> res@cnFillOn = True ; turn on color fill
> res@cnLinesOn = False ; turn off contour lines
> res@cnLevelSelectionMode = "ManualLevels"; set label bar manually
> res@cnMinLevelValF = 290 ; sets min temp on label bar
> res@cnMaxLevelValF = 310; sets max temp on label bar
> res@cnLevelSpacingF = 0.5 ; label bar interval
> res@lbLabelStride = 10
> res@lbBoxLinesOn = True; draw outline around
> individual colors
> res@gsnSpreadColors = True; use full range of colormap
> res@pmTickMarkDisplayMode = "Always"; use NCL default lat/lon labels
> res@gsnAddCyclic = False ; data already has cyclic point
> ; this must also be set for any zoom
> ; note that the gsn_csm_*map_ce templates automatically set
> ; res@mpLimitMode="LatLon" for you. If you are plotting a different
> projection,
> ; you may have to set this resource.
> res@mpMinLatF = 20 ; range to zoom in on
> res@mpMaxLatF = 40
> res@mpMinLonF = 250
> res@mpMaxLonF = 270
> res@mpCenterLonF = 260
> g(ntim, nlvl, nlat, mlon)
> gsmth = smth9(g, 0.50, 0.25, True) ; heavy local smoothing
> plot = gsn_csm_contour_map_ce(wks,st(0,{15:45},{250:270}), res)
> end
> -Brandi
>
>
>
>
> _______________________________________________
> ncl-talk mailing list
> List instructions, subscriber options, unsubscribe:
> http://mailman.ucar.edu/mailman/listinfo/ncl-talk
-------------- next part --------------
An HTML attachment was scrubbed...
URL:
http://mailman.ucar.edu/pipermail/ncl-talk/attachments/20140227/30894999/attachment.html
------------------------------
Message: 3
Date: Fri, 28 Feb 2014 10:42:30 +0800
From: "zhangbinrc" <zhangbinrc@163.com>
Subject: compute Pearson correlation coefficient in NCL
To: <ncl-talk@ucar.edu>
Message-ID: <A67FE9FCE84948E885CCDC30F7733AFB@PC201307061429>
Content-Type: text/plain; charset="gb2312"
Hi all,
How can I compute Pearson correlation coefficient of two arrays? And missing
data should be allowed.
Thanks!
?? ???/Bin Zhang Ph.D. Candidate
??????????????/ Center for Earth System Science, Tsinghua
Email:zhangbin06@mails.tsinghua.edu.cn
-------------- next part --------------
An HTML attachment was scrubbed...
URL:
http://mailman.ucar.edu/pipermail/ncl-talk/attachments/20140228/a28b2a24/attachment.html
------------------------------
Message: 4
Date: Fri, 28 Feb 2014 03:34:51 +0000
From: Will Hobbs <Will.Hobbs@utas.edu.au>
Subject: Unusual ind()/ind_resolve() behaviour
To: "ncl-talk@ucar.edu" <ncl-talk@ucar.edu>
Message-ID: <CF364F0A.57C5%will.hobbs@utas.edu.au>
Content-Type: text/plain; charset="us-ascii"
I've noticed some strange results using the ind() and ind_resolve()
functions, that I can't explain. I'm using the functions to find all indices
on the POP ocean grid within a certain domain, viz:
> f = addfile(filename,"r") ;file could be any CCSM4 or CESM ocean data
;read lat/lon coords
>lat = f->lat
>lon = f->lon
;convert to 1d arrays
>lat1d = ndtooned(lat)
>lon1d = ndtooned(lon)
;find all coords in a band across the mid-lat N. Atlantic
>ii =
>ind(lon1d.ge.270..and.lon1d.le.360..and.lat1d.gt.39.5.and.lat1d.lt.40.5)
>jj = ind_resolve(ii, dimsizes(lat)) ; find array elements on the 2-d grid
>printMinMax(lon(jj(:,0),jj(:,1)), True) ;returns range of 270.296 to
>359.746 ; so far so good
>printMinMax(lat(jj(:,0),jj(:,1)), True)
;returns range of 38.0728 to 41.8587, which is outside the initial query of
39.5 to 40.5
Any thoughts?
Will
-------------- next part --------------
An HTML attachment was scrubbed...
URL:
http://mailman.ucar.edu/pipermail/ncl-talk/attachments/20140228/f6e02e15/attachment.html
------------------------------
Message: 5
Date: Thu, 27 Feb 2014 21:31:11 -0700
From: Dennis Shea <shea@ucar.edu>
Subject: Re: compute Pearson correlation coefficient in NCL
To: zhangbinrc <zhangbinrc@163.com>, ncl-talk@ucar.edu
Message-ID: <5310110F.2090607@ucar.edu>
Content-Type: text/plain; charset=UTF-8; format=flowed
Please look at NCL function documentation.
Click 'Functions'
Search for 'cross-correlation'
http://www.ncl.ucar.edu/Document/Functions/Built-in/escorc.shtml
===
If you are new to NCL, please read the Mini-Language Manual
http://www.ncl.ucar.edu/Document/Manuals/
Also, see the tutorial "Getting Started with NCL"
http://www.ncl.ucar.edu/Document/Manuals/Getting_Started/
On 2/27/14, 7:42 PM, zhangbinrc wrote:
>
> Hi all,
>
> How can I compute Pearson correlation coefficient of two arrays? And
> missing data should be allowed.
>
> Thanks!
>
> ?? ???/Bin Zhang Ph.D. Candidate
> ??????????????/ Center for Earth System Science, Tsinghua
> Email:zhangbin06@mails.tsinghua.edu.cn
>
>
>
> _______________________________________________
> ncl-talk mailing list
> List instructions, subscriber options, unsubscribe:
> http://mailman.ucar.edu/mailman/listinfo/ncl-talk
>
------------------------------
Message: 6
Date: Thu, 27 Feb 2014 22:05:02 -0700
From: Dennis Shea <shea@ucar.edu>
Subject: Re: Unusual ind()/ind_resolve() behaviour
To: Will Hobbs <Will.Hobbs@utas.edu.au>, "ncl-talk@ucar.edu"
<ncl-talk@ucar.edu>
Message-ID: <531018FE.7070702@ucar.edu>
Content-Type: text/plain; charset=ISO-8859-1; format=flowed
Hi Will
Yes. It looks like a bug with ind_resolve.
The 'TEMP.nc' file is a POP grid
load "$NCARG_ROOT/lib/ncarg/nclscripts/csm/contributed.ncl"
f = addfile("TEMP.nc", "r")
x = f->TEMP
lat = f->TLAT
lon = f->TLONG
print("lat: min="+min(lat)+" max="+max(lat))
print("lon: min="+min(lon)+" max="+max(lon))
lat1d = ndtooned(lat)
lon1d = ndtooned(lon)
;find all coords in a band across the mid-lat N. Atlantic
ii = ind(lon1d.ge.270..and.lon1d.le.360. .and. \
lat1d.gt.39.5.and.lat1d.lt.40.5)
jj = ind_resolve(ii, dimsizes(lat))
print(ii+" "+lat1d(ii)+" "+lon1d(ii)) ; the ii are 'good'
printMinMax(lon(jj(:,0),jj(:,1)), True) ;returns range of 270.296
to 359.746 ; so far so good
printMinMax(lat(jj(:,0),jj(:,1)), True) ; not so good
=======================
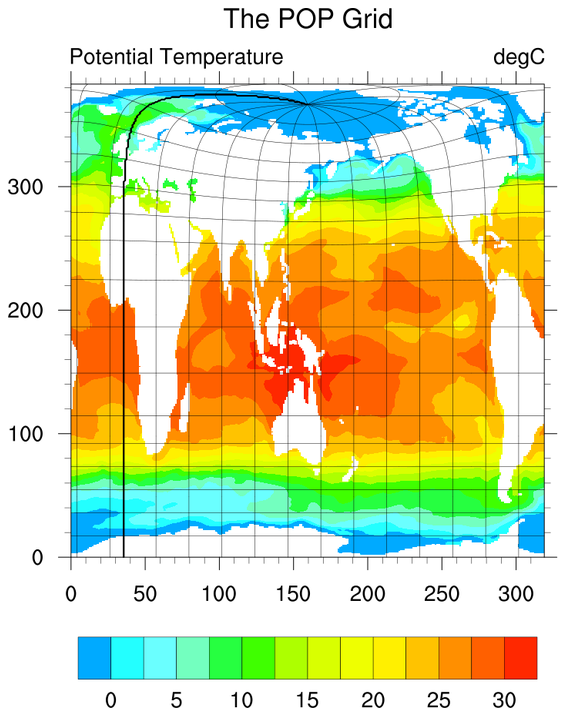
I'm not sure of the workings of ind_resolve.
I wonder if the fact that the POP grid 'curves back on itself'
is an issue?
https://www.ncl.ucar.edu/Applications/Images/popgrid_1_lg.png
On 2/27/14, 8:34 PM, Will Hobbs wrote:
> I've noticed some strange results using the ind() and ind_resolve()
> functions, that I can't explain. I'm using the functions to find all
> indices on the POP ocean grid within a certain domain, viz:
>
>> f = addfile(filename,"r") ;file could be any CCSM4 or CESM ocean data
>
> ;read lat/lon coords
>> lat = f->lat
>> lon = f->lon
>
> ;convert to 1d arrays
>> lat1d = ndtooned(lat)
>> lon1d = ndtooned(lon)
>
> ;find all coords in a band across the mid-lat N. Atlantic
>> ii =
>> ind(lon1d.ge.270..and.lon1d.le.360..and.lat1d.gt.39.5.and.lat1d.lt.40.5)
>
>> jj = ind_resolve(ii, dimsizes(lat)) ; find array elements on the 2-d grid
>
>> printMinMax(lon(jj(:,0),jj(:,1)), True) ;returns range of 270.296 to
>> 359.746 ; so far so good
>
>> printMinMax(lat(jj(:,0),jj(:,1)), True)
> ;returns range of 38.0728 to 41.8587, which is outside the initial query
> of 39.5 to 40.5
>
> Any thoughts?
>
> Will
>
>
>
> _______________________________________________
> ncl-talk mailing list
> List instructions, subscriber options, unsubscribe:
> http://mailman.ucar.edu/mailman/listinfo/ncl-talk
>
------------------------------
Message: 7
Date: Fri, 28 Feb 2014 05:15:59 +0000
From: Will Hobbs <Will.Hobbs@utas.edu.au>
Subject: Re: Unusual ind()/ind_resolve() behaviour
To: Dennis Shea <shea@ucar.edu>, "ncl-talk@ucar.edu"
<ncl-talk@ucar.edu>
Message-ID: <CF3664DF.57CB%will.hobbs@utas.edu.au>
Content-Type: text/plain; CHARSET=US-ASCII
I think can see where the problem is; as usual it's with me!
If I make a 1-d array of the transect coords from the resolved indices,
from the example we've used:
>npts = dimsizes(jj(:,0))
>transx = new(npts,typeof(lat))
>transy = transx
>do i = 0, npts-1
> transx(i) = lon(jj(i,0),jj(i,1))
> transy(i) = lat(jj(i,0),jj(i,1))
end do
>printMinMax(transy, True) ;min=39.5062 max=40.4737, success!
As you said, the POP grid 'curves' and because the index
lat(jj(:,0),(:,1))) is a rectangular array of indices rather than an
approximately west-east line of coords, it's picking up grid points
outside my original spec.
Sorry to have wasted your time.
Will
On 28/02/14 4:05 PM, "Dennis Shea" <shea@ucar.edu> wrote:
>Hi Will
>
>Yes. It looks like a bug with ind_resolve.
>The 'TEMP.nc' file is a POP grid
>
>load "$NCARG_ROOT/lib/ncarg/nclscripts/csm/contributed.ncl"
>
> f = addfile("TEMP.nc", "r")
> x = f->TEMP
>
> lat = f->TLAT
> lon = f->TLONG
>
> print("lat: min="+min(lat)+" max="+max(lat))
> print("lon: min="+min(lon)+" max="+max(lon))
>
> lat1d = ndtooned(lat)
> lon1d = ndtooned(lon)
>
>;find all coords in a band across the mid-lat N. Atlantic
>
> ii = ind(lon1d.ge.270..and.lon1d.le.360. .and. \
> lat1d.gt.39.5.and.lat1d.lt.40.5)
> jj = ind_resolve(ii, dimsizes(lat))
>
> print(ii+" "+lat1d(ii)+" "+lon1d(ii)) ; the ii are 'good'
>
> printMinMax(lon(jj(:,0),jj(:,1)), True) ;returns range of 270.296
>to 359.746 ; so far so good
> printMinMax(lat(jj(:,0),jj(:,1)), True) ; not so good
>
>=======================
>I'm not sure of the workings of ind_resolve.
>
>I wonder if the fact that the POP grid 'curves back on itself'
>is an issue?
>
> https://www.ncl.ucar.edu/Applications/Images/popgrid_1_lg.png
>
>
>
>
>On 2/27/14, 8:34 PM, Will Hobbs wrote:
>> I've noticed some strange results using the ind() and ind_resolve()
>>functions, that I can't explain. I'm using the functions to find all
>>indices on the POP ocean grid within a certain domain, viz:
>>
>>> f = addfile(filename,"r") ;file could be any CCSM4 or CESM ocean data
>>
>> ;read lat/lon coords
>>> lat = f->lat
>>> lon = f->lon
>>
>> ;convert to 1d arrays
>>> lat1d = ndtooned(lat)
>>> lon1d = ndtooned(lon)
>>
>> ;find all coords in a band across the mid-lat N. Atlantic
>>> ii =
>>>ind(lon1d.ge.270..and.lon1d.le.360..and.lat1d.gt.39.5.and.lat1d.lt.40.5)
>>
>>> jj = ind_resolve(ii, dimsizes(lat)) ; find array elements on the 2-d
>>>grid
>>
>>> printMinMax(lon(jj(:,0),jj(:,1)), True) ;returns range of 270.296 to
>>>359.746 ; so far so good
>>
>>> printMinMax(lat(jj(:,0),jj(:,1)), True)
>> ;returns range of 38.0728 to 41.8587, which is outside the initial
>>query of 39.5 to 40.5
>>
>> Any thoughts?
>>
>> Will
>>
>>
>>
>> _______________________________________________
>> ncl-talk mailing list
>> List instructions, subscriber options, unsubscribe:
>> http://mailman.ucar.edu/mailman/listinfo/ncl-talk
>>
>_______________________________________________
>ncl-talk mailing list
>List instructions, subscriber options, unsubscribe:
>http://mailman.ucar.edu/mailman/listinfo/ncl-talk
------------------------------
Message: 8
Date: Fri, 28 Feb 2014 17:31:53 +0900
From: Thomas Tobian <thomastobian@gmail.com>
Subject: BUS ERROR
To: "ncl-talk@ucar.edu" <ncl-talk@ucar.edu>
Message-ID:
<CAL2SQfDTqy6m-Y4_GscKDNqSxGcvvANBJjBFTZpwq1hp7nfT1w@mail.gmail.com>
Content-Type: text/plain; charset="iso-8859-1"
Hallo NCL,
I got bus error after 4 days running multiple NCL scripts (around 25
scripts) at the same time for doing a specific thing. I have no reason why
I got this error. We are here using super computer from Hamburg. Is it
related to the processor which cannot even attempt the memory access
requested ? or is it internal bug in NCL?
Thanks for your concern.
regards,
Dr. Tobian
-------------- next part --------------
An HTML attachment was scrubbed...
URL:
http://mailman.ucar.edu/pipermail/ncl-talk/attachments/20140228/f8abf55a/attachment.html
------------------------------
Message: 9
Date: Fri, 28 Feb 2014 10:27:46 +0100
From: Karin Meier-Fleischer <meier-fleischer@dkrz.de>
Subject: Re: BUS ERROR
To: ncl-talk@ucar.edu
Message-ID: <53105692.6000607@dkrz.de>
Content-Type: text/plain; charset="iso-8859-1"
Hi Dr. Tobian,
could you be more specific about your jobs and scripts, please.
Bye,
Karin from DKRZ Hamburg
Am 28.02.14 09:31, schrieb Thomas Tobian:
> Hallo NCL,
>
> I got bus error after 4 days running multiple NCL scripts (around 25
> scripts) at the same time for doing a specific thing. I have no reason
> why I got this error. We are here using super computer from Hamburg.
> Is it related to the processor which cannot even attempt the memory
> access requested ? or is it internal bug in NCL?
>
> Thanks for your concern.
>
> regards,
> Dr. Tobian
>
>
> _______________________________________________
> ncl-talk mailing list
> List instructions, subscriber options, unsubscribe:
> http://mailman.ucar.edu/mailman/listinfo/ncl-talk
--
Dipl. Geophys. Karin Meier-Fleischer
Application Support, Visualization
Deutsches Klimarechenzentrum GmbH      E-Mail:   meier-fleischer@dkrz.de
Bundesstrasse 45a                      Internet: http://www.dkrz.de/
20146 Hamburg                          Phone:    +49 (0)40 460094 126
Germany                                Fax:      +49 (0)40 460094 270
Gesch?ftsf?hrer: Prof. Dr. Thomas Ludwig
Sitz der Gesellschaft: Hamburg
Amtsgericht Hamburg HRB 39784
-------------- next part --------------
An HTML attachment was scrubbed...
URL:
http://mailman.ucar.edu/pipermail/ncl-talk/attachments/20140228/f6e135ba/attachment.html
------------------------------
Message: 10
Date: Fri, 28 Feb 2014 16:41:24 +0000
From: Ciara O'Hara <cohara1985@hotmail.com>
Subject: looping to create a graph from many different
files
To: "ncl-talk@ucar.edu" <ncl-talk@ucar.edu>
Message-ID: <DUB111-W103A3C97E8B61C403DED054DC820@phx.gbl>
Content-Type: text/plain; charset="iso-8859-1"
        I have 50 files that I want to run a script on one after the
other, and to save the generated graph with a unique name each time. My
script to create the graph is fine, but looping through the 50 files is
not. I have left out many of the resources I'm using.
Thanks in advance,
Ciara
My script is:
    load "$NCARG_ROOT/lib/ncarg/nclscripts/csm/gsn_code.ncl"
    load "$NCARG_ROOT/lib/ncarg/nclscripts/csm/gsn_csm.ncl"
    load "$NCARG_ROOT/lib/ncarg/nclscripts/csm/contributed.ncl"
    load "$NCARG_ROOT/lib/ncarg/nclscripts/csm/shea_util.ncl"
    do n=1961,2010
        begin
        fnam="/home/cohara/TempData/yearly_data/average/average_" +
sprinti("0.4n",n) + ".nc"
        x=addfile(fnam,"r")
        data=x->var61(0,0,:,:)
        xwks=gsn_open_wks("ps","Average_" + sprinti("0.4n",n)
        resources=True
        resources@tiMainString="Average Annual Temperature" +
sprinti("0.4n",n)
            plot=gsn_csm_contour_map(xwks,data,resources)
        end
    end do
-------------- next part --------------
An HTML attachment was scrubbed...
URL:
http://mailman.ucar.edu/pipermail/ncl-talk/attachments/20140228/4b139854/attachment.html
------------------------------
Message: 11
Date: Fri, 28 Feb 2014 09:57:24 -0700
From: Craig Tierney - NOAA Affiliate <craig.tierney@noaa.gov>
Subject: Re: Why doesn't my text show up in my plot?
To: Mary Haley <haley@ucar.edu>
Cc: ncl-talk@ucar.edu
Message-ID:
<CALQst9gxZvaN59EBTHrTT9St4bX2qM1_WK_DD8pM2p0FmTpwAA@mail.gmail.com>
Content-Type: text/plain; charset="iso-8859-1"
Mary,
In developing an example I found the problem, but it lead to another issue.
I had not set res@gsnFrame and res@gsnDraw to false like I had done in
other similar commands, so I was unable to plot any additional objects
after the call to gsn_csm_contour_map.  So that is pretty obvious why it
isn't working.
However, this lead to another issue I had never asked about. I would rather
be generating png files directly, and not creating ps files and converting
them after the fact.  This code was able to write directly to png files
with:
wks=gsn_open_wks("png",ofn);
However, when I changed gsnFrame and gsnDraw to false, I could no longer
create png files.  I can create ps files by just changing the command above
to use "ps".
Should I be able to create png files directly with gsnFrame and gsnDraw set
to false?
If you need to see my example, please send me instructions on where to
upload it.
Thanks,
Craig
On Wed, Feb 26, 2014 at 3:06 PM, Mary Haley <haley@ucar.edu> wrote:
>
> On Feb 26, 2014, at 1:54 PM, Craig Tierney - NOAA Affiliate <
> craig.tierney@noaa.gov> wrote:
>
> > Mary,
> >
> > I will try and come up with an example.  The gsn_add_text isn't working
> either.  Now, I could be using it wrong (most likely).
> >
> > My question is, should gsn_add_text be able to plot text outside of the
> boundary of the plot map?
>
> No, you can only use gsn_add_text for text inside the plot's boundaries,
> although you can do a kludgy thing of moving the text by adding extra
> spaces or carriage returns to the text string.
>
> --Mary
>
> >
> > Thanks,
> > Craig
> >
> >
> > On Wed, Feb 26, 2014 at 1:26 PM, Craig Tierney - NOAA Affiliate <
> craig.tierney@noaa.gov> wrote:
> > On Wed, Feb 26, 2014 at 12:45 PM, Mary Haley <haley@ucar.edu> wrote:
> > Craig,
> >
> > Can you trim this down to a short but complete script that illustrates
> the problem? I can't tell from looking at the code snippet what might be
> going on.
> >
> >
> > I will see what I can do.  The plotting script is really 1000+ lines of
> NCL that allow me plot any dataset, from any resolution, of any
> meteorological field, and just do the right thing.  This script is
> plotting
> a data on a icosahederal grid.
> >
> > There could be a maximization issue, or maybe one plot element is
> covering up another, etc.
> >
> > Note: generally I recommend against using gsn_text_ndc (or any of the
> gsn_xxx_ndc procedures) if you can use gsn_add_xxx instead.
> >
> >
> > I was not a fan of working in NDC space, but it did help me simplify my
> code because when the scripts change domain (eg. global to conus), then I
> would have to rescale the coordinates.  In NDC space and an assumption of
> where the plot ends up, I can safely tuck away the text in the corner of
> the plot.
> >
> > The difference, of course, is that with gsn_xxx_ndc you need to use NDC
> coordinates (coordinates from 0 to 1), whereas with the gsn_add_xxx
> functions  you need to use the plot's coordinate space. Also, with
> gsn_xxx_ndc, the primitive gets drawn right in that moment and it is *not*
> attached to anything. The gsn_add_xxx function will attach the primitive
> to
> the plot, but not draw it. So, you have to draw the plot in order to see
> the primitive. But, the benefit is if you resize the plot, then the
> primitive will be resized automatically.
> >
> >
> > I will try the gsn_add_text and see if that resolves the order issue.
> >
> > Craig
> > --Mary
> >
> > On Feb 26, 2014, at 11:59 AM, Craig Tierney - NOAA Affiliate <
> craig.tierney@noaa.gov> wrote:
> >
> > > I am using ncl 6.1.2.  When I try to call gsn_text_ndc before the call
> to gsn_csm_contour_map, the text displays.
> > >
> > > ----------------------------
> > > ; Create a control string for the plot
> > > cstr="Min/Max control: "+min(d1)+"/"+max(d1)+" "+"Min/Max Diff:
> "+min(data)+"/"+max(data)
> > >  print(cstr)
> > >
> > > ; Attach all necessary labels
> > > txresb   = True
> > > txresb@txFontHeightF = 0.010
> > > gsn_text_ndc(wks,cstr, 0.5, 0.1, txresb)
> > >
> > >  ; plot the map
> > > map = gsn_csm_contour_map(wks,data,res)
> > >
> > > draw(map)
> > > -----------------------------
> > >
> > > When I reverse it, the text does not display.
> > >
> > > ----------------------------
> > > ; Create a control string for the plot
> > > cstr="Min/Max control: "+min(d1)+"/"+max(d1)+" "+"Min/Max Diff:
> "+min(data)+"/"+max(data)
> > >  print(cstr)
> > >
> > >  ; plot the map
> > > map = gsn_csm_contour_map(wks,data,res)
> > >
> > > ; Attach all necessary labels
> > > txresb   = True
> > > txresb@txFontHeightF = 0.010
> > > gsn_text_ndc(wks,cstr, 0.5, 0.1, txresb)
> > >
> > > draw(map)
> > > -----------------------------
> > >
> > > Why is this and is there a way to enable additional debugging so that
> I could see what NCL is doing when I run into future problems like this?
> > >
> > > Thanks,
> > > Craig
> > > _______________________________________________
> > > ncl-talk mailing list
> > > List instructions, subscriber options, unsubscribe:
> > > http://mailman.ucar.edu/mailman/listinfo/ncl-talk
> >
> >
> >
>
>
-------------- next part --------------
An HTML attachment was scrubbed...
URL:
http://mailman.ucar.edu/pipermail/ncl-talk/attachments/20140228/f648816e/attachment.html
------------------------------
Message: 12
Date: Fri, 28 Feb 2014 10:37:10 -0700
From: Mary Haley <haley@ucar.edu>
Subject: Re: Adding polygons to a Skew-T plot
To: Katharina Roloff <roloff@muk.uni-hannover.de>
Cc: ncl-talk@ucar.edu
Message-ID: <BAF3A791-1B49-44DC-9ADF-FCD61F5A8437@ucar.edu>
Content-Type: text/plain; charset="iso-8859-1"
Hi,
gsn_add_polygon is the correct route to go, and not gsn_add_annotation.
It looks like you are very close, but the X/Y values you're using for the
polygon are not in the same coordinate space as the Skew-T plot.
You need to use the unadvertised "skewtx" and "skewty" functions to convert
from your coordinates to the Skew-T coordinates:
      ybox =
skewty((/p_data(0,frz_base),p_data(0,frz_top),p_data(0,frz_top),p_data(0,frz_base),p_data(0,frz_base)/))
      xbox = skewtx((/30.,30.,37.,37.,30./),ybox)
      box_frz = gsn_add_polygon (wks,plot,xbox,ybox,boxres)
Dennis is more familiar with this code, so I'm hoping he'll confirm whether
this is correct.
You can see the skewtx and skewty functions for yourself in:
$NCARG_ROOT/lib/ncarg/nclscripts/csm/skewt_func.ncl
Search for "function skewty" and "function skewtx":
undef("skewty")
function skewty(pres[*]:numeric)            ; y-coord given pressure (mb)
  begin
   return (132.182-44.061*log10(pres))
  end
undef("skewtx")
function skewtx(temp[*]:numeric,y[*]:numeric) ; x-coord given temperature
(c)
  begin                                     ; y=skewty(p)
   return (0.54*temp+0.90692*y)
  end
--Mary
On Feb 27, 2014, at 10:42 AM, Katharina Roloff <roloff@muk.uni-hannover.de>
wrote:
> Hi all,
>
> after trying to panel some Skew-T plots last week I've now tried to add a
> polygon to a single Skew-T plot similar to an example of the NCL talk
> archive
>
> http://www.ncl.ucar.edu/Support/talk_archives/2013/1742.html
>
> but unfortunately it doesn't work at all. Using the gsn_add_annotation
> function I get the error messages
>
> fatal:NhlAddAnnotation: invalid view id
> fatal:["NclVar.c":1382]:Assignment type mismatch, right hand side can't be
> coerced to type of left hand side
> fatal:["Execute.c":8128]:Execute: Error occurred at or near line 186 in
> file Skew_T_Scenarios.ncl
>
> When I just try to add the polygon I can't see it after plotting. Maybe
> you have any idea what's going wrong? I don't know if the polygon is
> hidden by the Skew-T background even though I tried different options to
> make sure that the polygon is plotted last...
>
> In the attachment you see the shortened code and the ps output which just
> shows the Skew-T plot without any polygon.
>
> If you need the input files, I've sent them via ftp in your /incoming
> directory:
>
> cosmo_tools.ncl
> grid_calculation.ncl
> grb1_192_pip_LME_sce_k_2013110600_04_ueg
> grb12-lm2mo_scal_2013110600_04.ueg
> mySkewT.ncl
>
> I am working with NCL 6.1.2. When I type "uname -a" I get
>
>> Linux 3.1.10-1.16-desktop #1 SMP PREEMPT Wed Jun 27 05:21:40 UTC 2012
>> (d016078) x86_64 x86_64 x86_64 GNU/Linux
>
> I would appreciate any assistance again. Thank you, Katharina.
>
>
> --------------------------------------------
>
> M.Sc. Katharina Roloff
> Wissenschaftliche Mitarbeiterin
> Institut fuer Meteorologie und Klimatologie
> Leibniz Universitaet Hannover
> Herrenhaeuser Str. 2
> 30419 Hannover
>
> Email: roloff@muk.uni-hannover.de
>
> --------------------------------------------
> <Skew_T_Scenarios.ncl><Skew_T_frz_20131106_0400.ps>_______________________________________________
> ncl-talk mailing list
> List instructions, subscriber options, unsubscribe:
> http://mailman.ucar.edu/mailman/listinfo/ncl-talk
-------------- next part --------------
An HTML attachment was scrubbed...
URL:
http://mailman.ucar.edu/pipermail/ncl-talk/attachments/20140228/fa9476c2/attachment.html
------------------------------
Message: 13
Date: Fri, 28 Feb 2014 10:48:00 -0700
From: Mary Haley <haley@ucar.edu>
Subject: Re: Why doesn't my text show up in my plot?
To: Craig Tierney - NOAA Affiliate <craig.tierney@noaa.gov>
Cc: ncl-talk@ucar.edu
Message-ID: <5FE8A4B8-0C80-4FB6-80E7-75C593E8A4EE@ucar.edu>
Content-Type: text/plain; charset="windows-1252"
Craig,
If you set gsnFrame and gsnDraw to False, then the plot object will be
created, but nothing will get drawn. It shouldn't matter if your output is
going to PS, PNG, X11, PDF, or NCGM.
Whenever you set these two resources to False, then in order to have the
plot drawn correct, you need to call:
  draw(plot)
  frame(wks)
where "plot" is whatever you used for the variable on the left side of the
"=":
   plot = gsn_csm_contour_map(?)
I think what's happening in your case is that if you set these two resources
to False, and don't call "draw" and "frame", then for the "ps" case, you
will still get a "xxxx.ps" file, but it will be blank. For the "png" case,
you will get no file at all.
Look at your PS file to see if it actually has any graphics in it.  I won't
be surprised if it doesn't.
Are you actually calling "draw" and "frame" somewhere in your code?
See the attached script for an example. Try commenting out the "draw" and
"frame" calls and see what happens.
--Mary
-------------- next part --------------
A non-text attachment was scrubbed...
Name: map.ncl
Type: application/octet-stream
Size: 344 bytes
Desc: not available
Url :
http://mailman.ucar.edu/pipermail/ncl-talk/attachments/20140228/e3e1cd16/attachment.obj
-------------- next part --------------
On Feb 28, 2014, at 9:57 AM, Craig Tierney - NOAA Affiliate
<craig.tierney@noaa.gov> wrote:
> Mary,
>
> In developing an example I found the problem, but it lead to another
> issue.  I had not set res@gsnFrame and res@gsnDraw to false like I had
> done in other similar commands, so I was unable to plot any additional
> objects after the call to gsn_csm_contour_map.  So that is pretty obvious
> why it isn't working.
>
> However, this lead to another issue I had never asked about. I would
> rather be generating png files directly, and not creating ps files and
> converting them after the fact.  This code was able to write directly to
> png files with:
>
> wks=gsn_open_wks("png",ofn);
>
> However, when I changed gsnFrame and gsnDraw to false, I could no longer
> create png files.  I can create ps files by just changing the command
> above to use "ps".
>
> Should I be able to create png files directly with gsnFrame and gsnDraw
> set to false?
>
> If you need to see my example, please send me instructions on where to
> upload it.
>
> Thanks,
> Craig
>
>
>
> On Wed, Feb 26, 2014 at 3:06 PM, Mary Haley <haley@ucar.edu> wrote:
>
> On Feb 26, 2014, at 1:54 PM, Craig Tierney - NOAA Affiliate
> <craig.tierney@noaa.gov> wrote:
>
> > Mary,
> >
> > I will try and come up with an example.  The gsn_add_text isn't working
> > either.  Now, I could be using it wrong (most likely).
> >
> > My question is, should gsn_add_text be able to plot text outside of the
> > boundary of the plot map?
>
> No, you can only use gsn_add_text for text inside the plot's boundaries,
> although you can do a kludgy thing of moving the text by adding extra
> spaces or carriage returns to the text string.
>
> --Mary
>
> >
> > Thanks,
> > Craig
> >
> >
> > On Wed, Feb 26, 2014 at 1:26 PM, Craig Tierney - NOAA Affiliate
> > <craig.tierney@noaa.gov> wrote:
> > On Wed, Feb 26, 2014 at 12:45 PM, Mary Haley <haley@ucar.edu> wrote:
> > Craig,
> >
> > Can you trim this down to a short but complete script that illustrates
> > the problem? I can't tell from looking at the code snippet what might be
> > going on.
> >
> >
> > I will see what I can do.  The plotting script is really 1000+ lines of
> > NCL that allow me plot any dataset, from any resolution, of any
> > meteorological field, and just do the right thing.  This script is
> > plotting a data on a icosahederal grid.
> >
> > There could be a maximization issue, or maybe one plot element is
> > covering up another, etc.
> >
> > Note: generally I recommend against using gsn_text_ndc (or any of the
> > gsn_xxx_ndc procedures) if you can use gsn_add_xxx instead.
> >
> >
> > I was not a fan of working in NDC space, but it did help me simplify my
> > code because when the scripts change domain (eg. global to conus), then
> > I would have to rescale the coordinates.  In NDC space and an assumption
> > of where the plot ends up, I can safely tuck away the text in the corner
> > of the plot.
> >
> > The difference, of course, is that with gsn_xxx_ndc you need to use NDC
> > coordinates (coordinates from 0 to 1), whereas with the gsn_add_xxx
> > functions  you need to use the plot's coordinate space. Also, with
> > gsn_xxx_ndc, the primitive gets drawn right in that moment and it is
> > *not* attached to anything. The gsn_add_xxx function will attach the
> > primitive to the plot, but not draw it. So, you have to draw the plot in
> > order to see the primitive. But, the benefit is if you resize the plot,
> > then the primitive will be resized automatically.
> >
> >
> > I will try the gsn_add_text and see if that resolves the order issue.
> >
> > Craig
> > --Mary
> >
> > On Feb 26, 2014, at 11:59 AM, Craig Tierney - NOAA Affiliate
> > <craig.tierney@noaa.gov> wrote:
> >
> > > I am using ncl 6.1.2.  When I try to call gsn_text_ndc before the call
> > > to gsn_csm_contour_map, the text displays.
> > >
> > > ----------------------------
> > > ; Create a control string for the plot
> > > cstr="Min/Max control: "+min(d1)+"/"+max(d1)+" "+"Min/Max Diff:
> > > "+min(data)+"/"+max(data)
> > >  print(cstr)
> > >
> > > ; Attach all necessary labels
> > > txresb   = True
> > > txresb@txFontHeightF = 0.010
> > > gsn_text_ndc(wks,cstr, 0.5, 0.1, txresb)
> > >
> > >  ; plot the map
> > > map = gsn_csm_contour_map(wks,data,res)
> > >
> > > draw(map)
> > > -----------------------------
> > >
> > > When I reverse it, the text does not display.
> > >
> > > ----------------------------
> > > ; Create a control string for the plot
> > > cstr="Min/Max control: "+min(d1)+"/"+max(d1)+" "+"Min/Max Diff:
> > > "+min(data)+"/"+max(data)
> > >  print(cstr)
> > >
> > >  ; plot the map
> > > map = gsn_csm_contour_map(wks,data,res)
> > >
> > > ; Attach all necessary labels
> > > txresb   = True
> > > txresb@txFontHeightF = 0.010
> > > gsn_text_ndc(wks,cstr, 0.5, 0.1, txresb)
> > >
> > > draw(map)
> > > -----------------------------
> > >
> > > Why is this and is there a way to enable additional debugging so that
> > > I could see what NCL is doing when I run into future problems like
> > > this?
> > >
> > > Thanks,
> > > Craig
> > > _______________________________________________
> > > ncl-talk mailing list
> > > List instructions, subscriber options, unsubscribe:
> > > http://mailman.ucar.edu/mailman/listinfo/ncl-talk
> >
> >
> >
>
>
------------------------------
_______________________________________________
ncl-talk mailing list
ncl-talk@ucar.edu
http://mailman.ucar.edu/mailman/listinfo/ncl-talk
End of ncl-talk Digest, Vol 123, Issue 33
*****************************************
_______________________________________________
ncl-talk mailing list
List instructions, subscriber options, unsubscribe:
http://mailman.ucar.edu/mailman/listinfo/ncl-talk
Received on Fri Feb 28 12:18:46 2014
This archive was generated by hypermail 2.1.8 : Mon Mar 03 2014 - 14:26:18 MST