Date: Thu Feb 27 2014 - 10:18:22 MST
Ciara,
My guess is that your map projection is not quite right. You are using Mercator, but not zooming in on the area of interest. Maybe try adding these resources:
res@mpLimitMode = "Corners"
res@mpLeftCornerLatF = 51
res@mpLeftCornerLonF = -11
res@mpRightCornerLatF = 56
res@mpRightCornerLonF = -5
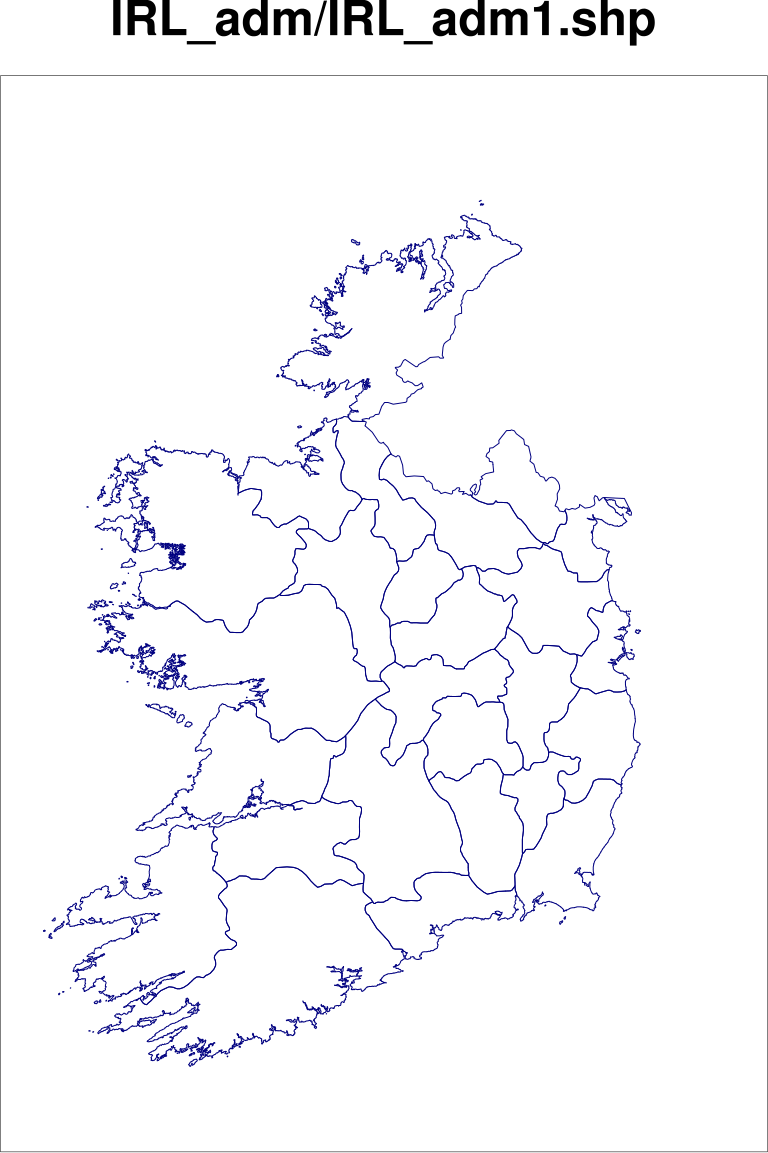
I've attached a script that plots the shapefile outlines for Ireland, using the "IRL_adm1.shp" file downloaded from gadm.org.
--Mary
On Feb 27, 2014, at 9:51 AM, Ciara O'Hara <cohara1985@hotmail.com> wrote:
> I tried the suggestion below, using "poly = gsn_add_shapefile_polylines(xwks,plot,"/root/IRL_adm/IRL_adm1.shp",plres)", but now my map has no boundary at all, or counties. I have set the resources below, which is obviously why my map has no outlines, but why is the shapefile not working, does anyone know?
> res@mpOutlineOn = False ; Use outlines from shapefile
> res@mpFillOn = False
>
>
> Ciara
>
> > Subject: Re: Detailed map of Ireland
> > From: haley@ucar.edu
> > Date: Thu, 27 Feb 2014 09:31:43 -0700
> > CC: brownrig@ucar.edu; ncl-talk@ucar.edu
> > To: cohara1985@hotmail.com
> >
> > Ciara,
> >
> > I recommend using "gsn_add_shapefile_polylines" instead of all the code you have below.
> >
> > See shapefiles_8_new.ncl at:
> >
> > http://www.ncl.ucar.edu/Applications/Scripts/shapefiles_8_new.ncl
> >
> > You will be able to replace the code below with:
> >
> > xwks=gsn_open_wks("ps","Average_2010")
> > resources=True
> > resources@mpProjection="Mercator"
> > xwks=gsn_open_wks("ps","Average_2010")
> > gsn_define_colormap(xwks,colors)
> > plot=gsn_csm_contour_map(xwks,data,resources)
> >
> > plres=True
> > plres@gsEdgesOn=True
> > plres@gsLineColor="black"
> > plres@gsEdgeColor="black"
> > poly = gsn_add_shapefile_polylines(xwks,plot,"/root/IRL_adm/IRL_adm1.shp",plres)
> > draw(plot)
> > frame(wks)
> >
> > --Mary
> >
> >
> > On Feb 27, 2014, at 8:34 AM, Ciara O'Hara <cohara1985@hotmail.com> wrote:
> >
> > > Hi Rick,
> > >
> > > Thank you very much. I'm getting an error though, and maybe you can help. This is my script. I haven't included all the resources I've set.
> > >
> > > fnam="/root/TempData/average/average_2010.nc"
> > > x=addfile(fnam,"r")
> > > data=x->var61(0,0,:,:)
> > > shapefile=addfile("/root/IRL_adm/IRL_adm1.shp","r")
> > > segments=shapefile->segments
> > > geometry=shapefile->geometry
> > > segsDims=dimsizes(segments)
> > > geomDims=dimsizes(geometry)
> > > geom_segIndex=shapefile@geom_segIndex
> > > geom_numSegs=shapefile@geom_numSegs
> > > segs_xyzIndex=shapefile@segs_xyxIndex
> > > segs_numPnts=shapefile@segs_numPnts
> > > lines=new(segsDims(0),graphic)
> > > numFeatures=geomDims(0)
> > > lon=shapefile->x
> > > lat=shapefile->y
> > > plres=True
> > > plres@gsEdgesOn=True
> > > plres@gsLineColor="black"
> > > plres@gsEdgeColor="black"
> > > xwks=gsn_open_wks("ps","Average_2010")
> > > resources=True
> > > resources@mpProjection="Mercator"
> > > xwks=gsn_open_wks("ps","Average_2010")
> > > gsn_define_colormap(xwks,colors)
> > > plot=gsn_csm_contour_map(xwks,data,resources)
> > > do i=0, numFeatures-1
> > > startSegment=geometry(i,geom_segIndex)
> > > numSegments=geometry(i,geom_numSegs)
> > > do seg=startSegment,startSegment+numSegments-1
> > > startPT=segments(seg,segs_xyzIndex)
> > > endPT=startPT+segments(seg,segs_numPnts)-1
> > > lines(segNum)=gsn_add_polyline(xwks,plot,lon(startPT:endPT),lat(startPT:endPT),plres)
> > > segNum=segNum+1
> > > end do
> > > end do
> > > end
> > >
> > > > From: brownrig@ucar.edu
> > > > Subject: Re: Detailed map of Ireland
> > > > To: cohara1985@hotmail.com; ncl-talk@ucar.edu
> > > > Date: Thu, 27 Feb 2014 06:25:22 -0700
> > > >
> > > > Hi Ciara,
> > > >
> > > > Check out the shapefiles examples at:
> > > >
> > > > http://www.ncl.ucar.edu/Applications/shapefiles.shtml
> > > >
> > > > Example #13 in particular is probably most applicable to what you are
> > > > wanting to do. Shapefiles for Ireland can be found at:
> > > >
> > > > http://www.gadm.org
> > > >
> > > > Shapefiles from GADM come in several levels, with the "0" level being
> > > > the national boundaries, level "1" the next administrative unit down
> > > > (eg., states in the US), and so on (level 2 is counties in the US).
> > > >
> > > > Hope that helps...
> > > > Rick
> > > >
> > > >
> > > > On Thu, 27 Feb 2014 12:46:37 +0000
> > > > Ciara O'Hara <cohara1985@hotmail.com> wrote:
> > > > > Hi,
> > > > >
> > > > > Is there any map I could use that contains more detail than the one
> > > > >I'm using now. I'm creating contour maps of Ireland but I'd like it
> > > > >to show county boundaries, is that possible?
> > > > >
> > > > > Regards,
> > > > > Ciara
> > > > >
> > > >
> > > _______________________________________________
> > > ncl-talk mailing list
> > > List instructions, subscriber options, unsubscribe:
> > > http://mailman.ucar.edu/mailman/listinfo/ncl-talk
> >
> _______________________________________________
> ncl-talk mailing list
> List instructions, subscriber options, unsubscribe:
> http://mailman.ucar.edu/mailman/listinfo/ncl-talk
_______________________________________________
ncl-talk mailing list
List instructions, subscriber options, unsubscribe:
http://mailman.ucar.edu/mailman/listinfo/ncl-talk
- application/octet-stream attachment: ireland.ncl