Date: Wed Mar 26 2014 - 20:00:51 MDT
Hi,
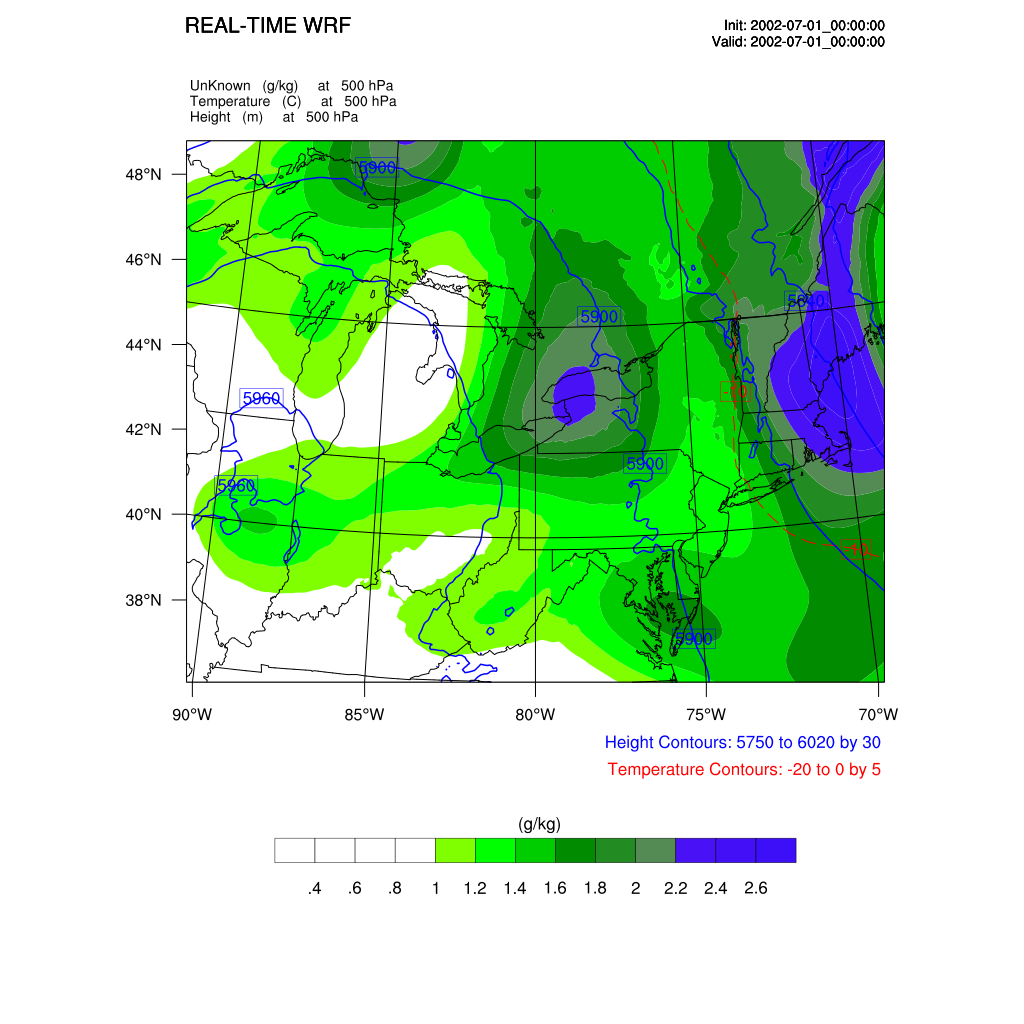
I am trying to plot pressure level plot from WRF output using
(http://www.mmm.ucar.edu/wrf/OnLineTutorial/Graphics/NCL/Examples/LEVELS_INTERP/wrf_PressureLevel3.ncl). I have replaced the "relative humidity" variable by "specific humidity" variable but having problem to replace the "long name" of the variable. Although I have declared the variable_at_long name = "Specific Humidity" it is showing "unknown" at 500 hPa. I am attaching the plot for your
convenience.
Thanks
Kamal
=====================================================================
sh = wrf_user_getvar(a,"QVAPOR",-1)
sh_plane = wrf_user_intrp3d(sh,p,"h",pressure_levels,0.,False)
q0 = sh_plane/(1+sh_plane)
q0 = q0*1000 ; g/kg
q0@long_name = "Specific Humidity"
q0@units = "g/kg"
; Plotting options for SH
opts = res
opts@cnFillOn = True
opts@pmLabelBarOrthogonalPosF = -0.1
opts@ContourParameters = (/ 5., 4., 3., 2., 1./)
opts@cnFillColors = (/"White","White","White", \
"White","Chartreuse","Green",\
"Green3","Green4", \
"ForestGreen","PaleGreen4"/)
contour_sh = wrf_contour(a,wks,q0(it,level,:,:),opts)
delete(opts)
======================================
_______________________________________________
ncl-talk mailing list
List instructions, subscriber options, unsubscribe:
http://mailman.ucar.edu/mailman/listinfo/ncl-talk