Unfortunately, the only way to attach arrows to a plot is if you are using the vector plotting utility, which requires that your data be on a grid.
You can try the kludgy way of adding lines to create arrows yourself using gsn_add_polyline.
Sorry I don't have a better answer for you. We *do* have it on our list to add a function that allows you to draw single vectors on a plot. I'll add your request to this ticket.
--Mary
On Apr 22, 2014, at 11:37 AM, Jeremy Stephan Pal <jpal@MIT.EDU> wrote:
> Dear Mary,
>
> I tried them before, after and everywhere in between. Yes, I saw the examples from the webpage you mention. In fact, I used one of the examples to make my script, the main difference being the loop.
>
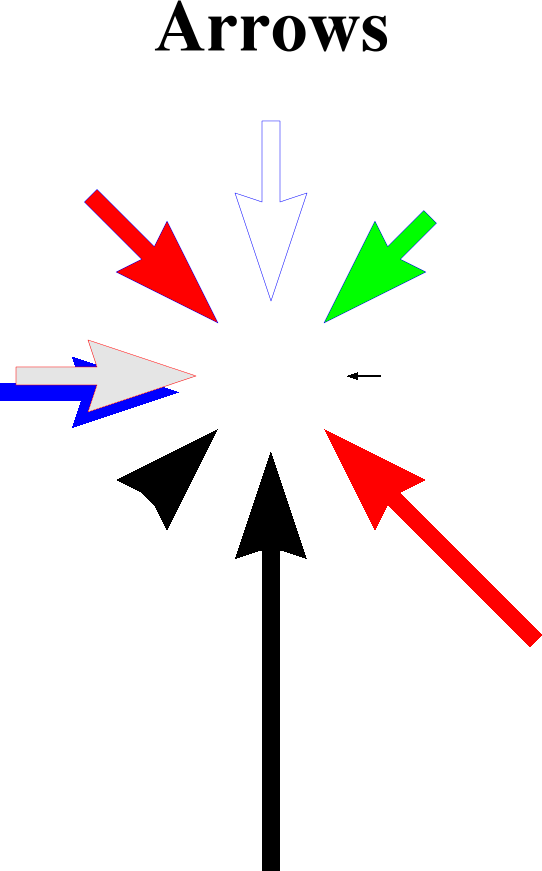
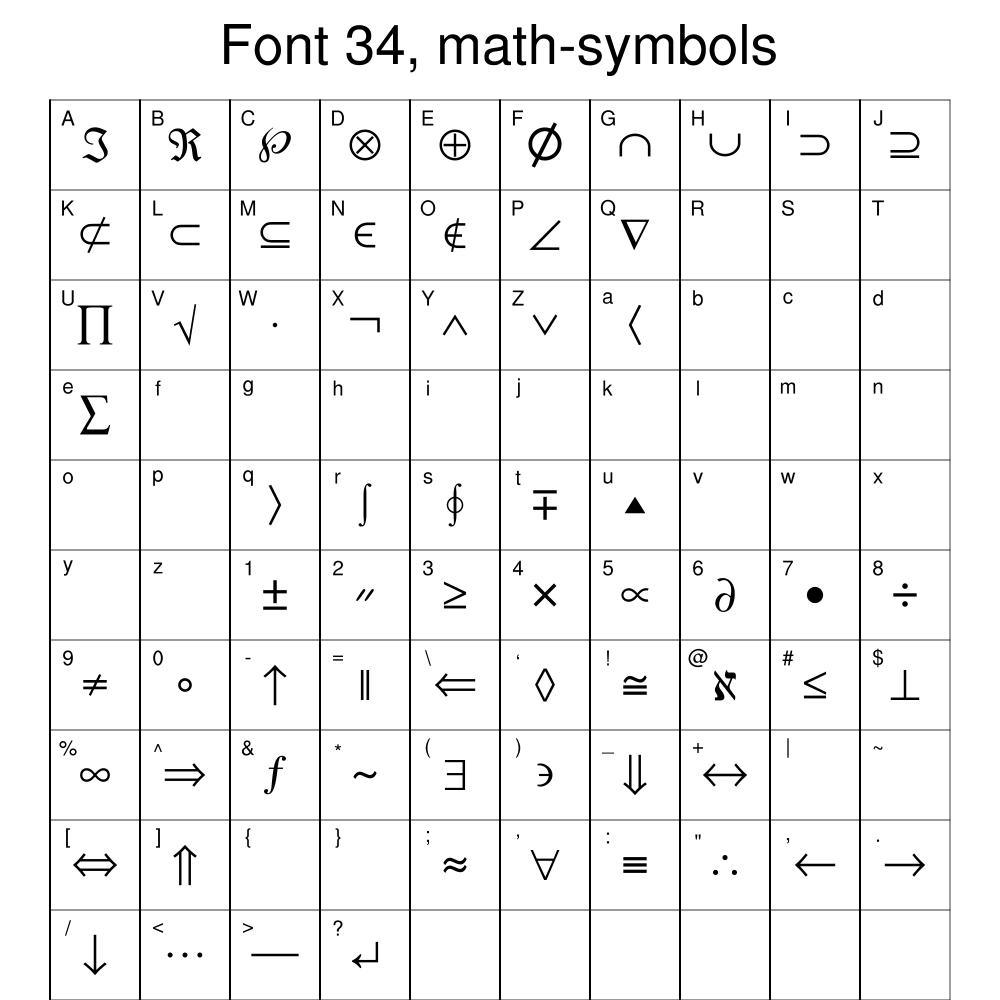
> Do you have a better way to add filled arrows to a plot similar to those in example 7 (http://www.ncl.ucar.edu/Applications/Images/weather_sym_7_lg.png)? I did not see any visually pleasing arrows from http://www.ncl.ucar.edu/Document/Graphics/Images/font34.png.
>
>
> Thanks in advance!
>
> Jeremy
>
>
>
> On Apr 21, 2014, at 11:41 AM, Mary Haley <haley@ucar.edu>
> wrote:
>
>> Jeremy,
>>
>> The wmxxxx functions are rather limited.
>>
>> In order to have them draw correctly, try drawing them *after* you draw the plot, and not before.
>>
>> Did you see some of our examples at:
>>
>> http://www.ncl.ucar.edu/Applications/weather_sym.shtml
>>
>> —Mary
>>
>> On Apr 17, 2014, at 8:27 PM, Jeremy Stephan Pal <jpal@MIT.EDU> wrote:
>>
>>> Hello,
>>>
>>> I am trying to plot weather symbols (arrows) on multiple plots using a loop. The arrows appear on the first plot, but do not on subsequent plots. A somewhat similar post back in 2007 indicated that it may be a problem related to memory and a work around is to delete the plot (http://www.ncl.ucar.edu/Support/talk_archives/2007/0210.html). Unfortunately, deleting the plot does not work for me. The relevant portion of my script appears below. I have also tried deleting wks and making unique names for wks and plot with no success.
>>>
>>> Any help is much appreciated!
>>>
>>> Thanks,
>>>
>>> Jeremy
>>>
>>>
>>> ...
>>>
>>> do istation=0,nstation-1
>>>
>>> blah blah blah
>>>
>>> wks = gsn_open_wks ("X11",fname)
>>>
>>> wmlabs(wks,0.445,0.78,"Arrow")
>>>
>>> res = True
>>> res@gsnDraw = False
>>> res@gsnFrame = False
>>>
>>> blah blah blah
>>>
>>> plot0 = gsn_csm_xy(wks,time_ref,var_mprf,res)
>>>
>>> blah blah blah
>>>
>>> draw(plot0)
>>> frame(wks)
>>>
>>> blah blah blah
>>>
>>> if (isdefined("plot0")) then delete(plot0) end if
>>>
>>> end do
>>>
>>> ...
>>>
>>> _______________________________________________
>>> ncl-talk mailing list
>>> List instructions, subscriber options, unsubscribe:
>>> http://mailman.ucar.edu/mailman/listinfo/ncl-talk
>>
>
> _______________________________________________
> ncl-talk mailing list
> List instructions, subscriber options, unsubscribe:
> http://mailman.ucar.edu/mailman/listinfo/ncl-talk
_______________________________________________
ncl-talk mailing list
List instructions, subscriber options, unsubscribe:
http://mailman.ucar.edu/mailman/listinfo/ncl-talk
Received on Tue Apr 29 09:03:00 2014
This archive was generated by hypermail 2.1.8 : Tue Apr 29 2014 - 09:04:20 MDT