Date: Tue May 13 2014 - 08:21:40 MDT
Hi, NCL group users:
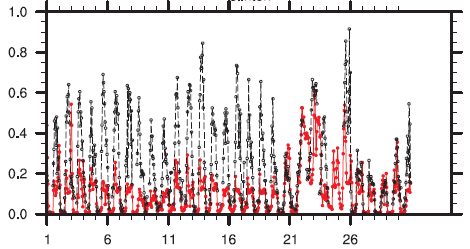
I have a plot with time x axis of september. As you can see in the attached plot, there is a blank in the end of the plot. I tried different ttmMajorStride and it doesnˇŻt work. I even tried @trXMaxF = ˇ°2013-09-30_23:00:00ˇ± which is the last time hour, but the plot is wield. So my question is how to delete the blank to let the meaningful last hour to be truely last hour in the plot or at least minimum the blank.
thanks,
-----------------------------------------------------------------------------
Lijun Diao
ldiao@uh.edu
Research Assistant
Department of Earth & Atmospheric Sciences
University of Houston
4800 Calhoun RD., Bldg. S&R1-312
Houston, TX 77204-5007
_______________________________________________
ncl-talk mailing list
List instructions, subscriber options, unsubscribe:
http://mailman.ucar.edu/mailman/listinfo/ncl-talk