Date: Tue Jun 03 2014 - 12:41:38 MDT
Hallo NCL,
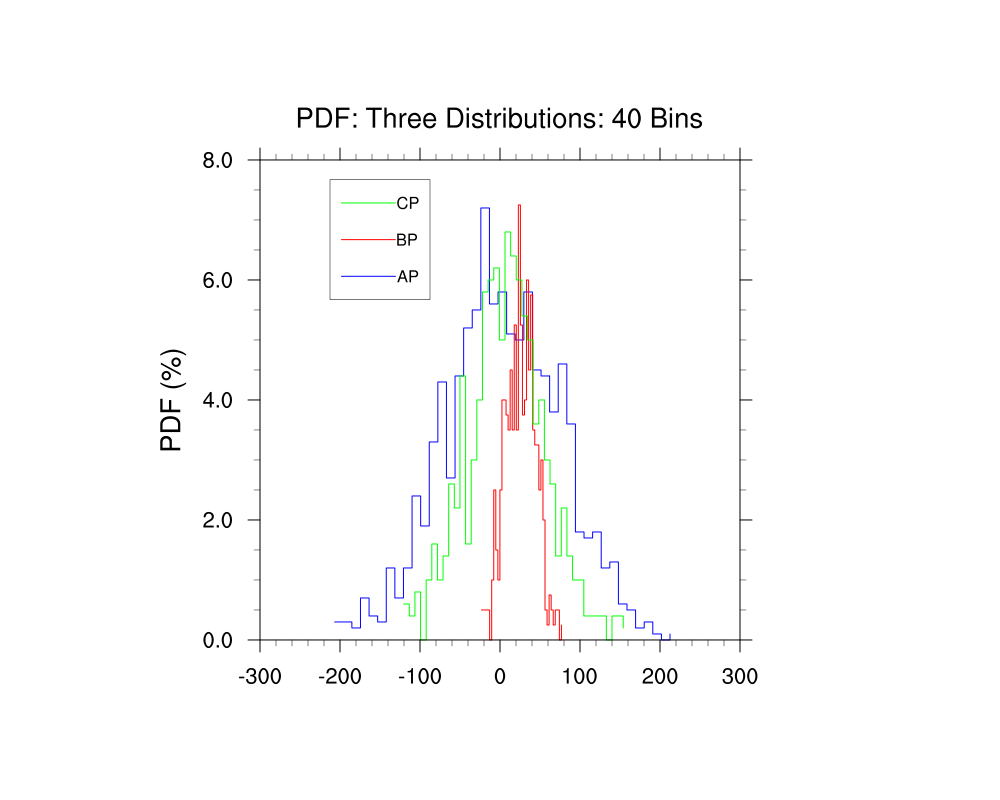
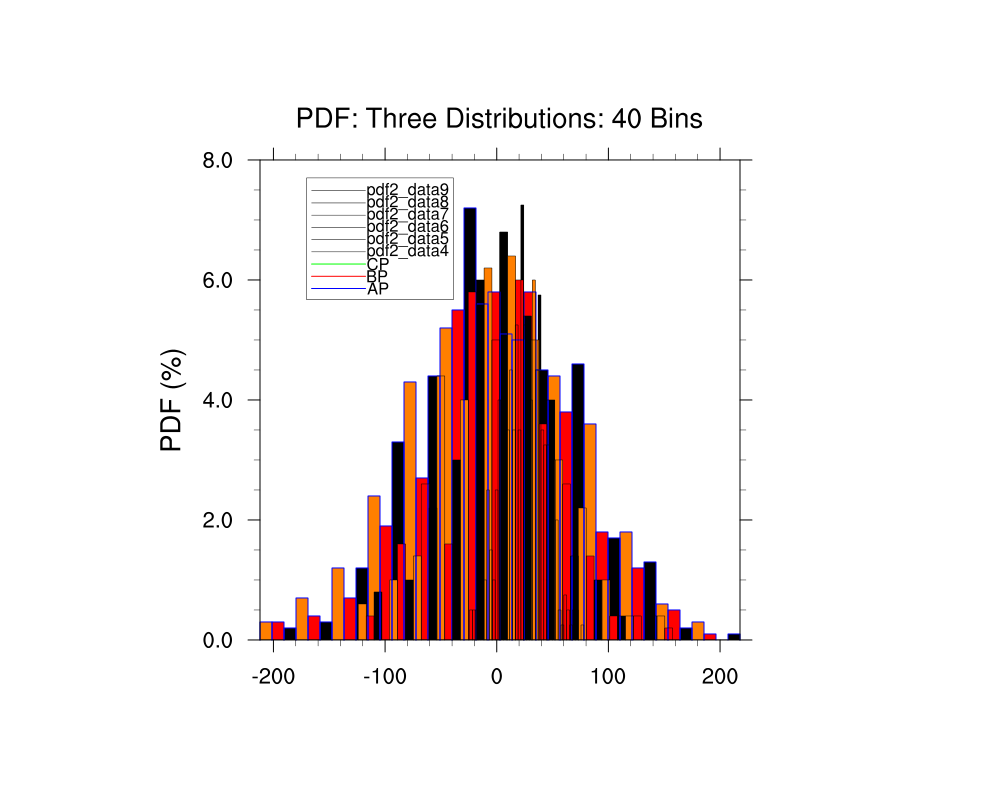
Lately Im trying to generate a plot by combining three distributions (bar
chart) from the output of pdf function.
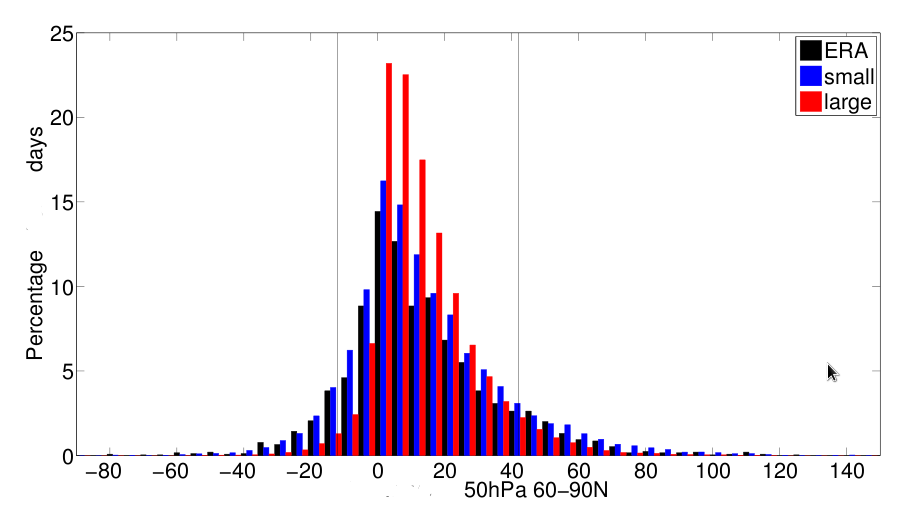
The figure that I want to have is attached (expected_figure.png). I
experimented to try it using a simple script provided in
example 2, but when i turn on the barchart options it seems like all the
bars are overlapped.
Is there any nice trick to do this kind of task (output of pdf function) ?
I really appreciate for your nice help
Best.
Erika
_______________________________________________
ncl-talk mailing list
List instructions, subscriber options, unsubscribe:
http://mailman.ucar.edu/mailman/listinfo/ncl-talk