Date: Mon Jun 02 2014 - 02:15:47 MDT
Hi ncl,
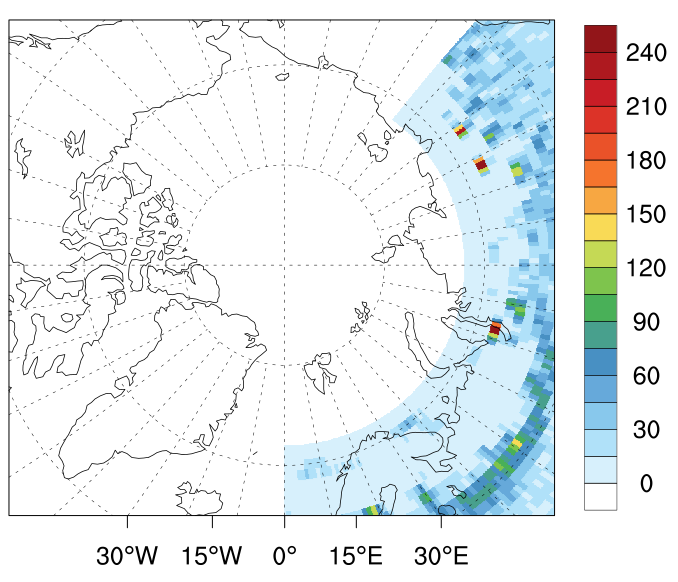
I have a problem with plotting a density of storms over the Arctic. The
distribution of density looks messy and lacks consistent coverage, which I
failed fixing. Could you please take a look and tell me if there is a way
to make the plotting work?
Thanks
Min Max values
Lon
min=0 max=357.5
Lat
min=2.5 max=87.5
SLP:
min=931.97 max=1072.27
My code:
load "$NCARG_ROOT/lib/ncarg/nclscripts/csm/gsn_code.ncl"
load "$NCARG_ROOT/lib/ncarg/nclscripts/csm/gsn_csm.ncl"
load "$NCARG_ROOT/lib/ncarg/nclscripts/csm/contributed.ncl"
load "$NCARG_ROOT/lib/ncarg/nclscripts/csm/shea_util.ncl"
begin
dummy1 = asciiread("NCEP_sum",-1,"float")
ncol1 = 6
npts1 = dimsizes(dummy1)/ncol1
data1 = onedtond(dummy1,(/npts1,ncol1/)) ; npts x ncol
data1@_FillValue = -9999999
lon1 = data1(:,0)
lat1 = data1(:,1)
slp1 = data1(:,5)
printMinMax(lon1,True)
printMinMax(lat1,True)
printMinMax(slp1,True)
arr1 = new((/73,144/),integer,-999)
arr1!0 = "lat1"
arr1&lat1=fspan(-90,90,73)
arr1&lat1@units = "degrees_north"
arr1!1 = "lon1"
arr1&lon1=fspan(0,357.5,144)
arr1&lon1@units = "degrees_east"
printVarSummary(arr1)
; CALCULATION OF DENSITY BY ADDING POINTS OVER SIMILAR POINTS
arr1 = 0 ; set array to all 0's
do nn = 0,dimsizes(slp1)-1
if (.not.ismissing(lat1(nn)).and..not.ismissing(lon1(nn))) then ;
check to make sure lat/lons are present
arr1({lat1(nn)},{lon1(nn)}) = (/ arr1({lat1(nn)},{lon1(nn)})+1 /)
end if
end do
printMinMax(arr1, True)
wks = gsn_open_wks("x11","all_st_density_"+i)
gsn_define_colormap(wks,"WhiteBlueGreenYellowRed") ; not technically
necessary
res = True
;CONTOUR RESOURCES
res@cnFillOn = True
res@cnLinesOn = False
res@cnLineLabelsOn = False
;GSN RESOURCES
res@gsnSpreadColors = True
res@gsnDraw = False
res@gsnFrame = False
res@gsnMaximize = True
;TITLE RESOURCES
res@mpLimitMode = "Corners"
res@mpLeftCornerLatF = 53.5
res@mpLeftCornerLonF = -44.7
res@mpRightCornerLatF = 54.2
res@mpRightCornerLonF = 135.1
res@mpCenterLonF = 0
res@mpCenterLatF = 90
res@mpProjection = "CylindricalEquidistant"
res@cnFillMode = "RasterFill"
res@cnLevelSelectionMode = "ExplicitLevels"
res@cnLevels = ispan(0,250,15)
res@sfXArray = lon1
res@sfYArray = lat1
res@tiMainString = "The long-term mean cyclone center count
in summer"
map = gsn_csm_contour_map(wks,arr1(:,:),res)
draw(map)
frame(wks)
end
_______________________________________________
ncl-talk mailing list
List instructions, subscriber options, unsubscribe:
http://mailman.ucar.edu/mailman/listinfo/ncl-talk