Date: Wed, 24 May 2006 10:15:25 -0600
Hi Charlie,
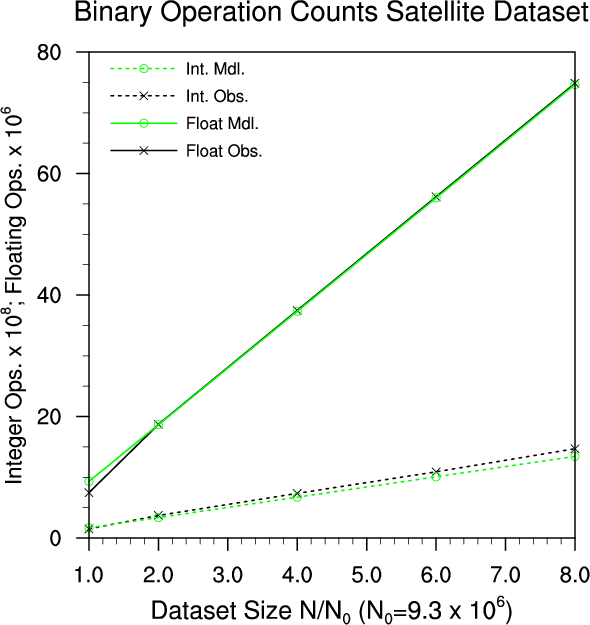
I got the script to draw the legend with the correct markers by using
and tweaking the legend resources found in example 1 on the legends
applications page:
http://www.ncl.ucar.edu/Applications/Scripts/leg_1.ncl
I have attached the script and resulting .gif image here. Notice that I
added a couple spaces before each legend label to push the label a bit
away from the legend lines.
Finally, you may already know this but we recommend people use and set a
.hluresfile that can set the default NCL font to helvetica and change
your text function code from a colon to a ~, amongst other things:
http://www.ncl.ucar.edu/Document/Graphics/hlures.shtml
Hope this helps...
Adam
Charlie Zender wrote:
> Hi NCLers,
>
> I need advice on how to add markers to my line legend in an XY plot.
> The self-contained script below correctly places markers (crosses and
> circles) on the curves in the main graphic, but I cannot figure out
> how to make the markers appear in the legend, i.e., in the short lines
> in the upper left corner next to the explanatory legend.
> I've tried drawing the legend with both gsn_polyline and
> gsn_add_polyline, and neither gives me the markers, although both
> give the correct line colors and dash styles.
>
> Any help appreciated,
> Charlie
> ************************************************************************
> ; Usage:
> ; cd ~/ncl;ncl < tst.ncl
>
> begin
>
> load "$NCARG_ROOT/lib/ncarg/nclscripts/csm/gsn_code.ncl"
> load "$NCARG_ROOT/lib/ncarg/nclscripts/csm/gsn_csm.ncl"
>
> ; Initialize some fields
> mss_val=1.0e36
>
> ; Markers: http://www.ncl.ucar.edu/Document/Graphics/Images/markers.gif
> idx_mrk_crc=04 ; Circle
> idx_mrk_crs=05 ; Cross
>
> ttl_sng="Binary Operation Counts Satellite Dataset"
> x_ttl_sng="Dataset Size N/N:B:0:N: (N:B:0:N:=9.3 x 10:S:6:N:)"
> y_ttl_sng="Integer Ops. x 10:S:8:N:; Floating Ops. x 10:S:6:N:"
>
> abc=(/1,2,4,6,8/)
> abc_nbr=dimsizes(abc)
> ord_nbr=4
> data=new((/ord_nbr,abc_nbr/),float,mss_val)
> ntg_obs=(/1.50, 3.71, 7.35, 10.9, 14.7/)
> flp_obs=(/7.47088, 1.87099e+01, 3.74527e+01, 5.61626e+01,
> 7.48399e+01/)
> ntg_mdl=(/1.680, 3.359, 6.718, 10.08, 13.44/)
> flp_mdl=(/9.3312, 18.6624, 37.3248, 55.9872, 74.6496/)
>
> idx_flp_obs=0
> idx_flp_mdl=1
> idx_ntg_obs=2
> idx_ntg_mdl=3
>
> data(idx_ntg_obs,:)=ntg_obs
> data(idx_flp_obs,:)=flp_obs
> data(idx_ntg_mdl,:)=ntg_mdl
> data(idx_flp_mdl,:)=flp_mdl
>
> dat_sng=new((/ord_nbr/),string)
> dat_sng(idx_ntg_obs)="Int. Obs."
> dat_sng(idx_flp_obs)="Float Obs."
> dat_sng(idx_ntg_mdl)="Int. Mdl."
> dat_sng(idx_flp_mdl)="Float Mdl."
>
> clr_sng=new((/ord_nbr/),string)
> clr_sng(idx_ntg_obs)="black"
> clr_sng(idx_flp_obs)="black"
> clr_sng(idx_ntg_mdl)="green"
> clr_sng(idx_flp_mdl)="green"
>
> ln_sty=0*new(ord_nbr,integer)
> ln_sty(idx_flp_obs)=0
> ln_sty(idx_flp_mdl)=0
> ln_sty(idx_ntg_obs)=50
> ln_sty(idx_ntg_mdl)=50
>
> ln_thk=new(ord_nbr,integer)
> ln_thk(:)=2
>
> ; Marker properties
> mrk_ln_md=new((/ord_nbr/),string)
> mrk_ln_md(:)="MarkLines" ; Line/marker combinations
> mrk_clr=clr_sng ; Marker color
> mrk_sz=new(ord_nbr,float)
> mrk_sz(:)=0.01
> mrk_typ=new(ord_nbr,integer)
> mrk_typ(idx_ntg_obs)=idx_mrk_crs
> mrk_typ(idx_flp_obs)=idx_mrk_crs
> mrk_typ(idx_ntg_mdl)=idx_mrk_crc
> mrk_typ(idx_flp_mdl)=idx_mrk_crc
>
> rsr=True
> rsr_at_gsnDraw=False
> rsr_at_gsnFrame=False
> rsr_at_gsnStringFont="helvetica"
> rsr_at_tiMainFont="helvetica"
> rsr_at_tiMainString=ttl_sng
> rsr_at_tiXAxisFont="helvetica"
> rsr_at_tiXAxisString=x_ttl_sng
> rsr_at_tiYAxisFont="helvetica"
> rsr_at_tiYAxisFontHeightF=.020
> rsr_at_tiYAxisOn=True
> rsr_at_tiYAxisString=y_ttl_sng
> rsr_at_tmXBLabelFont="helvetica"
> rsr_at_tmXTOn=False
> rsr_at_tmYLLabelFont="helvetica"
> rsr_at_tmYROn=False
> rsr_at_trXMinF=1.0
> rsr_at_xyDashPatterns=ln_sty
> rsr_at_xyLineColors=clr_sng
> rsr_at_xyLineThicknesses=ln_thk
> rsr_at_xyMarkLineModes=mrk_ln_md
> rsr_at_xyMarkerColors=clr_sng
> rsr_at_xyMarkerSizeF=mrk_sz
> rsr_at_xyMarkers=mrk_typ
>
> ; Legend annotations
> rsr_lgn_ln=True ; Polyline modifications desired
> rsr_lgn_ln_at_gsLineThicknessF=2.0 ; Line thicker
> rsr_lgn_txt=True ; Text modifications desired
> rsr_lgn_txt_at_txFont="helvetica"
> rsr_lgn_txt_at_txFontHeightF=0.015 ; Change text size
> rsr_lgn_txt_at_txJust="CenterLeft" ; Text justification
>
> lgn_ln_x1=1.2
> lgn_ln_dx=1.0
> lgn_ln_x2=lgn_ln_x1+lgn_ln_dx
> lgn_ln_x1_x2=(/lgn_ln_x1,lgn_ln_x2/)
> lgn_txt_x1=lgn_ln_x2+0.2
> lgn_y_top=75.0
> lgn_dy=5.0
> lgn_y=lgn_y_top-ispan(0,ord_nbr-1,1)*lgn_dy
>
> ; Open workstation and plot data
> wks=gsn_open_wks("eps","./tst")
> plot=gsn_csm_xy(wks,abc,data,rsr)
>
> ; Draw legend
> lgn_ln=new(ord_nbr,graphic)
> do idx=0,ord_nbr-1
> lgn_ln_y1_y2=(/lgn_y(idx),lgn_y(idx)/)
> rsr_lgn_ln_at_gsLineColor=clr_sng(idx)
> rsr_lgn_ln_at_gsLineDashPattern=ln_sty(idx)
> rsr_lgn_ln_at_xyMarkLineMode=mrk_ln_md(idx)
> rsr_lgn_ln_at_xyMarker=mrk_typ(idx)
> rsr_lgn_ln_at_xyMarkerColor=clr_sng(idx)
> rsr_lgn_ln_at_xyMarkerSizeF=mrk_sz(idx)
>
> lgn_ln(idx)=gsn_add_polyline(wks,plot,lgn_ln_x1_x2,lgn_ln_y1_y2,rsr_lgn_ln)
> ; gsn_polyline(wks,plot,lgn_ln_x1_x2,lgn_ln_y1_y2,rsr_lgn_ln)
> gsn_text(wks,plot,dat_sng(idx),lgn_txt_x1,lgn_y(idx),rsr_lgn_txt)
> end do; end loop over idx
>
> draw(plot)
>
> frame(wks)
>
> end
> ***********************************************************************
--
--------------------------------------------------------------
Adam Phillips			             asphilli_at_ucar.edu
National Center for Atmospheric Research   tel: (303) 497-1726
ESSL/CGD/CAS                               fax: (303) 497-1333
P.O. Box 3000
Boulder, CO 80307-3000	  http://www.cgd.ucar.edu/cas/asphilli
load "$NCARG_ROOT/lib/ncarg/nclscripts/csm/gsn_code.ncl"
load "$NCARG_ROOT/lib/ncarg/nclscripts/csm/gsn_csm.ncl"
begin
; Initialize some fields
mss_val=1.0e36
; Markers: http://www.ncl.ucar.edu/Document/Graphics/Images/markers.gif
idx_mrk_crc=04 ; Circle
idx_mrk_crs=05 ; Cross
ttl_sng="Binary Operation Counts Satellite Dataset"
x_ttl_sng="Dataset Size N/N:B:0:N: (N:B:0:N:=9.3 x 10:S:6:N:)"
y_ttl_sng="Integer Ops. x 10:S:8:N:; Floating Ops. x 10:S:6:N:"
abc=(/1,2,4,6,8/)
abc_nbr=dimsizes(abc)
ord_nbr=4
data=new((/ord_nbr,abc_nbr/),float,mss_val)
ntg_obs=(/1.50, 3.71, 7.35, 10.9, 14.7/)
flp_obs=(/7.47088, 1.87099e+01, 3.74527e+01, 5.61626e+01, 7.48399e+01/)
ntg_mdl=(/1.680, 3.359, 6.718, 10.08, 13.44/)
flp_mdl=(/9.3312, 18.6624, 37.3248, 55.9872, 74.6496/)
idx_flp_obs=0
idx_flp_mdl=1
idx_ntg_obs=2
idx_ntg_mdl=3
data(idx_ntg_obs,:)=ntg_obs
data(idx_flp_obs,:)=flp_obs
data(idx_ntg_mdl,:)=ntg_mdl
data(idx_flp_mdl,:)=flp_mdl
dat_sng=new((/ord_nbr/),string)
dat_sng(idx_ntg_obs)=" Int. Obs."
dat_sng(idx_flp_obs)=" Float Obs."
dat_sng(idx_ntg_mdl)=" Int. Mdl."
dat_sng(idx_flp_mdl)=" Float Mdl."
clr_sng=new((/ord_nbr/),string)
clr_sng(idx_ntg_obs)="black"
clr_sng(idx_flp_obs)="black"
clr_sng(idx_ntg_mdl)="green"
clr_sng(idx_flp_mdl)="green"
ln_sty=0*new(ord_nbr,integer)
ln_sty(idx_flp_obs)=0
ln_sty(idx_flp_mdl)=0
ln_sty(idx_ntg_obs)=50
ln_sty(idx_ntg_mdl)=50
ln_thk=new(ord_nbr,integer)
ln_thk(:)=2
; Marker properties
mrk_ln_md=new((/ord_nbr/),string)
mrk_ln_md(:)="MarkLines" ; Line/marker combinations
mrk_clr=clr_sng ; Marker color
mrk_sz=new(ord_nbr,float)
mrk_sz(:)=0.01
mrk_typ=new(ord_nbr,integer)
mrk_typ(idx_ntg_obs)=idx_mrk_crs
mrk_typ(idx_flp_obs)=idx_mrk_crs
mrk_typ(idx_ntg_mdl)=idx_mrk_crc
mrk_typ(idx_flp_mdl)=idx_mrk_crc
rsr=True
rsr_at_gsnDraw=False
rsr_at_gsnFrame=False
rsr_at_gsnStringFont="helvetica"
rsr_at_tiMainFont="helvetica"
rsr_at_tiMainString=ttl_sng
rsr_at_tiXAxisFont="helvetica"
rsr_at_tiXAxisString=x_ttl_sng
rsr_at_tiYAxisFont="helvetica"
rsr_at_tiYAxisFontHeightF=.020
rsr_at_tiYAxisOn=True
rsr_at_tiYAxisString=y_ttl_sng
rsr_at_tmXBLabelFont="helvetica"
rsr_at_tmXTOn=False
rsr_at_tmYLLabelFont="helvetica"
rsr_at_tmYROn=False
rsr_at_trXMinF=1.0
rsr_at_xyDashPatterns=ln_sty
rsr_at_xyLineColors=clr_sng
rsr_at_xyLineThicknesses=ln_thk
rsr_at_xyMarkLineModes=mrk_ln_md
rsr_at_xyMarkerColors=clr_sng
rsr_at_xyMarkerSizeF=mrk_sz
rsr_at_xyMarkers=mrk_typ
; Legend annotations
rsr_lgn_ln=True ; Polyline modifications desired
rsr_lgn_ln_at_gsLineThicknessF=2.0 ; Line thicker
rsr_lgn_txt=True ; Text modifications desired
rsr_lgn_txt_at_txFont="helvetica"
rsr_lgn_txt_at_txFontHeightF=0.015 ; Change text size
rsr_lgn_txt_at_txJust="CenterLeft" ; Text justification
lgn_ln_x1=1.2
lgn_ln_dx=1.0
lgn_ln_x2=lgn_ln_x1+lgn_ln_dx
lgn_ln_x1_x2=(/lgn_ln_x1,lgn_ln_x2/)
lgn_txt_x1=lgn_ln_x2+0.2
lgn_y_top=75.0
lgn_dy=5.0
lgn_y=lgn_y_top-ispan(0,ord_nbr-1,1)*lgn_dy
; Open workstation and plot data
wks=gsn_open_wks("eps","./tst")
rsr_at_pmLegendDisplayMode = "Always" ; turn on legend
rsr_at_pmLegendSide = "Top" ; Change location of
rsr_at_pmLegendParallelPosF = .2 ; move units right
rsr_at_pmLegendOrthogonalPosF = -0.35 ; move units down
rsr_at_pmLegendWidthF = 0.15 ; Change width and
rsr_at_pmLegendHeightF = 0.15 ; height of legend.
rsr_at_lgPerimOn = False ; turn off box around
rsr_at_lgLabelFontHeightF = .015 ; label font height
rsr_at_xyExplicitLegendLabels = dat_sng
plot=gsn_csm_xy(wks,abc,data,rsr)
; Draw legend
;lgn_ln=new(ord_nbr,graphic)
;do idx=0,ord_nbr-1
; lgn_ln_y1_y2=(/lgn_y(idx),lgn_y(idx)/)
; rsr_lgn_ln_at_gsLineColor=clr_sng(idx)
; rsr_lgn_ln_at_gsLineDashPattern=ln_sty(idx)
; rsr_lgn_ln_at_xyMarkLineMode=mrk_ln_md(idx)
; rsr_lgn_ln_at_xyMarker=mrk_typ(idx)
; rsr_lgn_ln_at_xyMarkerColor=clr_sng(idx)
; rsr_lgn_ln_at_xyMarkerSizeF=mrk_sz(idx)
;
;lgn_ln(idx)=gsn_add_polyline(wks,plot,lgn_ln_x1_x2,lgn_ln_y1_y2,rsr_lgn_ln)
;;; gsn_polyline(wks,plot,lgn_ln_x1_x2,lgn_ln_y1_y2,rsr_lgn_ln)
; gsn_text(wks,plot,dat_sng(idx),lgn_txt_x1,lgn_y(idx),rsr_lgn_txt)
;end do; end loop over idx
draw(plot)
frame(wks)
end
_______________________________________________
ncl-talk mailing list
ncl-talk_at_ucar.edu
http://mailman.ucar.edu/mailman/listinfo/ncl-talk
