Date: Thu Feb 24 2011 - 15:58:06 MST
Hi Maurice,
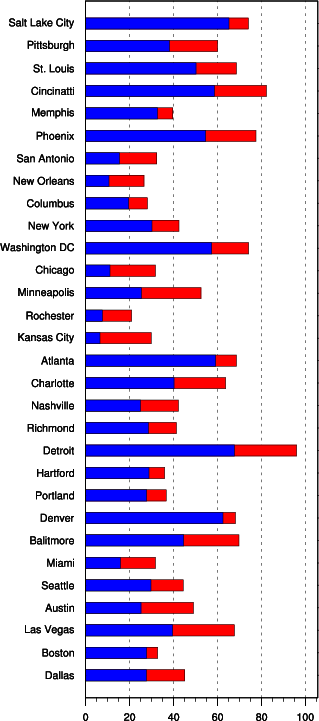
I've got an example that uses dummy data. See attached.
If you can/want to provide real data, I will change my dummy example on the web:
http://www.ncl.ucar.edu/Applications/bar.shtml#ex10
--Mary
On Feb 24, 2011, at 2:29 PM, Maurice.McHugh@noaa.gov wrote:
> Dear NCL-ers,
>
> I attach a plot I'd like to reproduce but cannot figure out how to do it in NCL. How do I go about making this type of chart?
>
> Many thanks,
>
> Maurice
>
> <Presentation1.png>_______________________________________________
> ncl-talk mailing list
> List instructions, subscriber options, unsubscribe:
> http://mailman.ucar.edu/mailman/listinfo/ncl-talk
_______________________________________________
ncl-talk mailing list
List instructions, subscriber options, unsubscribe:
http://mailman.ucar.edu/mailman/listinfo/ncl-talk
- application/octet-stream attachment: bar_10.ncl