NCL Home>
Application examples>
Plot techniques ||
Data files for some examples
Example pages containing:
tips |
resources |
functions/procedures
NCL Graphics: Bar Charts
Bar charts (in this context) are simply XY plots that are drawn with
bars for each X,Y point. To get bars instead of curves when
using
gsn_csm_xy, set the
special attribute res@
gsnXYBarChart = True.
If you need to bin the data, see
the histograms examples page which talks
about binning data according to ranges of values or actual values, or
the
binning satellite and observational data
which talks about summing and averaging binned data.
There are several "gsn" resources specific to customizing bars
in an XY plot.
Filling bars pivoted about an X or Y reference line:
- gsnYRefLine - Defines a Y reference line
(horizontal) about which to pivot the bars either up or down. All Y
values greater than this reference line will be drawn as bars pointing
up, and all bars less than will be pointing down.
- gsnXRefLine - Defines an X reference line
(vertical) about which to pivot the bars either left or right. All X
values greater than this reference line will be drawn as bars pointing
right, and all bars less than will be pointing left. This feature
will only work in NCL V6.4.0 and later.
- gsnXYBarChartColors /
gsnXYBarChartColors2 - Defines the fill
colors for each bar. See the descriptions for futher details.
- gsnXYBarChartPatterns /
gsnXYBarChartPatterns2 - Defines the fill
patterns for each bar. See the descriptions for futher details.
- gsnXYBarChartOutlineOnly - Outline
only the outside edges of each bar.
Setting fill colors specifically for a vertically-oriented bar
chart:
Setting fill colors specifically for a horizontally-oriented bar
chart.
These resources will only work in NCL V6.4.0 and later:
Setting fill colors for a vertically-oriented bar chart:
Setting fill colors for a horizontally-oriented bar chart.
These resources will only work in NCL V6.4.0 and later:
Customizing the look of color or pattern filled bars:
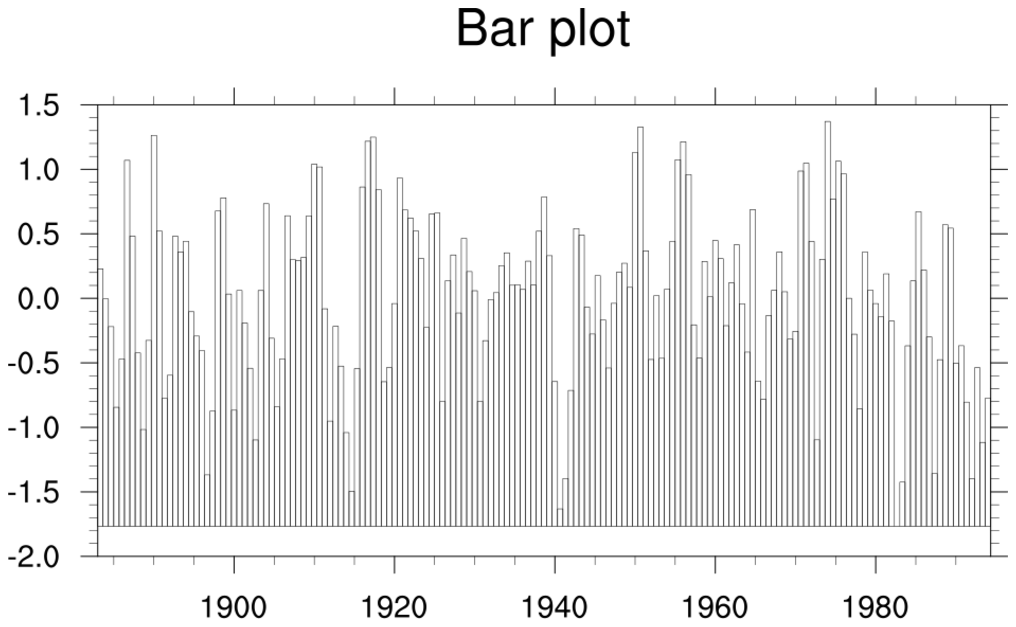
 bar_1.ncl
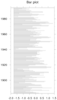
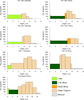
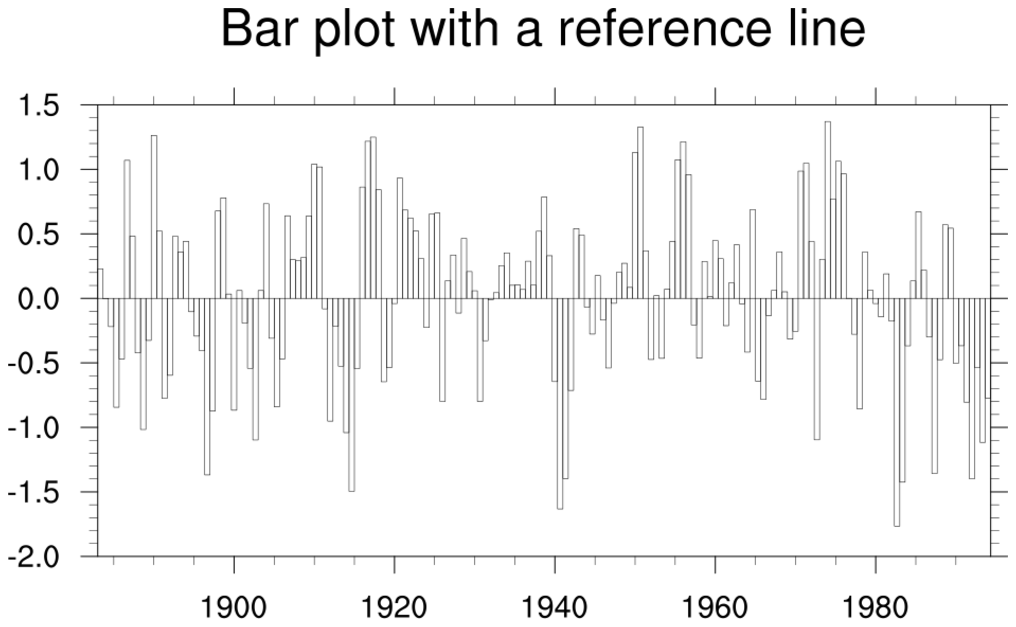
:
This shows a series of bar charts.
The first frame sets gsnXYBarChart
to True, which causes each Y value to be represented by a bar pointing
upward. The base of each bar is the minimum Y value or the value
of trYMinF, if set. Each bar
is centered about its corresponding X value.
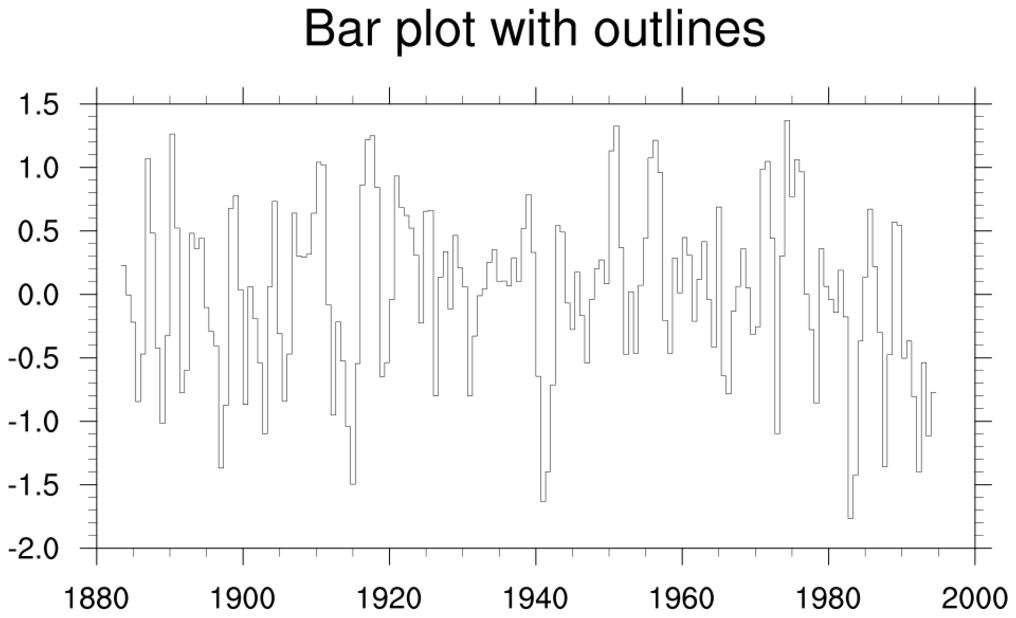
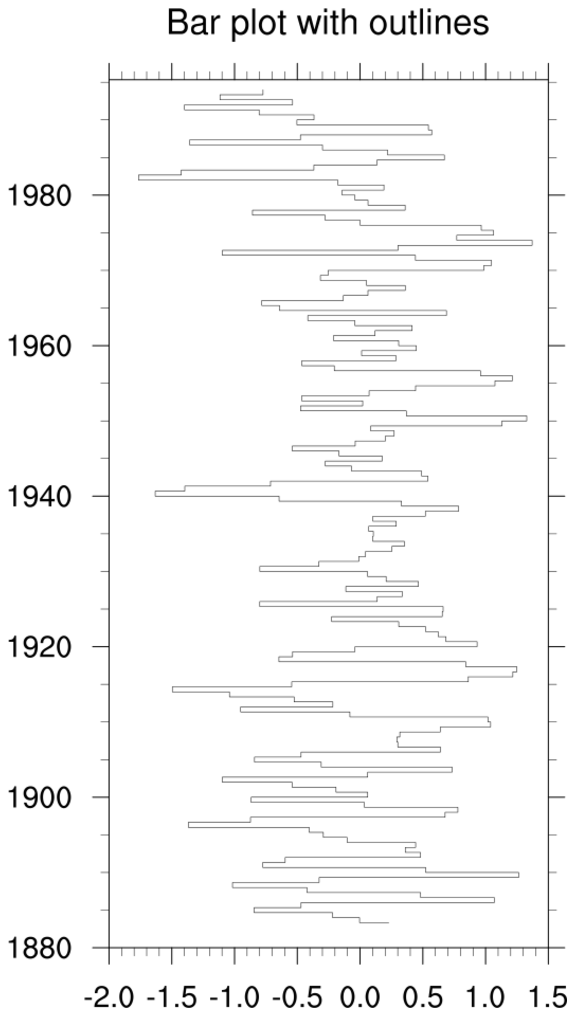
The second frame additionally
sets gsnXYBarChartOutlineOnly to True,
which causes each Y value to be represented by a horizontal bar,
creating an outline plot. There are no individual bars drawn
here. Here, each vertical line is exactly at the corresponding X
value, and NOT centered about it
like gsnXYBarChart.
The third frame sets gsnYRefLine to 0,
causing all the positive Y values to be drawn as bars pointing upward,
and all negative Y values to be drawn as bars pointing downward.

 bar_horz_1.ncl
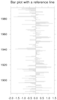
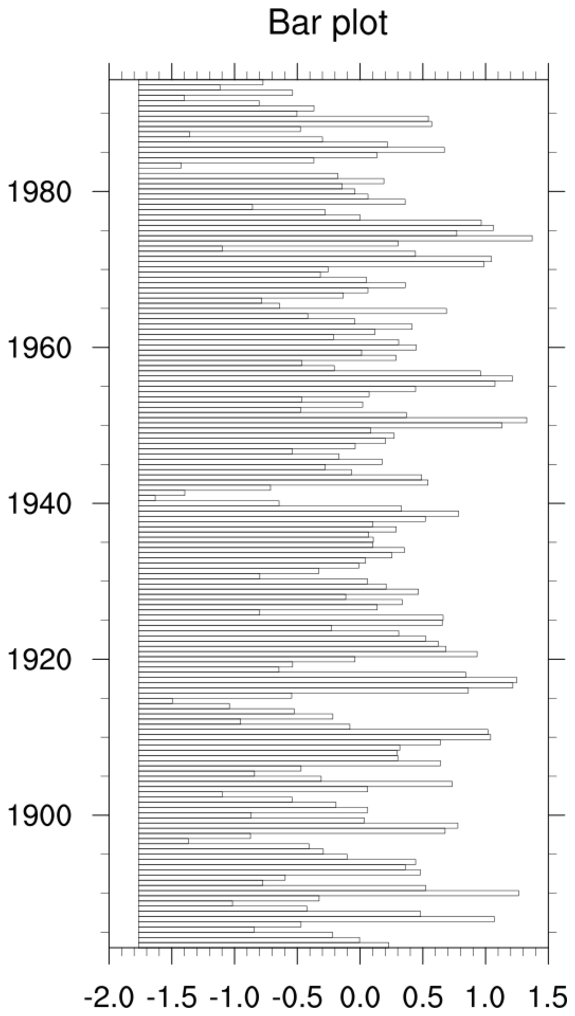
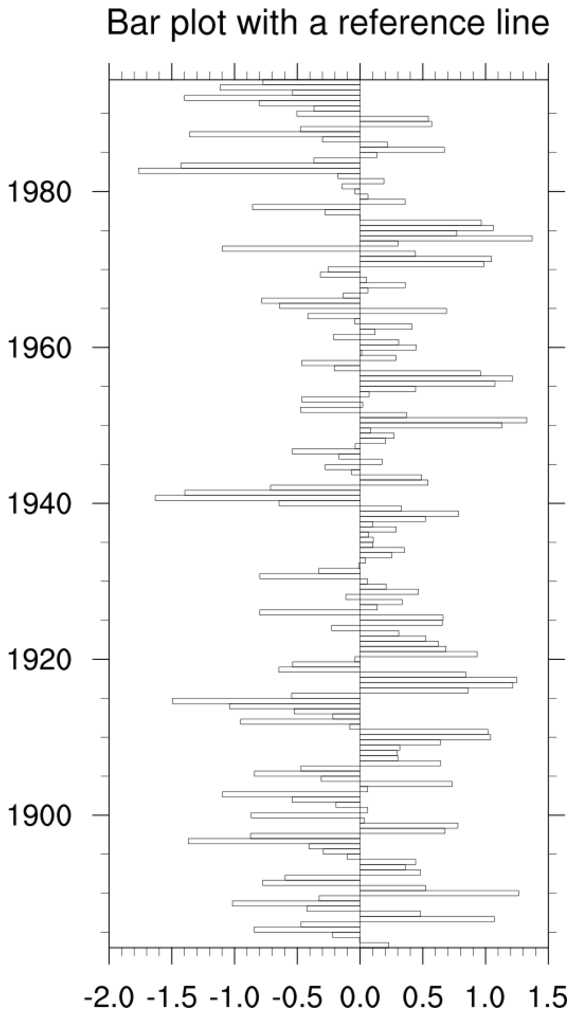
:
This example is similar to bar_1.ncl, except it shows how to draw the bars horizontally. Since the default for
gsnXYBarChart is to draw vertical bars, the way to get horizontal bars is
by setting
gsnXRefLine to the desired value where you want the bars to point left or right.
You also need to swap the x and y data variables in the call to
gsn_csm_xy.
This capability is only available in NCL version 6.4.0 or later.
 bar_2.ncl
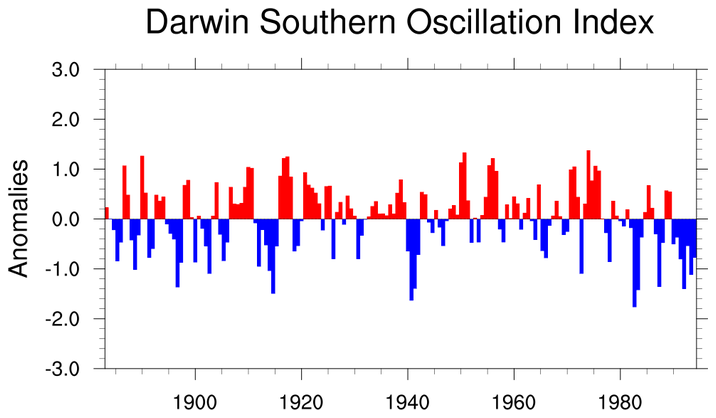
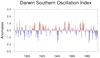
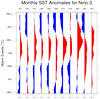
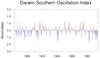
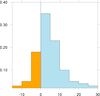
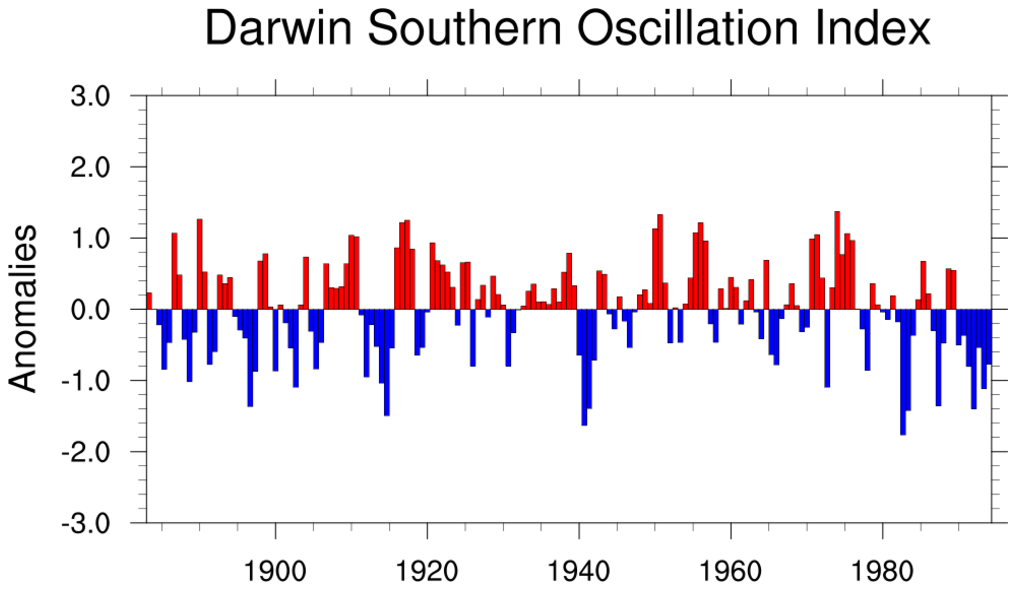
:
Demonstrates coloring values above and below a reference line with a
particular color.
gsnAboveYRefLineColor = "red", and
gsnBelowYRefLineColor = "blue", are the
two resources required to shade the bars above and below the reference
line.
A Python version of this projection is available here.
 bar_3.ncl
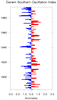
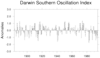
:
Demonstrates changing the size of the bars.
By default, the thickness of each bar is delta-x. You can make the
bars smaller than this by setting gsnXYBarChartBarWidth to a smaller number. In
this instance, delta-x is 0.66 and we have changed the width to
0.1. Note that at this point it becomes hard to see the bar colors,
because the bars are pretty thin.
 bar_4.ncl
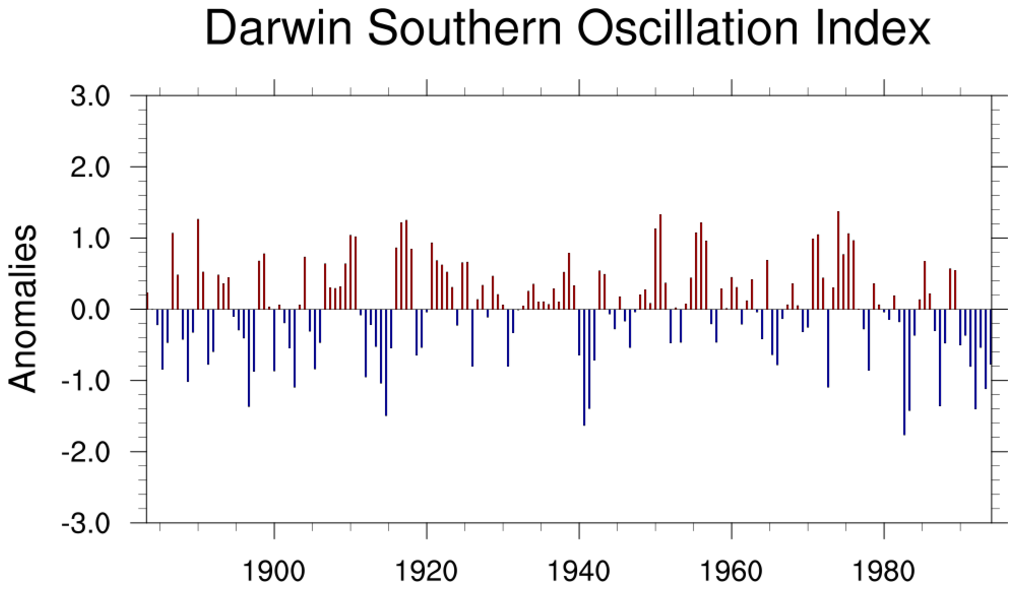
:
Demonstrates turning off bar outline around each bar. This is useful
when you have a lot of data points because the outline is drawn after
the color fill, and a black line and can obscure it.
xyLineColors = (/"red","blue"/),
changes the outline color for the above and below color filled areas
respectively.
 bar_horz_4.ncl
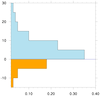
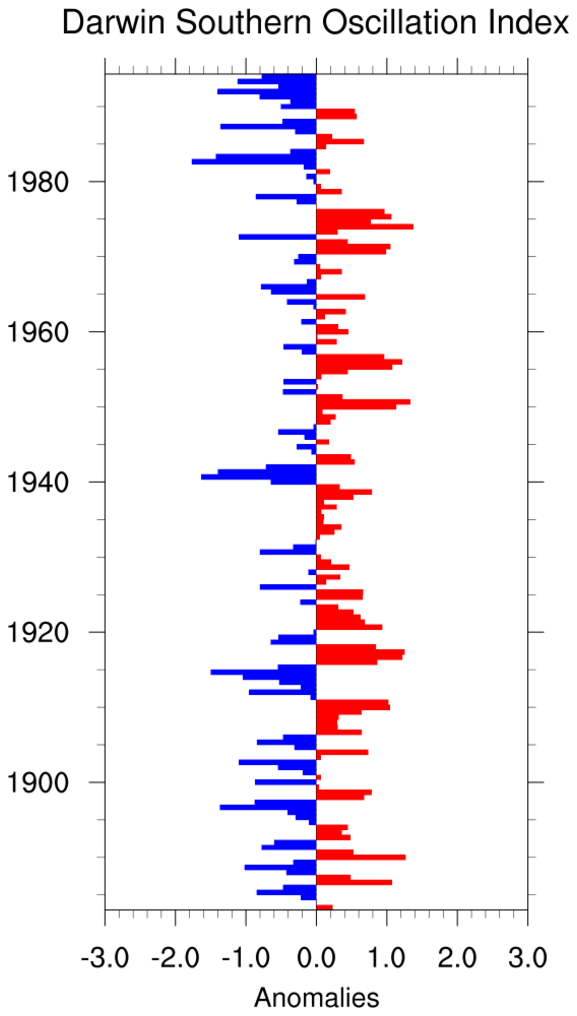
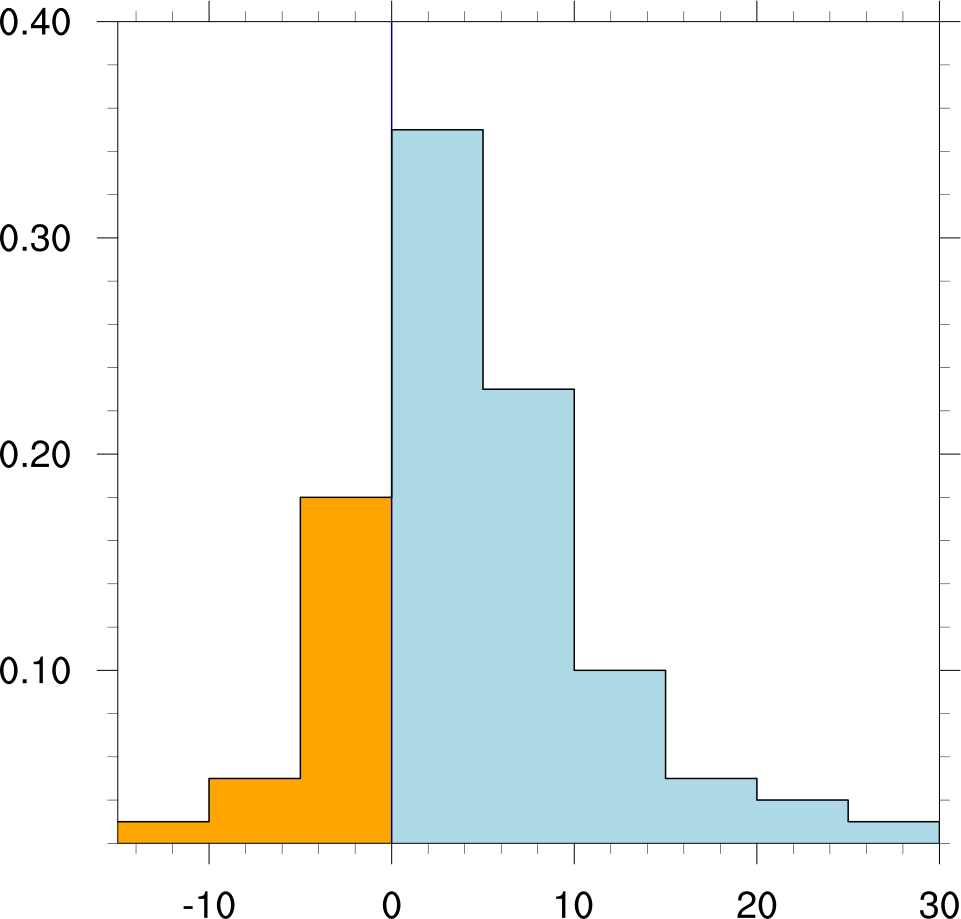
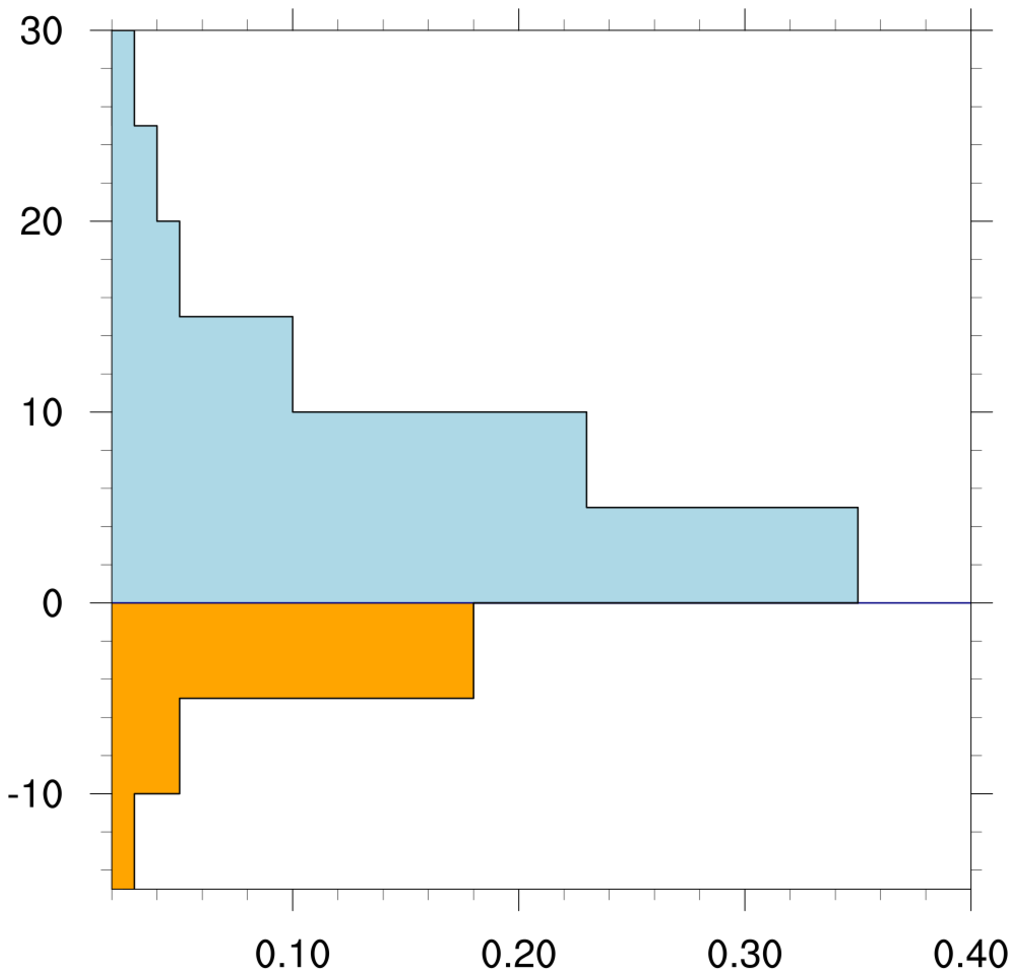
:
This example is similar to bar_4.ncl, except it shows how to draw the bars horizontally and fill them in different colors
based on whether they fall to the right or left of
gsnXRefLine = 0.
Use the resources
gsnRightXRefLineColor
and
gsnLeftXRefLineColor to set the desired colors.
This capability is only available in NCL version 6.4.0 or later.
 bar_horz_5.ncl
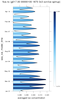
:
This example is similar to bar_5.ncl. The
gsnXRefLine resource is set to an array
of values to provide several X reference lines for multiple bar charts. As with example bar_horz_4.ncl,
the resources
gsnRightXRefLineColor and
gsnLeftXRefLineColor
are used set the desired fill colors for the bars.
This capability is only available in NCL version 6.4.0 or later.
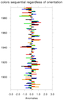
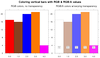
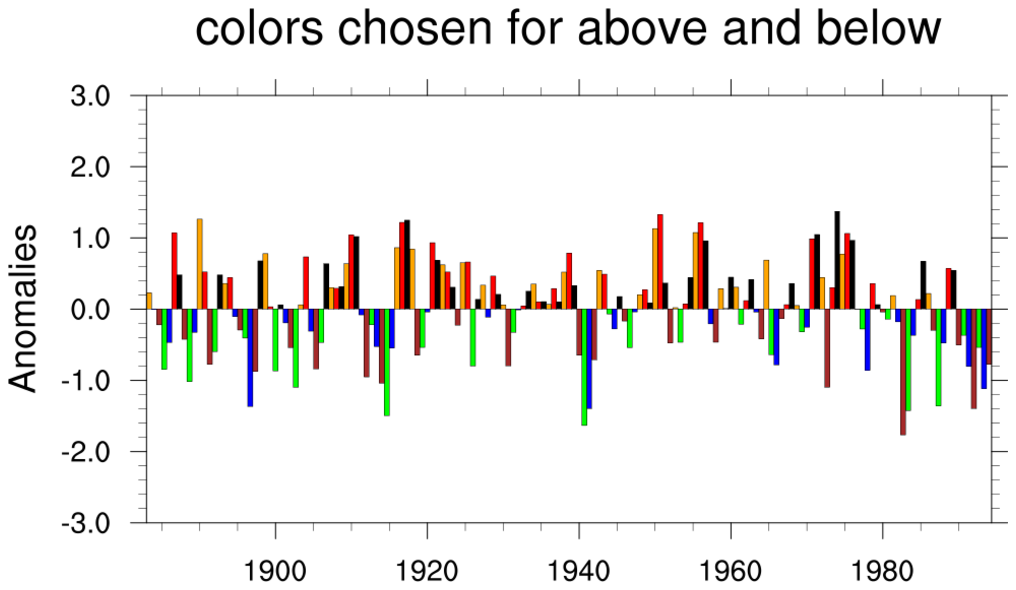
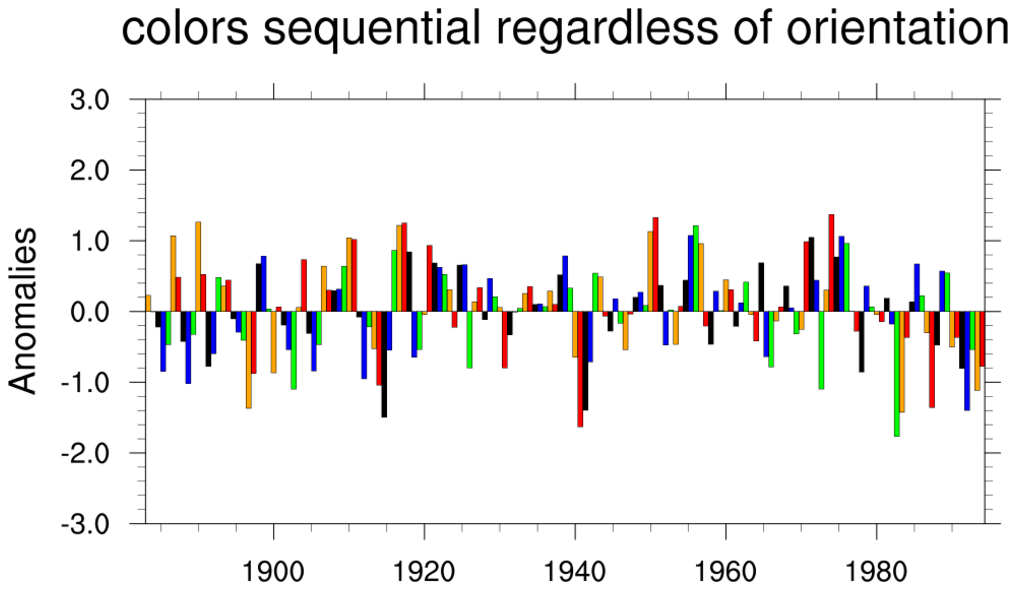
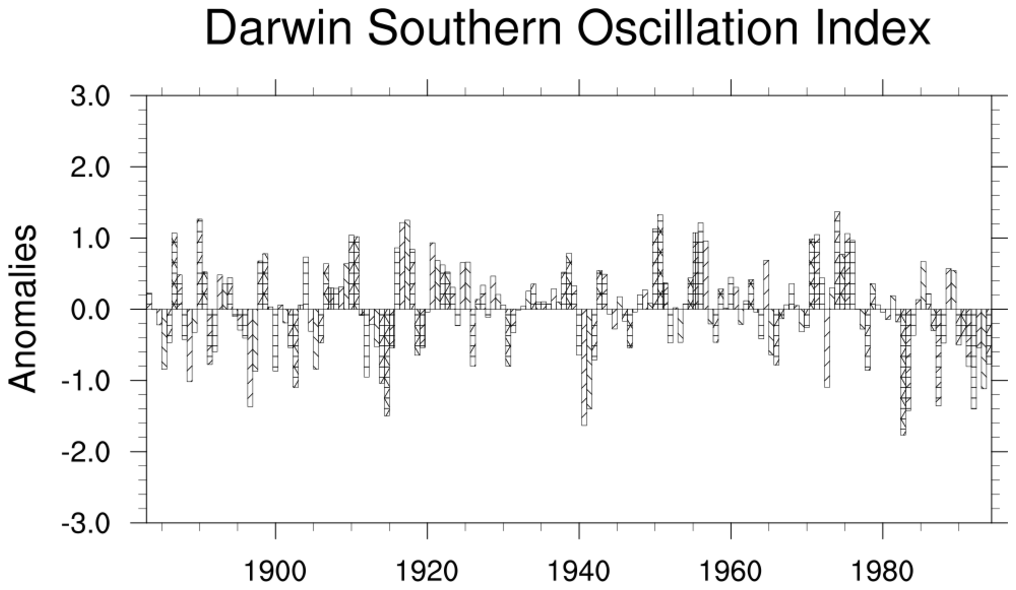
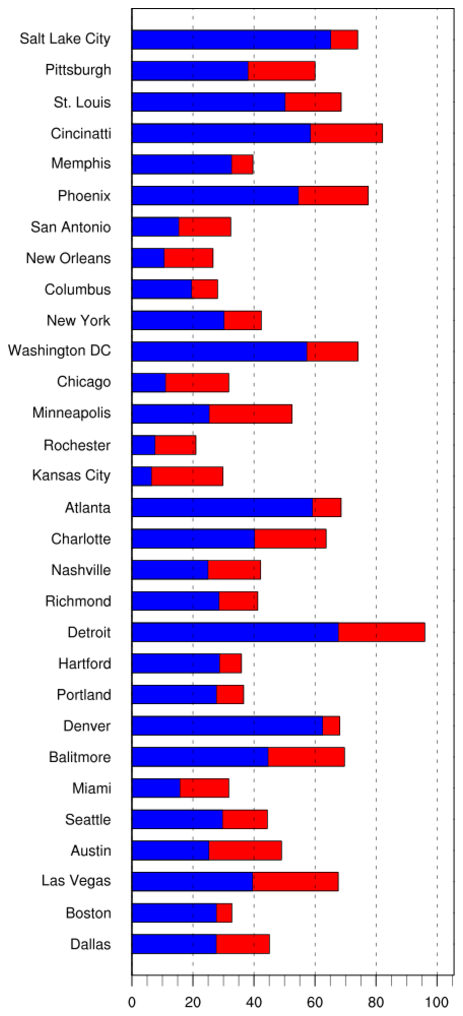
 bar_6.ncl
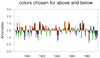
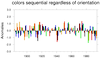
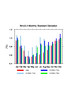
:
Demonstrates how to make individual bars different colors within a bar
chart that has a reference line. The colors can be chosen separately
for the above and below bars (first plot), or sequentially regardless
of orientation (second plot).
gsnAboveYRefLineBarColors controls the
colors of the bars above the reference line. This is an array. The
colors will repeat. gsnBelowYRefLineBarColors controls the colors
below the reference line.
gsnXYBarChartColors2 will assign a
sequence of colors regardless of bar orientation.
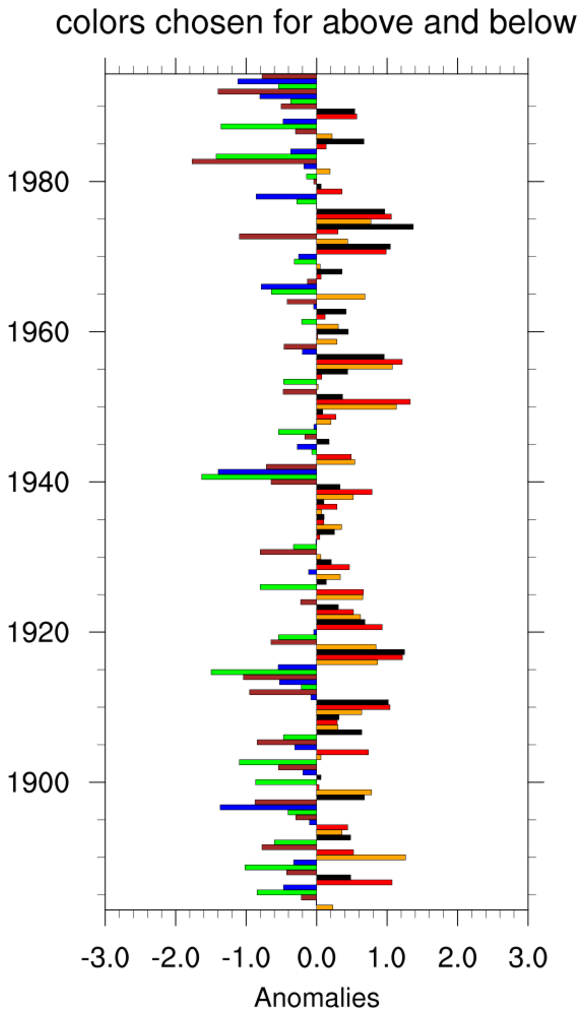
 bar_horz_6.ncl
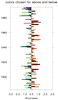
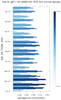
:
bar_horz_6.ncl: This example is similar
to bar_6.ncl, except it shows how to draw the bars horizontally.
The resources
gsnRightXRefLineBarColors and res@
gsnLeftXRefLineBarColors
are used to color the bars to the right and left of the X reference line in the first plot.
In the second plot,
gsnXYBarChartColors2 is used in the same way as the bar_6.ncl example to specify the fill colors.
This capability is only available in NCL version 6.4.0 or later.
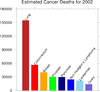
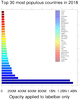
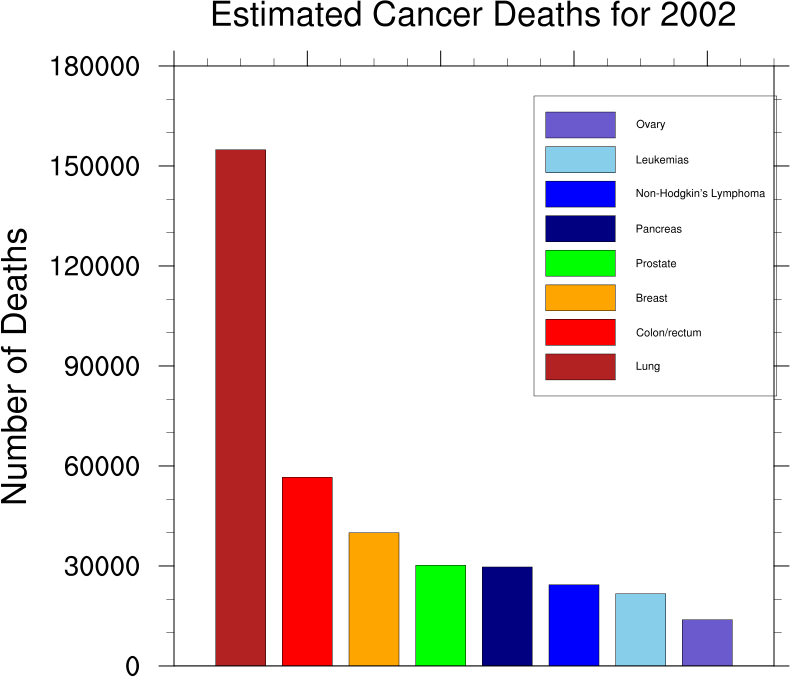
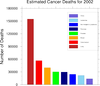 bar_7.ncl
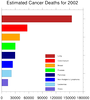
:
A bar chart w/o a reference line, and individual colors. The second
frame adds a labelbar. A Python version of this projection is available
here.
gsnXYBarChartColors controls the colors
of the bars.
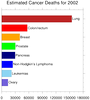
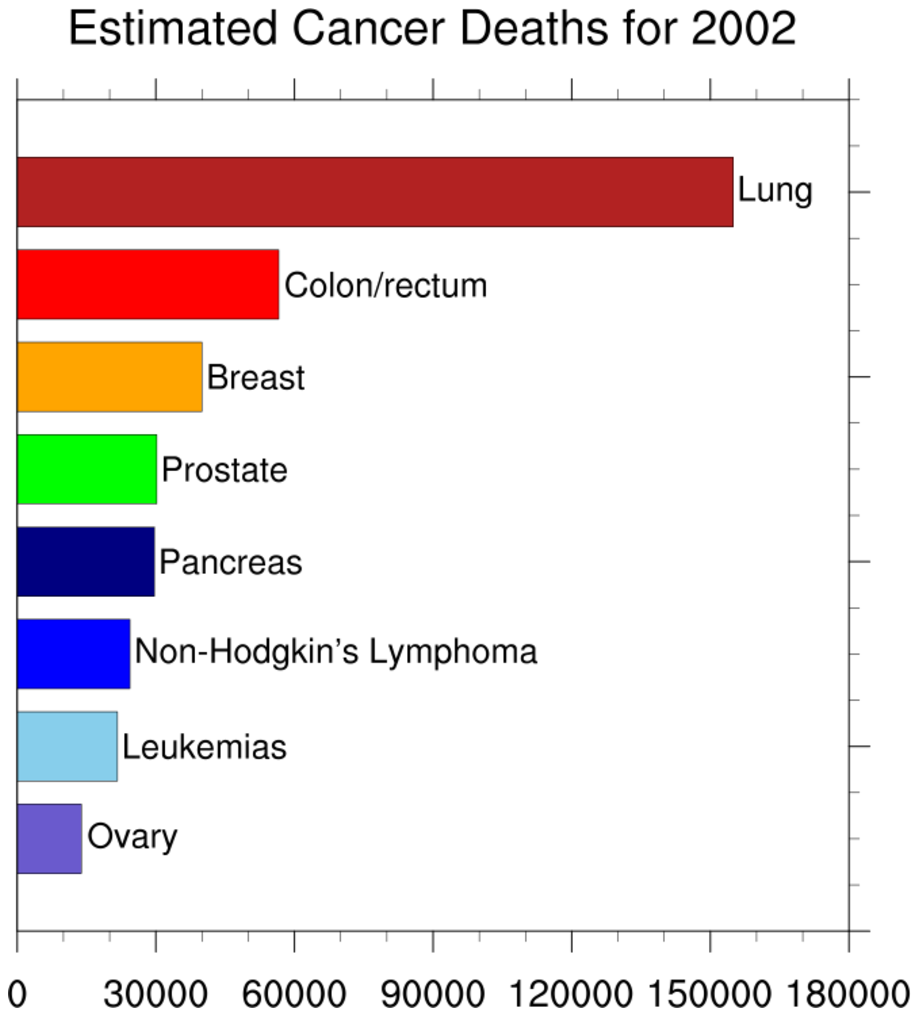
 bar_horz_7.ncl
:
This example is similar to bar_7.ncl, except it shows how to draw the
bars horizontally. The
gsnXYBarChartColors
controls the colors of the horizontal bars the same way it does the
vertical bars.
This capability is only available in NCL version 6.4.0 or later.
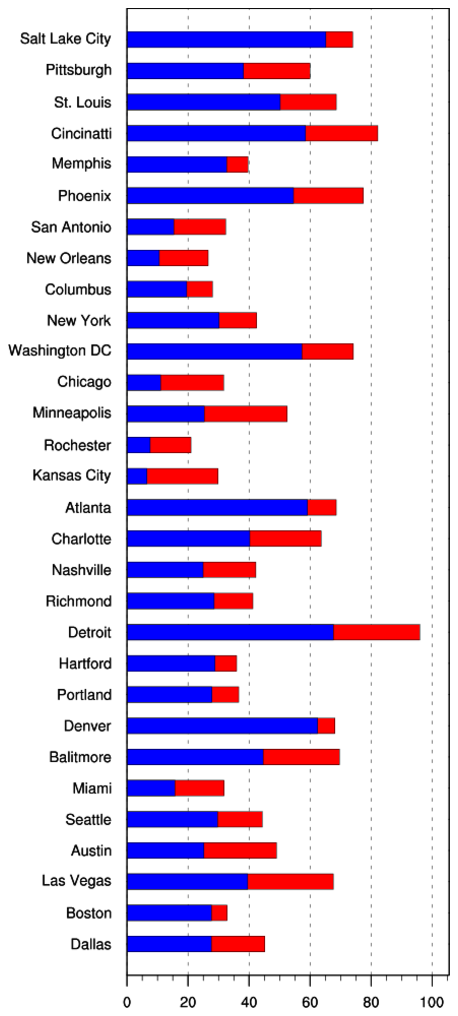
 bar_8.ncl
:
Demonstrates how to make individual bars different colors and
patterns within a bar chart that has a reference line. Colors are
distributed separately for bars above and below the reference line
(first plot), or regardless of orientation of the bars (second plot).
gsnAboveYRefLineBarPatterns controls the
patterns of the bars above the reference line. This is an array. The
patterns will
repeat. gsnBelowYRefLineBarPatterns
controls the patterns below the reference line.
gsnXYBarChartPatterns2 will apply the
patterns regardless of the orientation of the bars.
There are several patterns to choose
from.
 unique_5.ncl
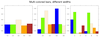
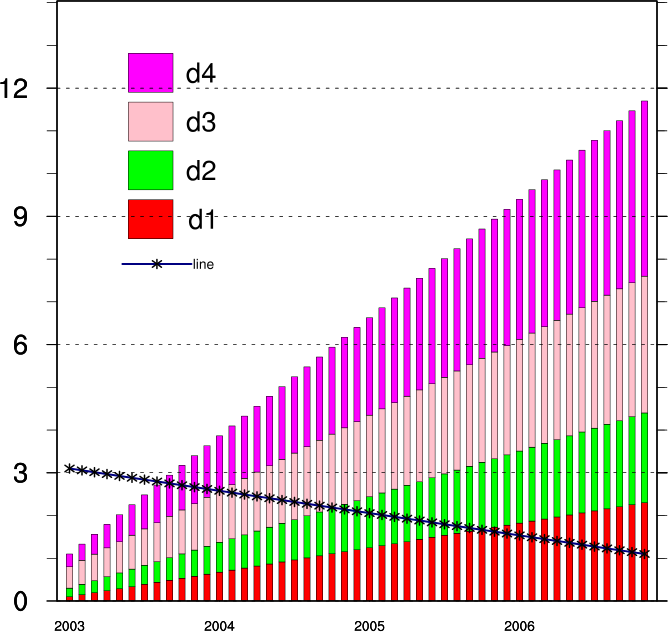
:
This script creates a single bar chart showing 4 different timeseries
with four different colors. The labelbar is created by using
gsn_labelbar_ndc. A Python version of this projection is available
here.
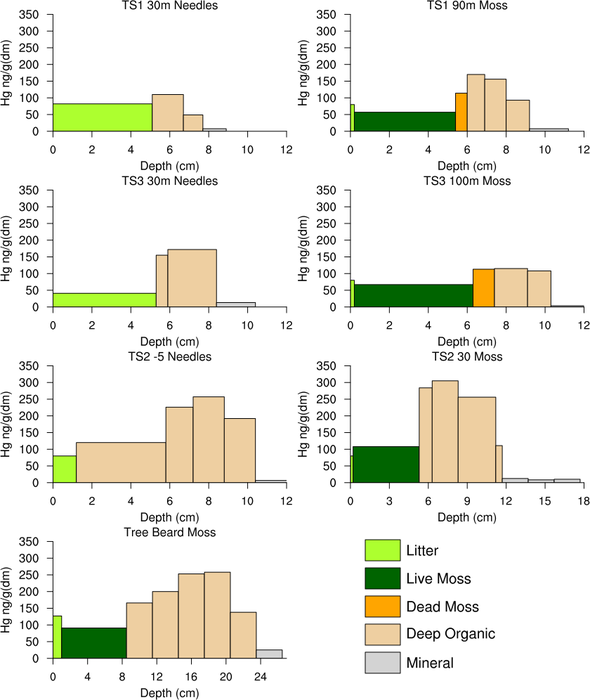
 polyg_10.ncl
:
This example shows how to draw various polylines and polygons on a
several generic tickmark backgrounds to create a series of bar
charts. The
gsn_add_polyline and
gsn_add_polygon functions are used
to create the polylines and polygons and
gsn_panel is used to panel all the plots on
one frame.
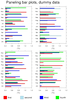
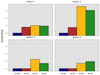
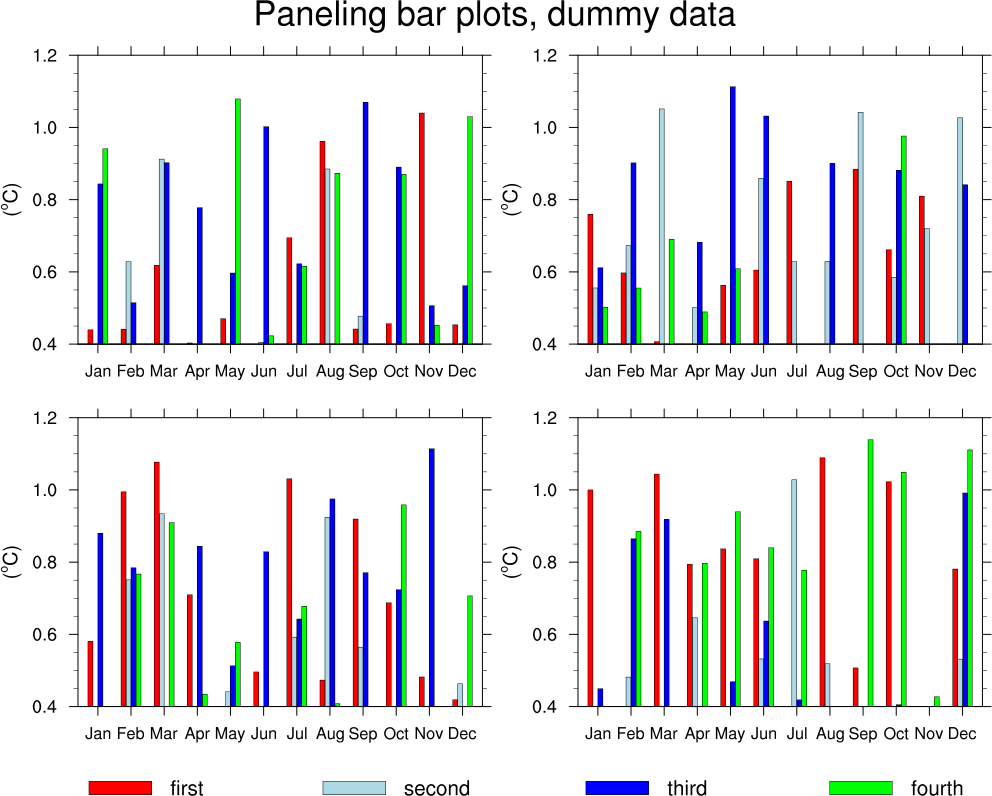
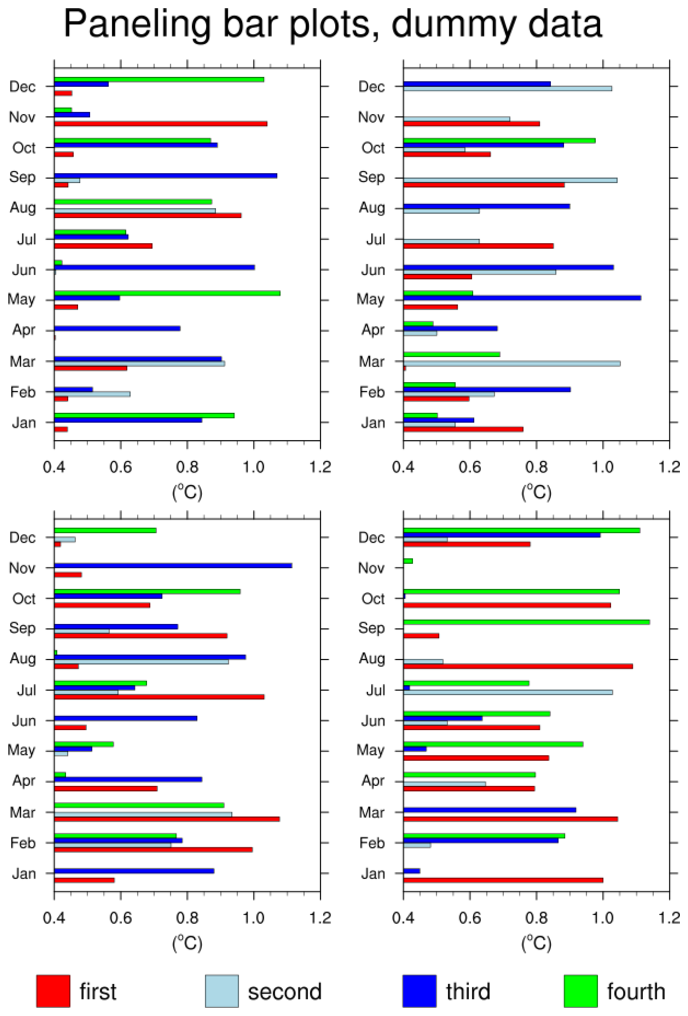
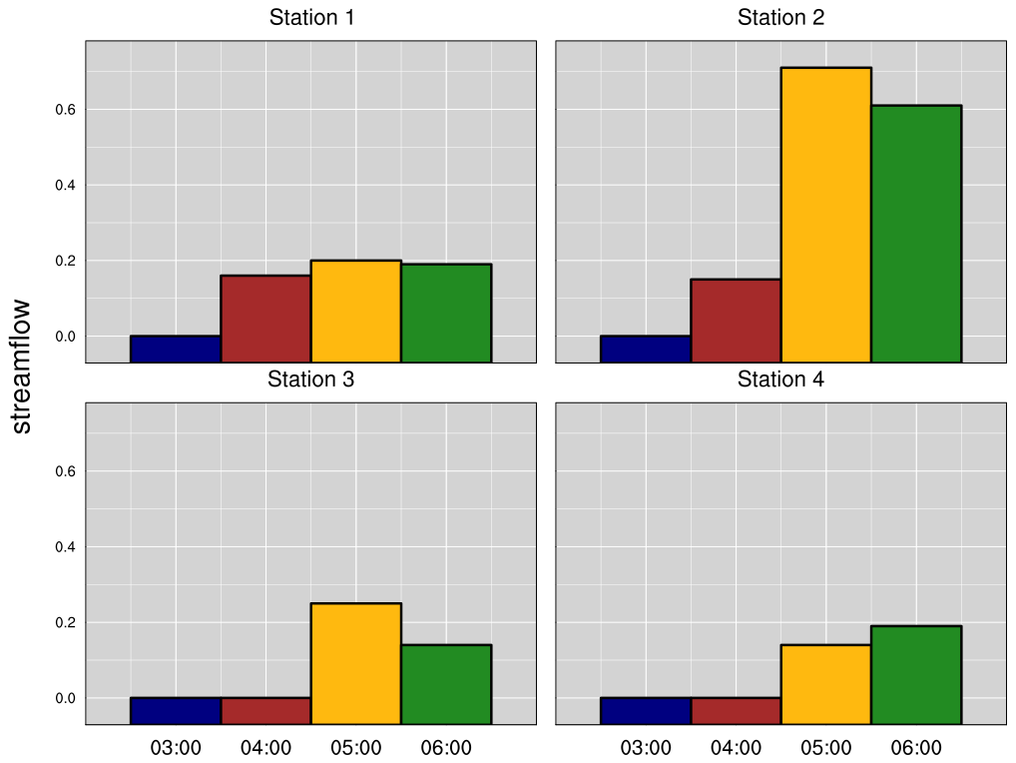
 bar_11.ncl
: This script shows how to
panel multiple bar charts and add a custom legend (using labelbars).
This example is similar to example 9 above, except it uses the
overlay procedure to overlay the individual bar
plots. Finally, it uses gsn_panel to
panel the four sets of plots. A Python version of this projection is available here.
 bar_horz_11.ncl
:
This example is similar to bar_11.ncl, except it shows how to draw the bars horizontally.
Note that the legend is drawn a little differently because it's a narrower plot.
This capability is only available in NCL version 6.4.0 or later.
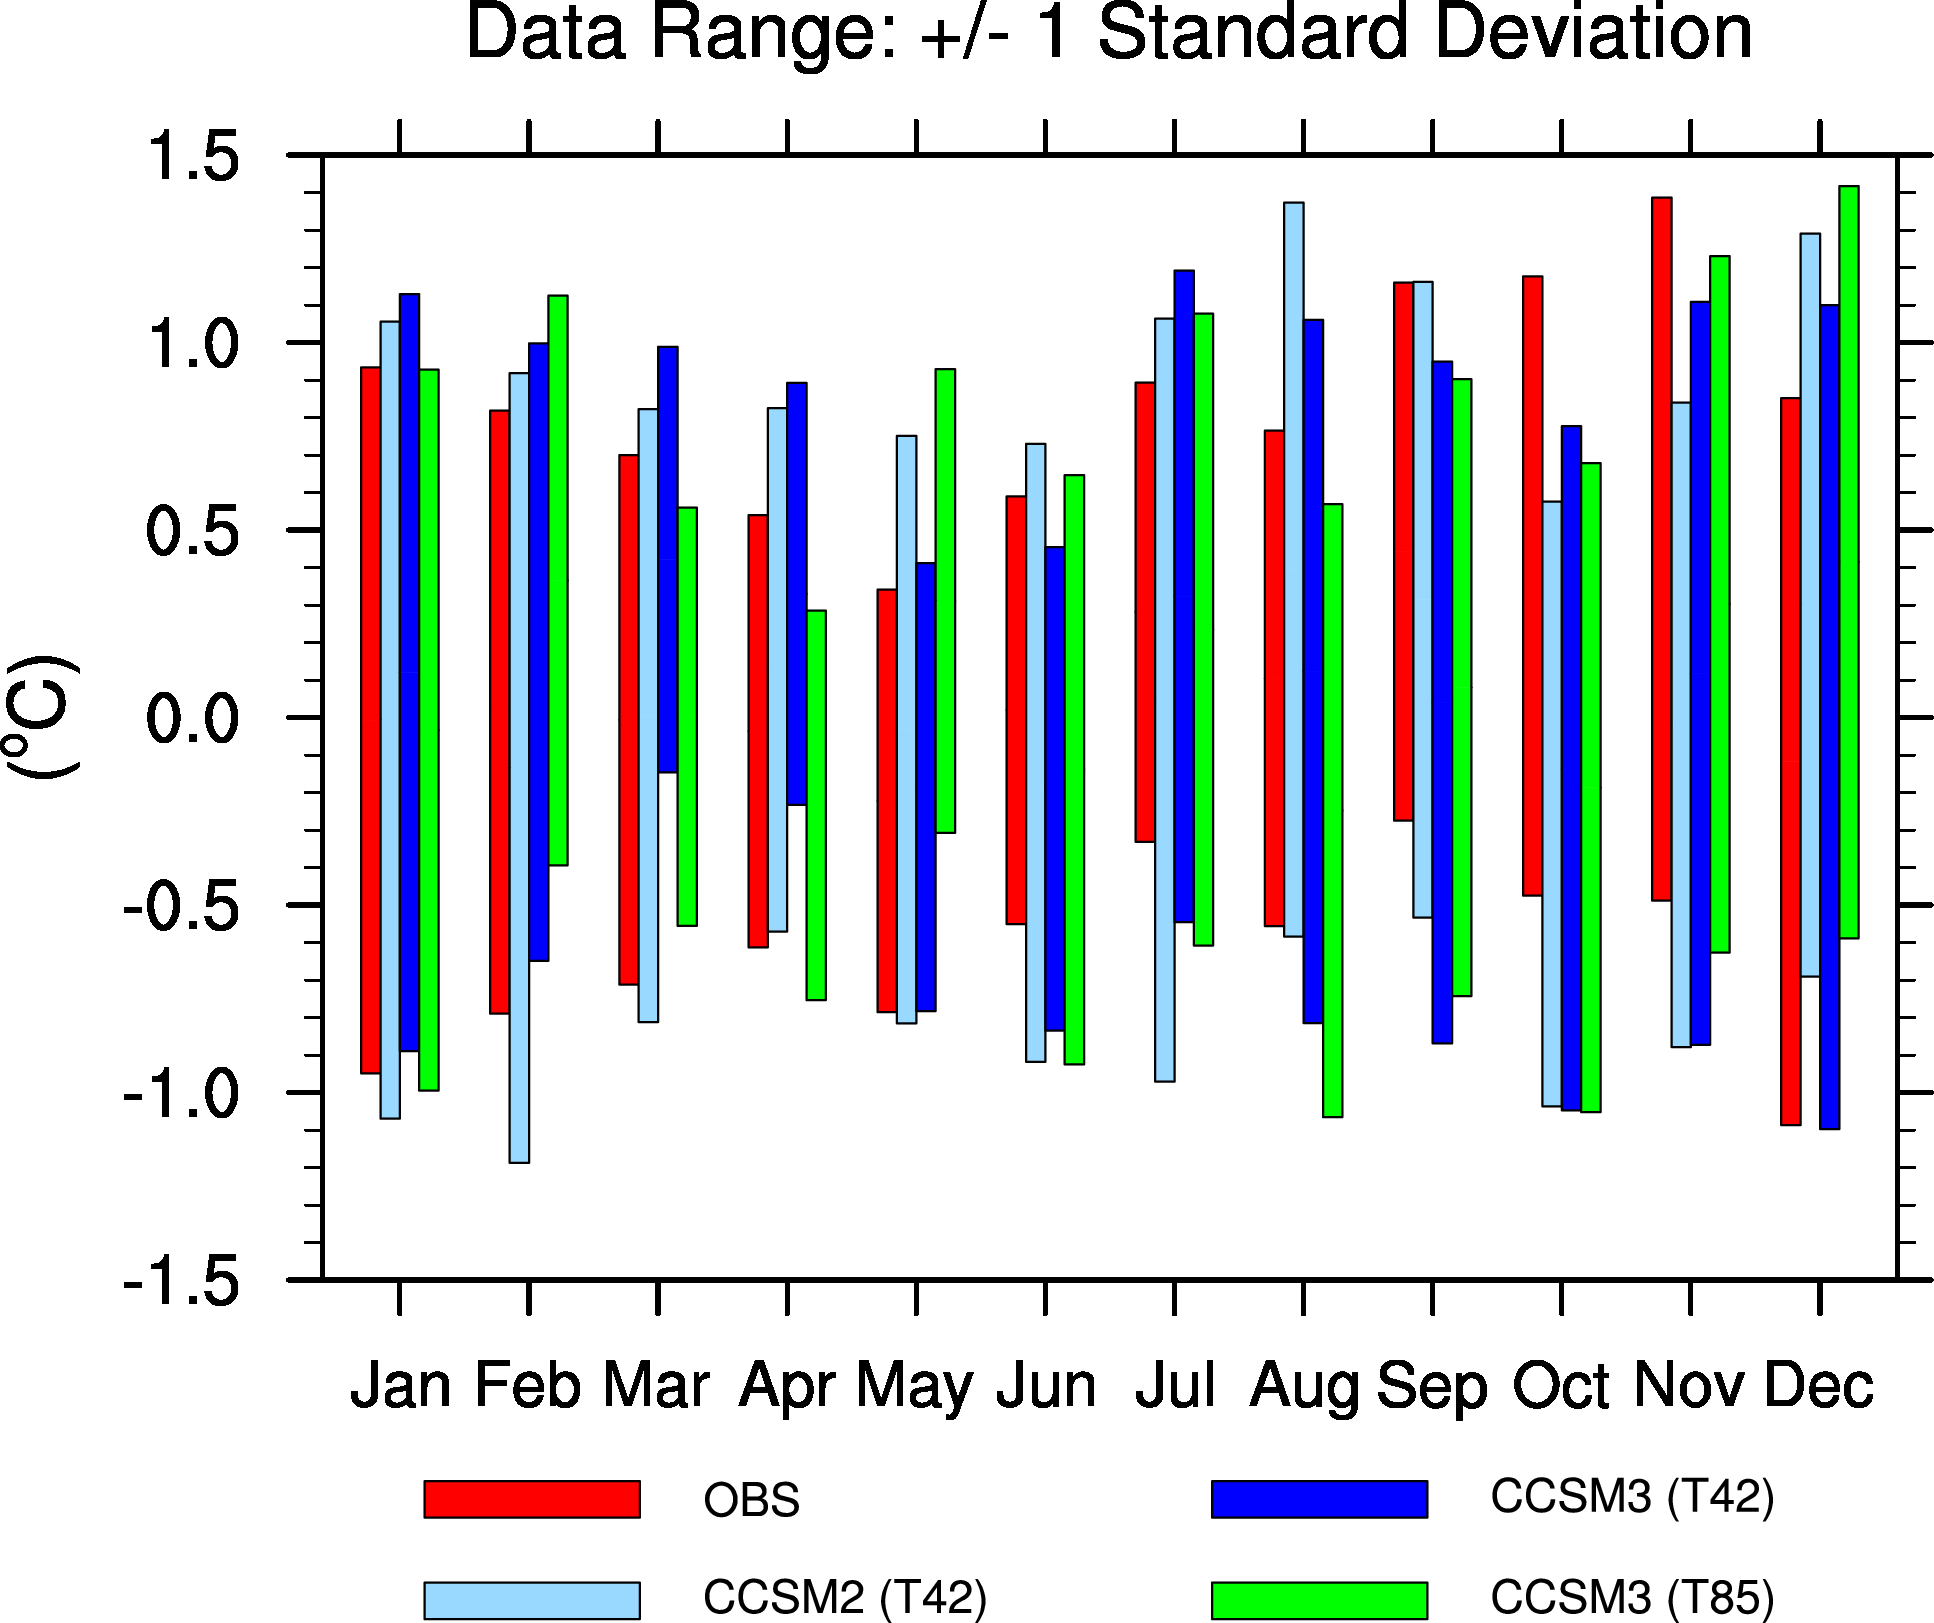
 bar_12.ncl
: This script shows how to
create four sets of "floating" bars given a set of minimum and maximum values
for each set of bars.
The trick is to draw the plot twice with the same bar color,
first with the minimum values, and then with the maximum values. Each set of
bars has its own
gsnYRefLine value.
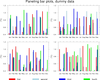
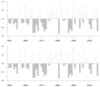
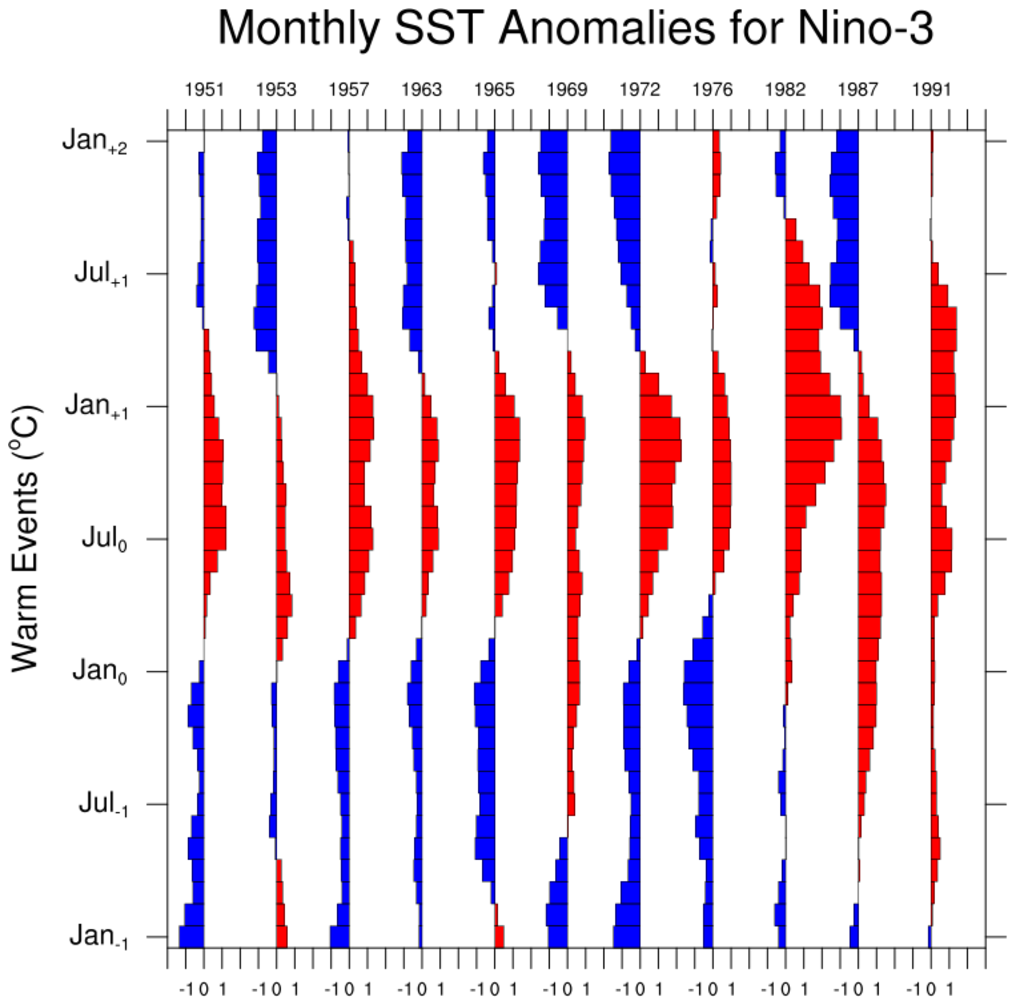
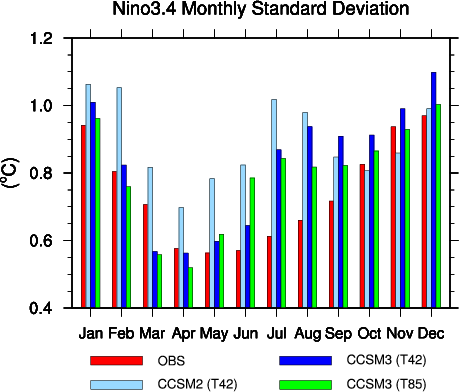
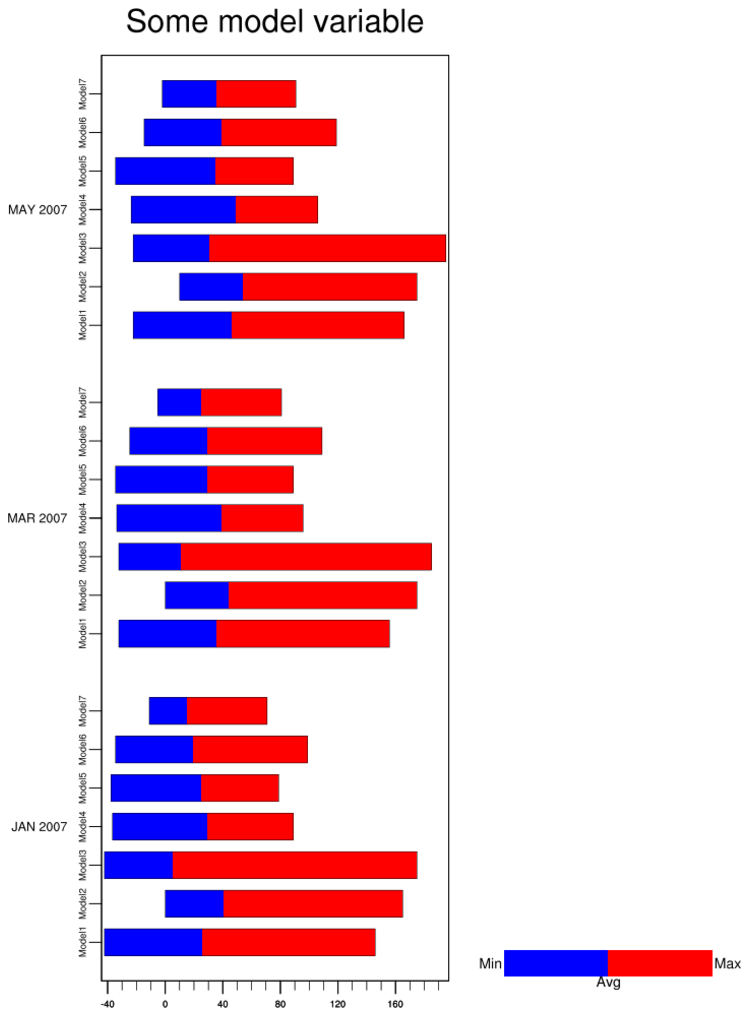
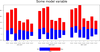 bar_13.ncl
: This script shows
a variation on creating "floating" bars, grouping each set of
bars by a single month.
The data are read in from
a dummy data file that
contains min, max, and average values for seven different models.
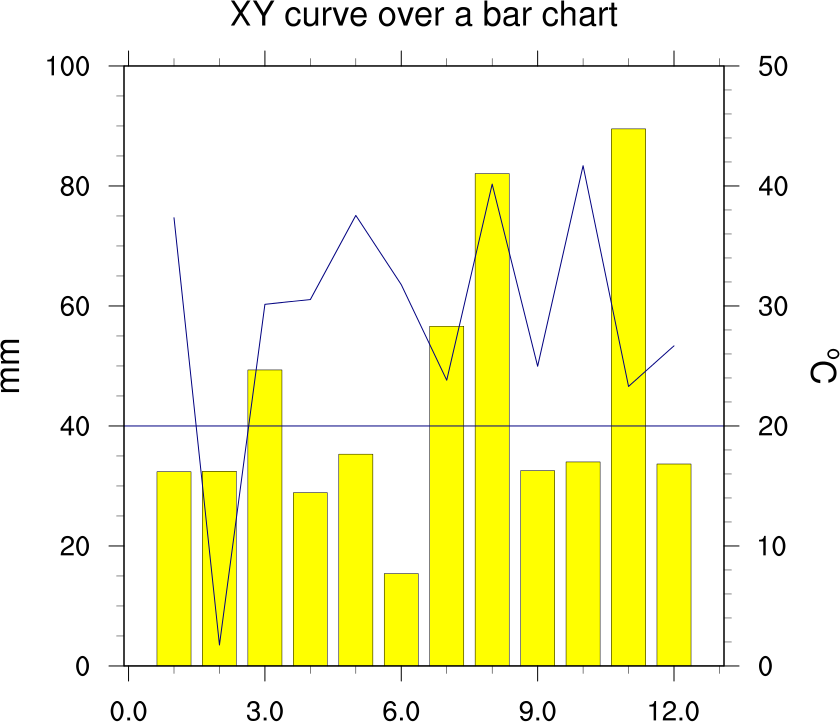
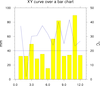 bar_14.ncl
: This script shows
how to draw an XY curve on top of a bar chart.
Two separate plots are created, and then they are drawn
in the same space by making sure the
vpXF,
vpYF,
vpWidthF, and
vpHeightF resources
are the same for both.
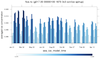
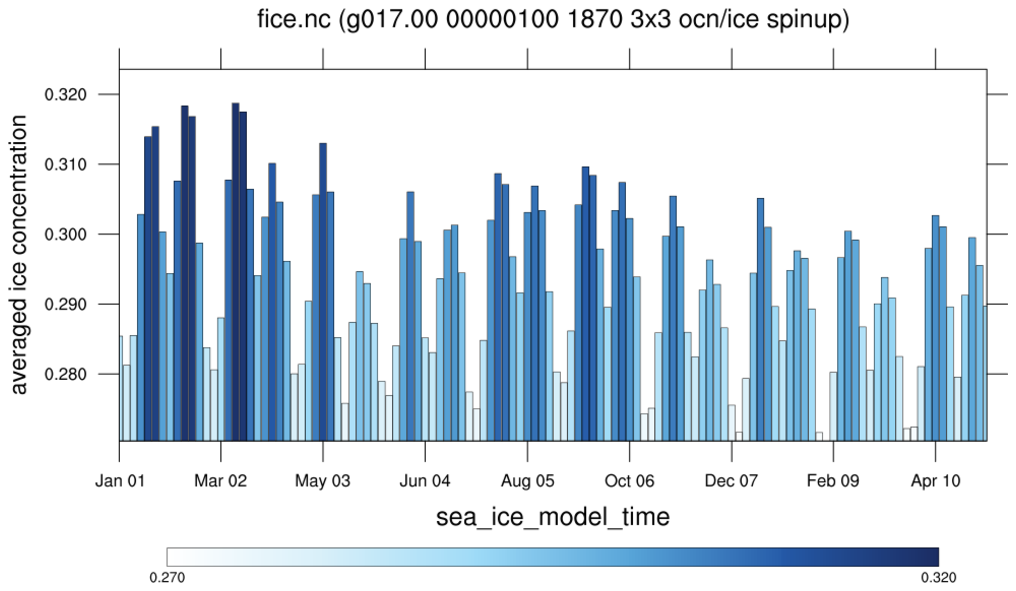
 bar_15.ncl
: This script shows
how to draw a bar chart with the bars colored according to ranges of
values. The first frame colors the bars
using
gsnXYBarChartColors2. The second
frame colors the bars using calls
to
gsn_add_polygon. This allows the
top of the bars to follow the shape of the XY curve, instead of being
flat.
time_axis_labels is used
add nicely-formatted time labels to the X axis.
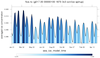
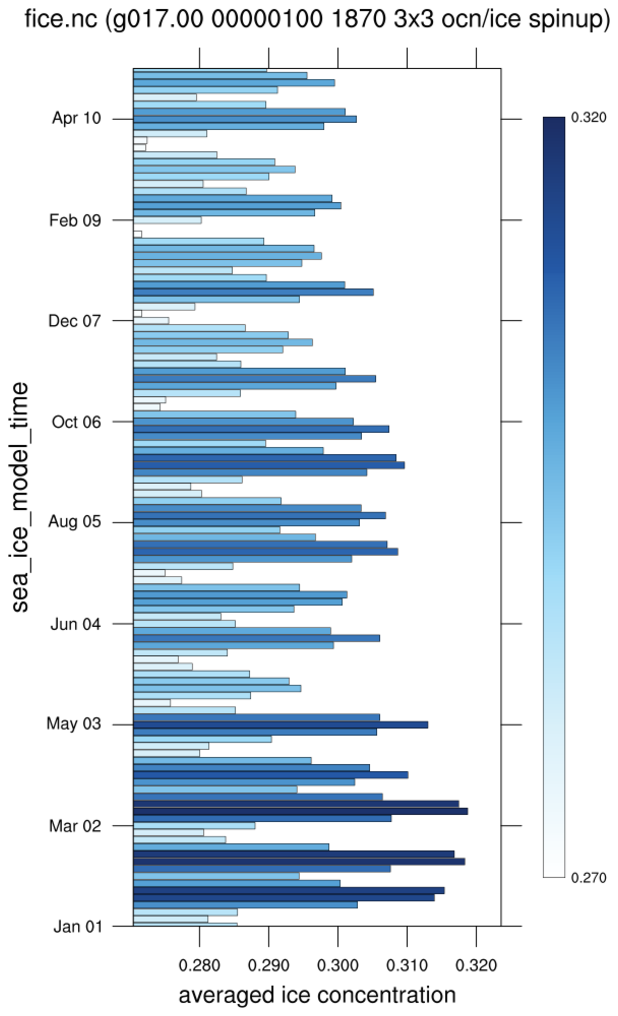
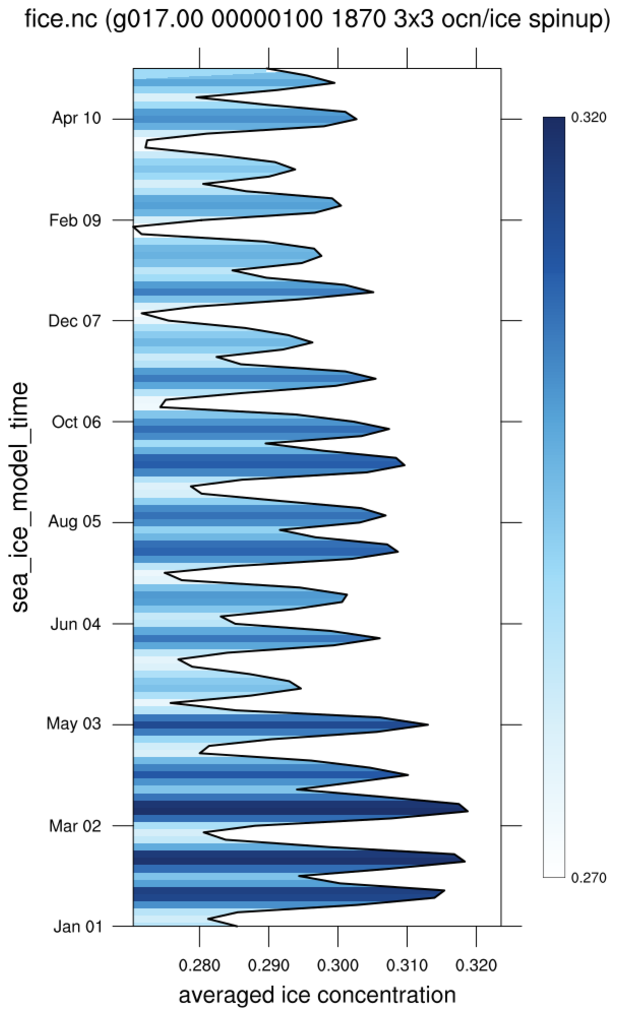
 bar_horz_15.ncl
:
This example is similar to bar_15.ncl, except it shows how to draw the bars horizontally.
You need to set gsnXRefLine to the minimum value of fice_avg,
which signals to gsn_csm_xy that this is a horizontal bar plot and not a vertical one.
This capability is only available in NCL version 6.4.0 or later.
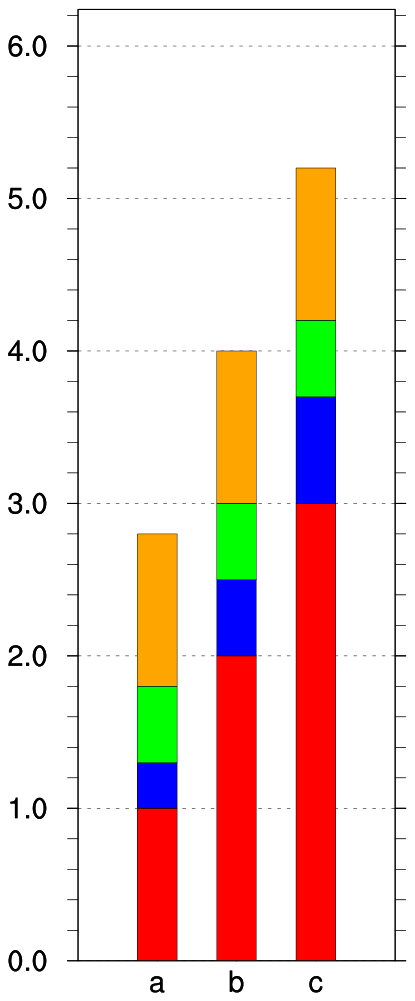
 bar_16.ncl
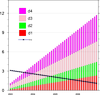
: This script shows
how to draw a basic stacked bar chart, similar to that in MS Excel.
It uses dummy data, so you can run it as-is. The script was
contributed by Rashed Mahmood at CIIT Islamabad.
 bar_17.ncl
: This
script shows how to customize a bar chart, using
calls to
to
gsn_add_polygon
and
gsn_add_polyline.
In this case, the bars are filled in one color to the right of an
X reference line, and a different color to the left.
You can customize the colors, line thicknesses, etc, by modifying
the code in the "customize_bar_chart" procedure in this script.
 bar_horz_17.ncl
:
This example is similar to bar_17.ncl, except it shows how to draw the
bars horizontally.
In this case, the bars are filled in one color above a
Y reference line, and a different color below.
This capability is only available in NCL version 6.4.0 or later.
 bar_18.ncl
: This script shows
how to draw a stacked bar chart with labelbars.
It uses dummy data, so you can run it as-is. The script was
contributed by Rashed Mahmood at CIIT Islamabad.
 bar_19.ncl
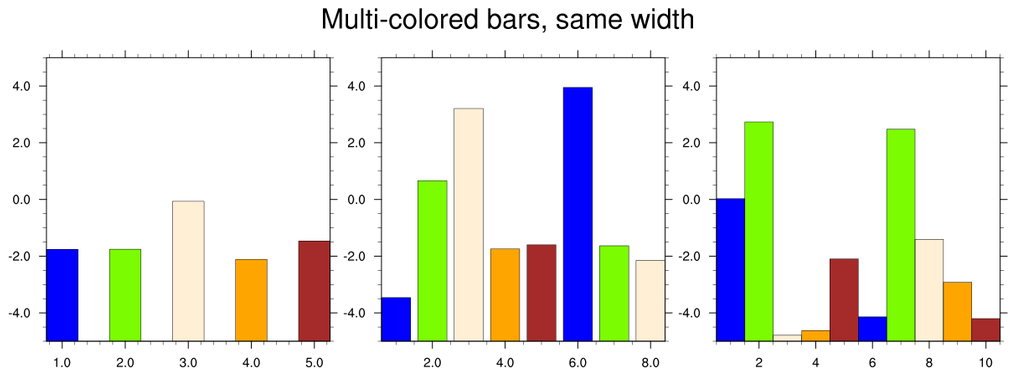
: This script shows
how to force the bars in a series of plots to be the same width.
By default, the width of the bars is based on the width of the plot divided by
the number of bars. This means if one plot has 10 bars and another plot has
5 bars, and the plots are the same width, then the bars in the 10-bar plot
will be half the width of the bars in the 5-bar plot. To force the bars
to be the same width, you need to scale the larger bars using
the gsnXYBarChartBarWidth resource.


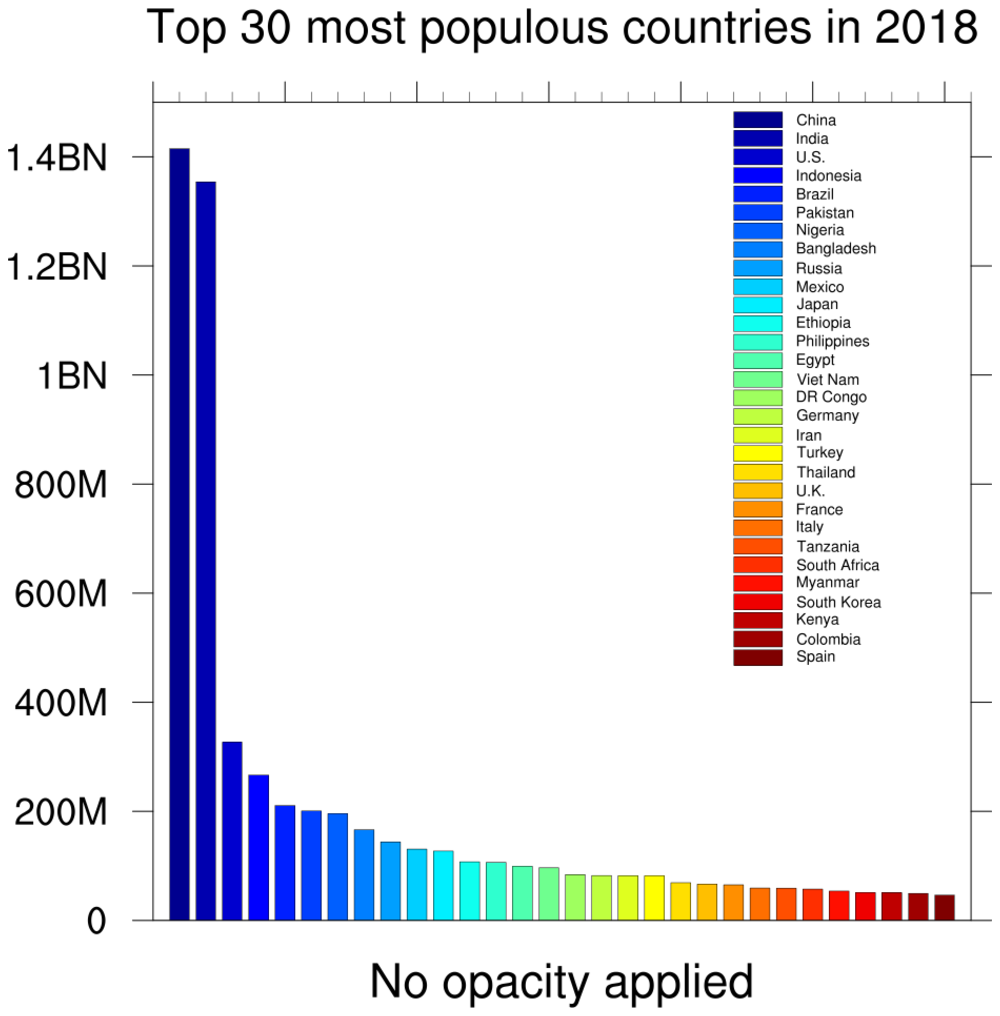
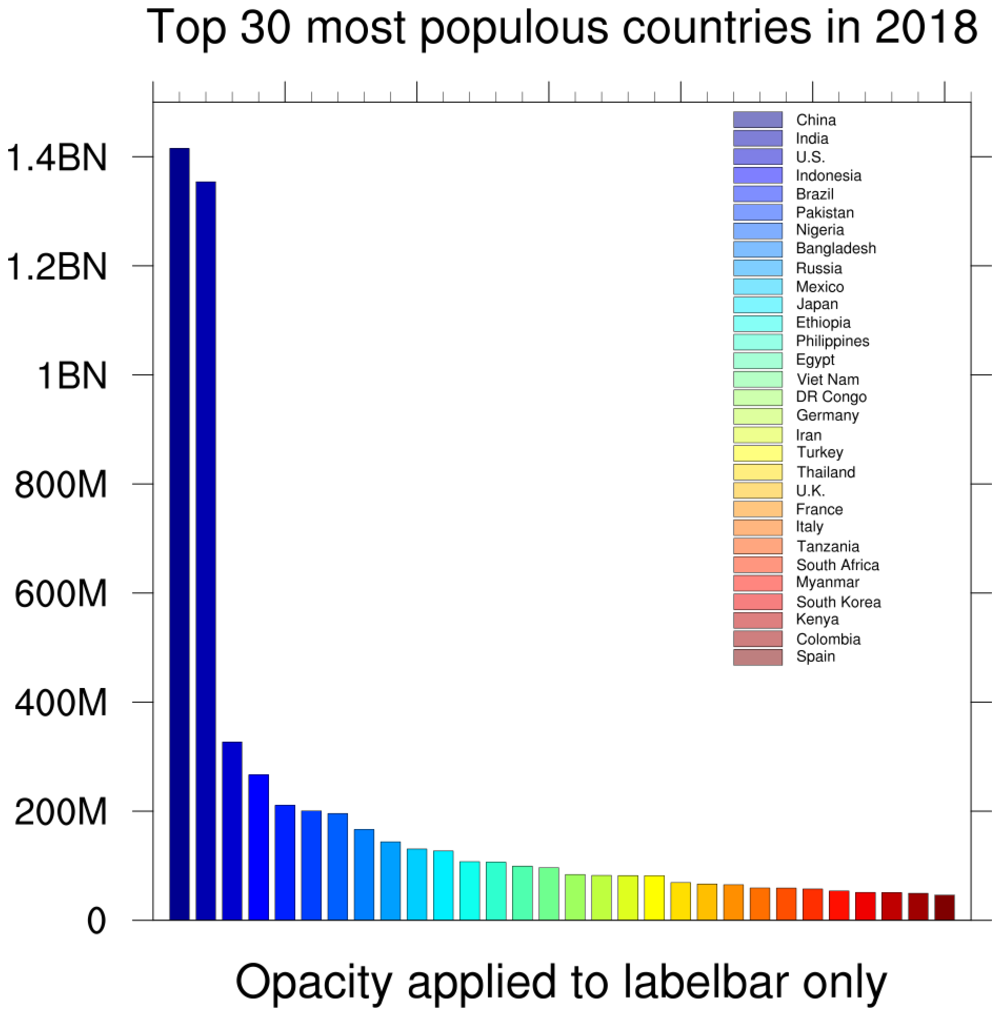
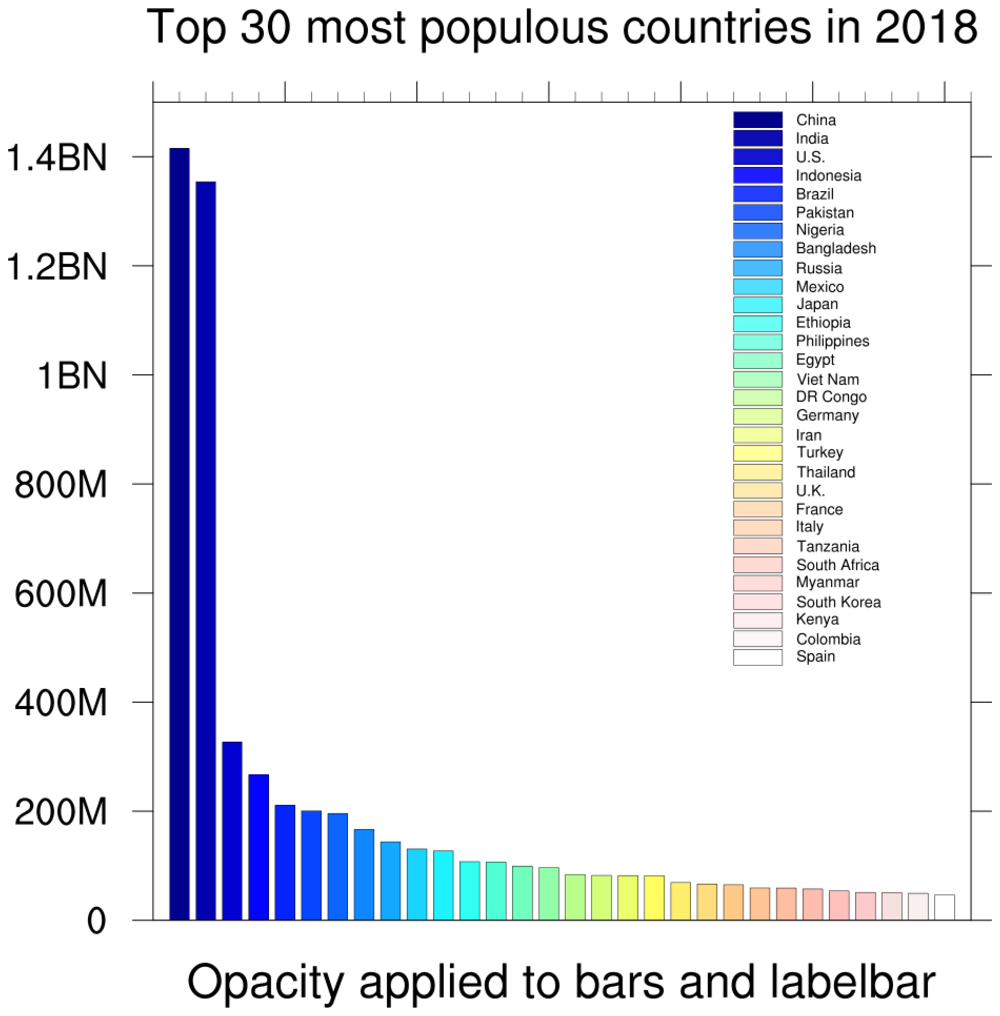
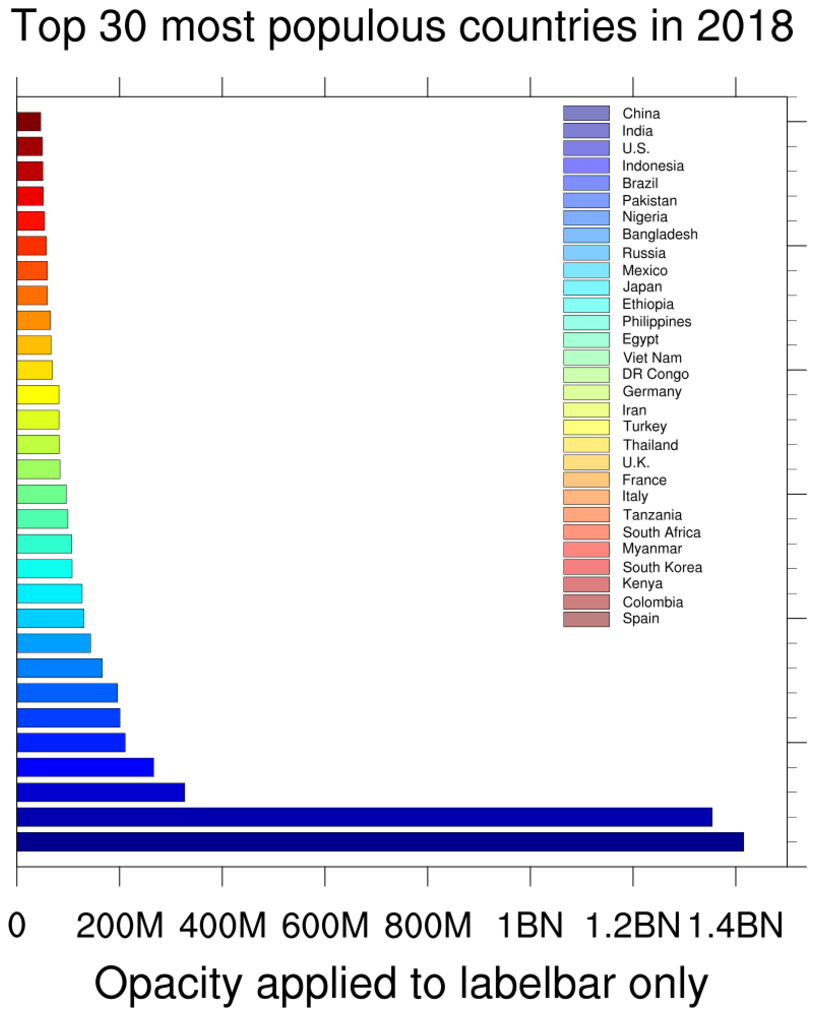
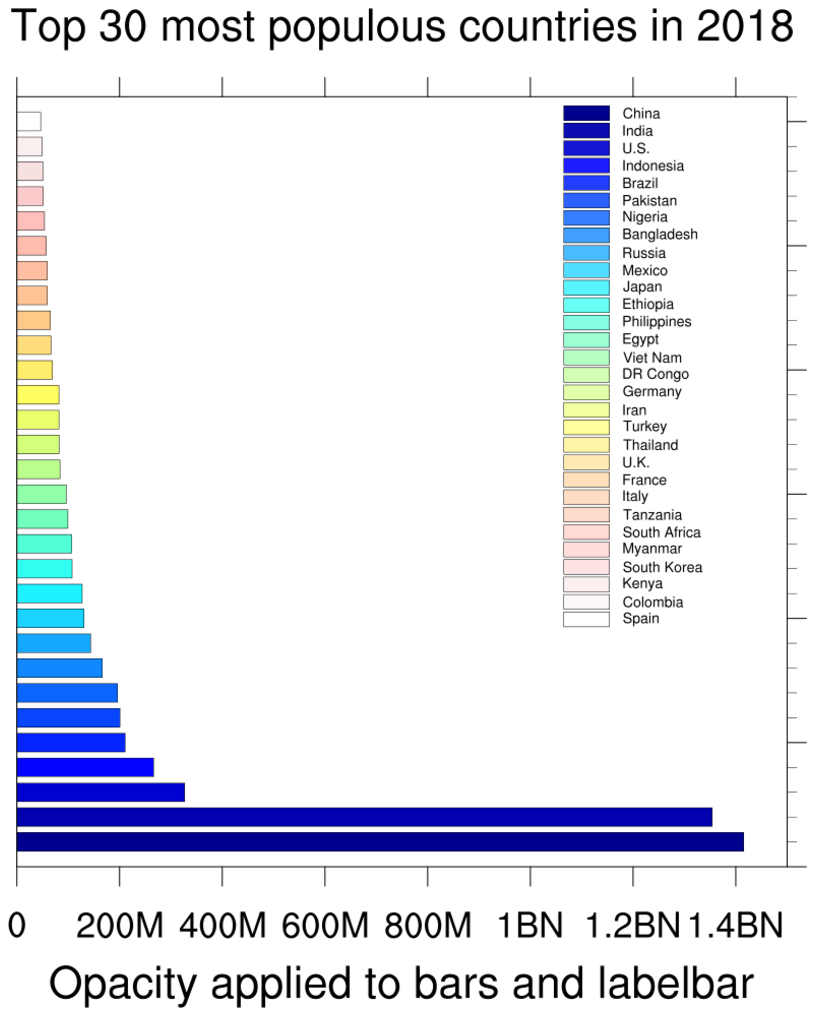
 lb_22.ncl
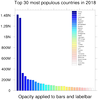
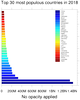
:
This example shows how to apply different opacities to a bar plot
and a custom labelbar.
The first frame is the plot without any opacity. The second frame has
the opacities applied to both the filled bars and labelbar, using
an RGBA array of colors with the opacity index (index 3) set to
a range of opacities.
The third frame uses a resource introduced in NCL V6.4.0,
lbFillOpacityF, that allows you to
set a single opacity value for a labelbar. This resource is primarily
meant to be used when creating a custom labelbar, and not with
a labelbar associated with a filled contour or vector plot. As of NCL
V6.4.0, any opacity applied to a contour or vector plot via resources
like
cnFillOpacityF
or vcGlyphOpacityF will have the
same opacity applied to the labelbar.
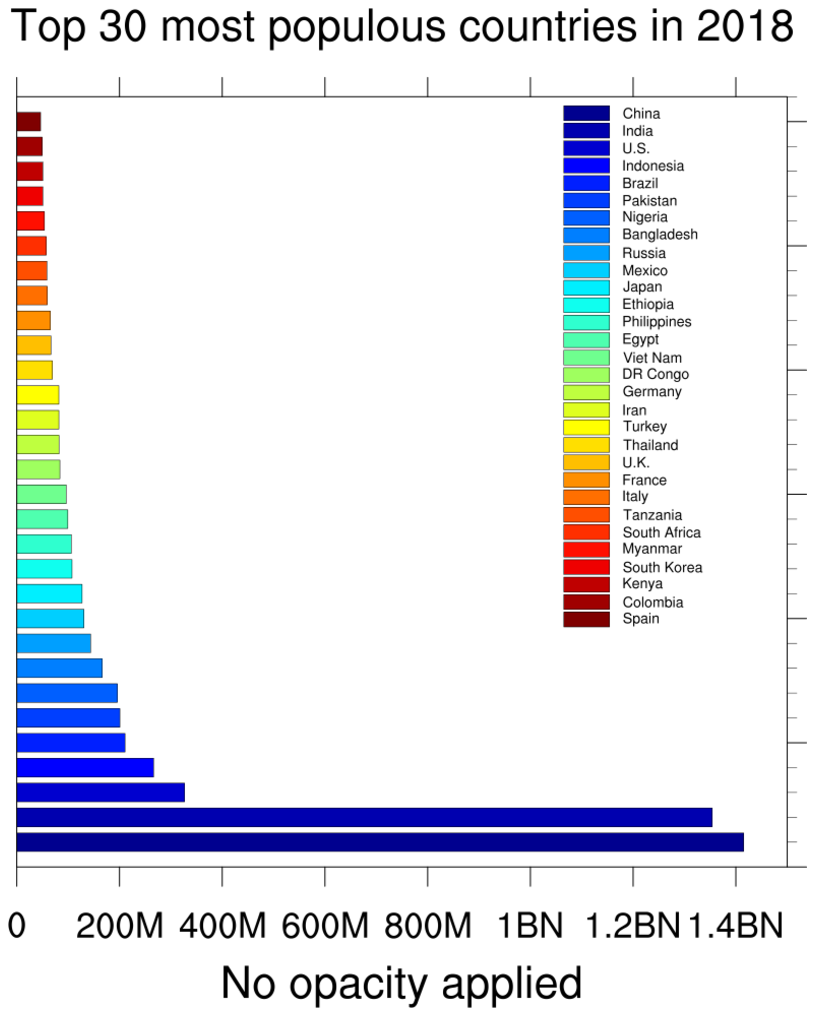
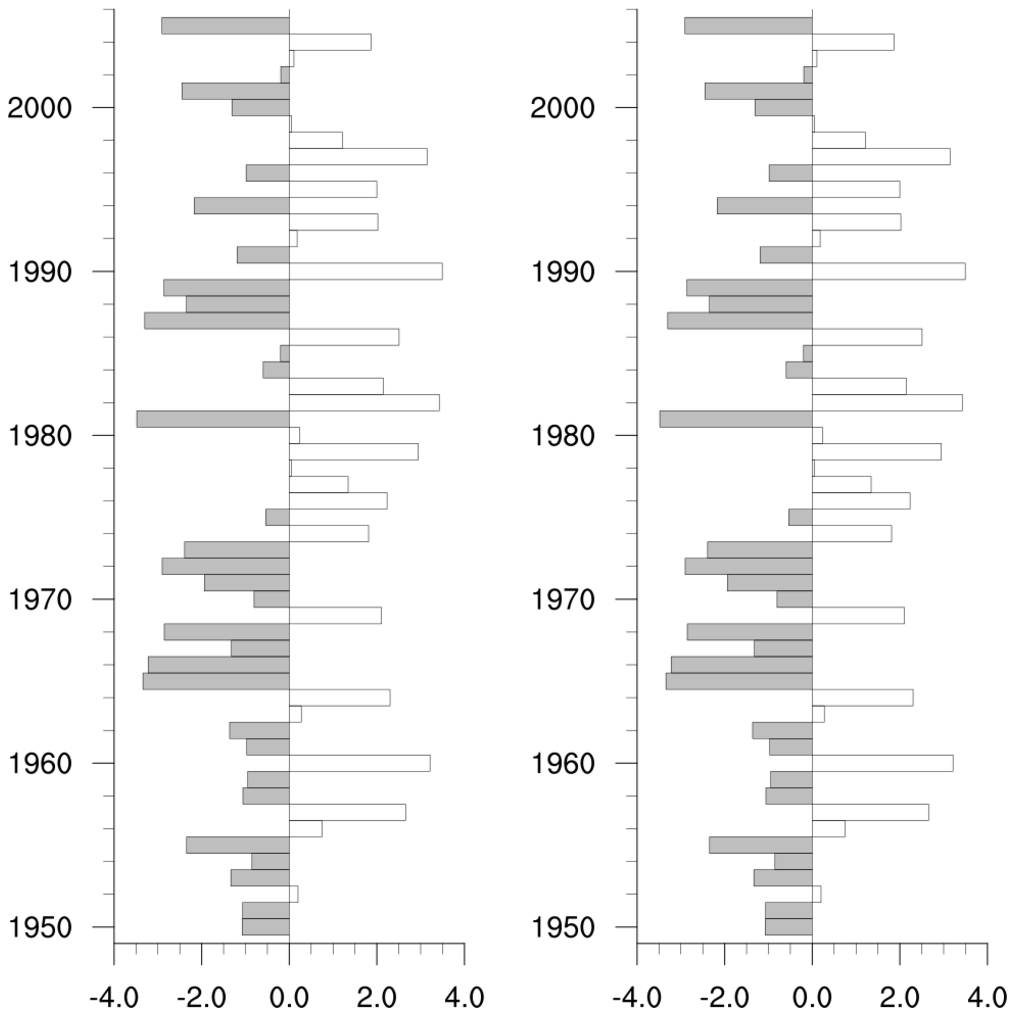
 lb_horz_22.ncl
:
This example is similar to lb_22.ncl, except it shows how to draw the
bars horizontally.
This capability is only available in NCL version 6.4.0 or later.
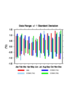
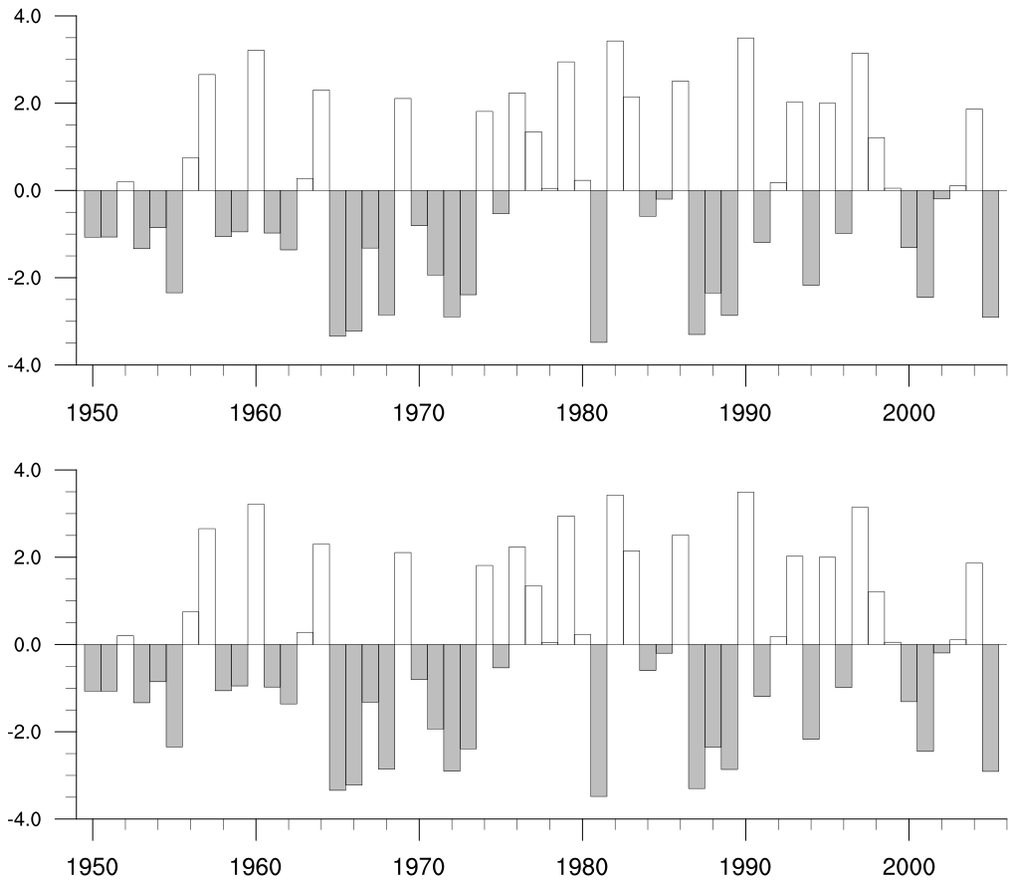
 tm_3.ncl
:
Shows how to remove axis borders, tick marks, and tick mark labels. Demonstrates how
to adjust the font height of tick mark labels.
(Top Panel) By setting tmYROn to False and tmYRBorderOn to False,
the right Y-axis is completely turned off. (The right Y-axis and top X-axis labels are by default turned off.)
The same is done to the top X-axis, using tmXTOn and
tmXTBorderOn.
(Bottom Panel) tmXBLabelFontHeightF is used to set the bottom X-axis tick mark label
font size, and tmYLLabelsOn is used to remove the left Y-axis tick mark labels.
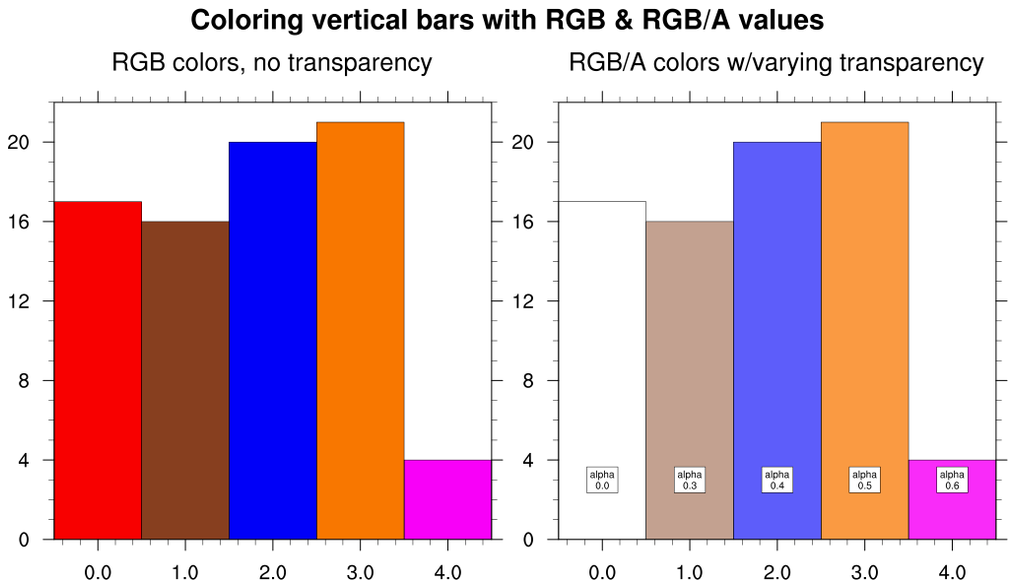
 bar_20.ncl
: This script shows how to
fill bars using RGB or RGB/A arrays with
the
gsnXYBarChartColors resource, a
feature added in NCL V6.4.0.
The second plot additionally adds text strings to each
bar showing the "alpha" value used.
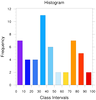
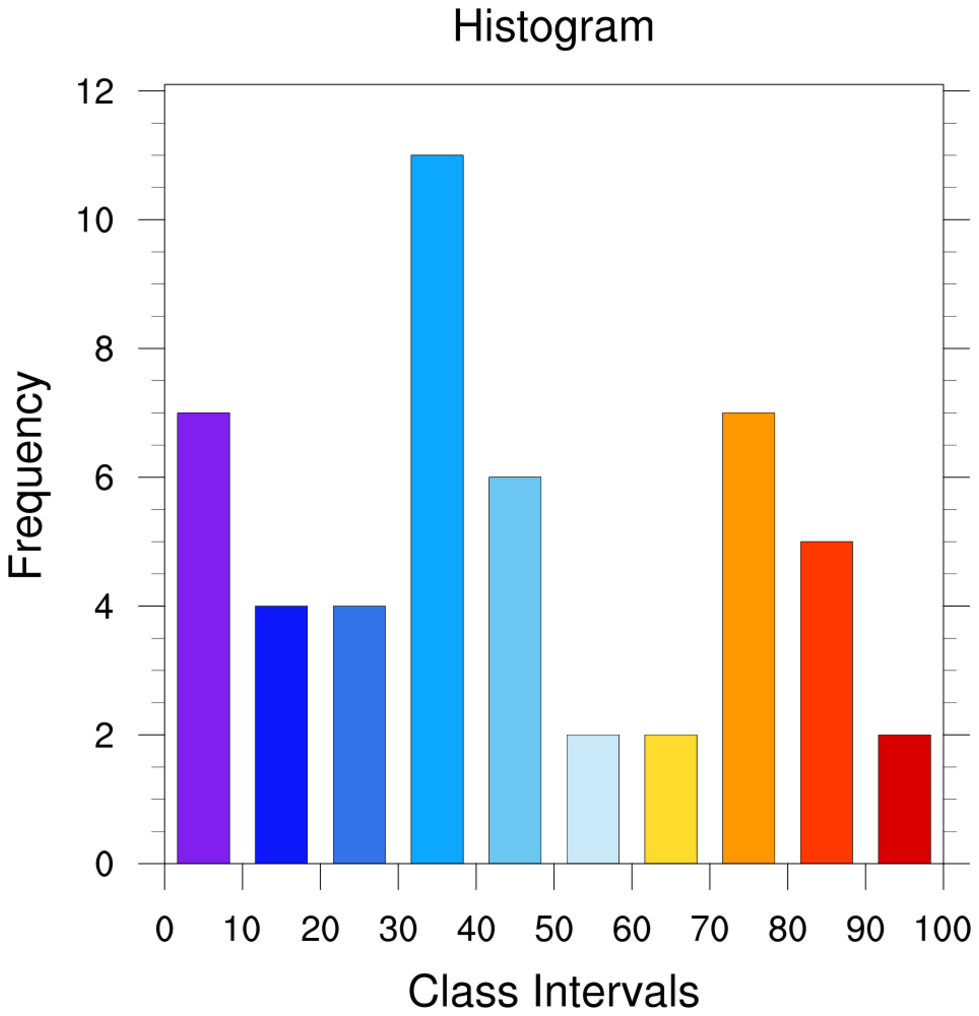
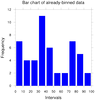 bar_21.ncl
: This script shows how to
create a bar chart of already binned data. Just for illustrative purposes,
we first create a histogram of random 1D data using
gsn_histogram. This plotting
function returns the binned data as an attribute called "NumInBins".
You can use this to create a bar chart that looks similar to the histogram.
The gsnXYBarChartBarWidth resource is used
to make the bars slightly smaller than the default width.
 bar_22.ncl
: This script shows how to
create a more customized bar plot that has a gray filled background,
white grid lines, and thicker bar outlines. This plot uses the same
data and looks similar
to
scatter_13.ncl on the scatter
plot page.
In order to get the bars on top of the gray
background, gsn_csm_blank_plot is
used to create canvases for the
background, gsn_csm_xy is used to
create the bar plots, and overlay is used to
overlay each XY bar plot on the gray canvas.
A *lot* of tickmark resources are set to customize the labels, grid
lines, and sizes.


