NCL Frequently Asked Questions (FAQ)
Basics | NCL core language | File input/output | Data handling | Data analysis | Visualization | Array functions | Graphical output | Error messages and other issues | Memory issues | Documentation | Miscellaneous |Basics
- Where can I download NCL?
- I'm having problems downloading NCL from the ESG website.
- How do I set up my environment to run NCL?
- How do I run NCL?
- How do I determine the version of NCL?
- Are there any email lists I can join?
- Where can I see some examples of how to use NCL?
- Are there any NCL command line options I can use?
- Are there any editor enhancements for editing NCL scripts?
- If I'm running NCL interactively, are there any command-line shortcuts I can use?
- If I'm running interactively, how can I load some existing NCL code?
- Is there anyway I can turn off the preceding "(n)" output when I print a bunch of values?
- My NCL script is quitting suddenly, and I'm not sure where and/or why.
- How do I tell if I have an OPeNDAP-enabled NCL?
NCL core language
- How do I comment a line in NCL? Is there a way to have a block of comments?
- Is there a continuation character in NCL?
- How do I easily convert a number to a string?
- How do I create a new variable that doesn't contain a _FillValue attribute?
- How do I create a double, long, short, or byte variable without using "new" or one of the conversion routines, like "integertobyte"?
- How do I include the double quote (") character in an NCL string?
- Can NCL prompt for user input?
- Is it possible to have global variables in NCL?
- How can I delete multiple NCL variables with one statement?
- How do I delete a named dimension?
- Is there a way to see the loaded variables and their dimensions in NCL similar to "whos" in matlab?
- I'm getting an unexpected value when I use the power ('^') operator combined with a negative value.
- How do I create a list of string integers with leading zeros ("008", "009", "010", etc)?
- How do I get the current date into NCL as a string?
- How do I get a list of files into an array of strings in NCL?
- How can I recursively get a list of files in a directory tree into NCL?
- How do I concatenate strings and values in NCL?
- How do I retrieve an environment variable in NCL?
- How do I print nicely formatted, multiple columns of data in NCL?
- Can multiple variables be returned from a user created function?
File input/output
- What's the easiest way to convert a GRIB1, GRIB2, HDF 4, or HDF-EOS 2 file to a NetCDF file?
- How do I dump the contents of a GRIB, HDF, or HDF-EOS file (or variable on the file) to the screen?
- How do I convert a large file to a NetCDF file?
- How do I write a large (> 2 GB) variable to a netCDF file?
- How do I get the latest tables for reading GRIB files?
- Why have some of my GRIB2 variable names changed since I updated to NCL V5.2.0?
- How do I write a scalar to a NetCDF file?
- How do I retain metadata for a variable that was read off a series of files using "addfiles"?
- How do I access an NCL file variable, attributes, or coordinate arrays if they have hyphens/dashes ('-') in the name?
- How do I read/write NetCDF, HDF4, HDF-EOS2, GRIB1, GRIB2, or CCM History Tape files?
- How do I read/write ASCII files?
- How do I read CSV files?
- How do I write a formatted ASCII file?
- How do I read an ASCII file if I don't know how many lines it contains?
- How do I read an ASCII file that contains delimiters?
- How do I read/write binary files?
- Once I've opened a file with "addfile", how do I find out what variables and attributes it contains?
- Is there a way to control whether my binary file is read or written as little endian or big endian?
- I'm having trouble reading a Fortran binary file with records.
- I'm trying to convert a file to a NetCDF file using "ncl_convert2nc", but getting an error message about violating format constraints.
- Why do I get different results when reading my HDF-EOS2 file, depending on whether I use the ".hdf" or ".hdfeos" extension?
- Can I read shapefiles using NCL?
- How can I get at vgroup data on my HDF4 file?
- When I run my script, I'm getting an error message "ncclose: ncid 0: NetCDF: Not a valid ID".
- When I try to access the Climate Diagnostics Center [CDC] OPeNDAP server via NCL, I get "Permission denied".
- I'm running into a problem when opening lots of files with addfile or addfiles ("Too many files open").
Data handling
- How do I set a missing value for my data?
- How do I determine if my data contains any missing values, or count how many missing values it has?
- How do I change the missing value to another value?
- How do I deal with NaN (not-a-number) values in my data?
- How do I deal with "Inf" (infinity) values in my data?
Data analysis
- How do I average values in a multi-dimensioned array?
- How can I do an element-wise minimum/maximum between two arrays of the same size?
- How do I interpolate my 2-dimensional random data to a 2-dimensional gridded array?
- How do I interpolate my 3-dimensional random data to a 3-dimensional gridded array?
- How can I figure out if a particular latitude/longitude point is within a specific area, like Europe?
Visualization
- How can I create an "editable" graphics file required for journal publication?
- How can I maximize the size of a plot in the frame?
- How do I get multiple plots on a page?
- What's a good way to generate a color map (table)?
- My map projection doesn't look right.
- How do I change all of my fonts to be the same in my visualization?
- How can I change the text function code to something other than a colon?
- How can I get a degree symbol in a text string?
- How can I get things like accents or umlauts over my text?
- How can I get special characters, like Greek symbols, in my graphical text strings?
- Can I use real PostScript fonts in my PostScript file?
- I'm having trouble importing a PS file into an application like Adobe Illustrator.
- How can I get the length of my axes to be the same ratio as the range of my axes?
- How do I change the aspect ratio or size of my map or plot?
- Can I set color resources by color name rather than color index values?
- How can I speed up the drawing of filled contours in NCL?
- Can I change color index values or color maps in mid-frame?
- How do I get my PostScript/PDF output to cover most of an 8-1/2" x 11" page?
- How can I control the size and location of the X11 window that NCL brings up?
- How do I tell NCL to ignore missing values in my plot?
- How can I get more labels on my contour lines?
- My X or Y axis values are not linear. How can I change this?
- How do I get log scaling on either of my plot axes?
- How do I fill my contour levels with various shading patterns and/or solid colors?
- How do I overlay a contour plot (or a vector/streamline plot) on a map?
- How do I force the tickmarks to point inward?
- I'm trying to control the tickmarks on the top or right axis, and nothing is happening.
- How can I improve the resolution of my map outlines?
- When I draw a map using the high-resolution map database, I seem to randomly get different resolutions.
- How can I get more geographical outlines in my map, like the provinces of China?
- If I am creating a color contour or vector plot, how do I select my colors such that they are spread across my whole color map?
- How do I generate a wire-frame surface or isosurface plot in NCL?
- How do I draw weather symbols (wind barbs, weather front lines, high and low pressure indicators, arrows, dots, weather icons, cloud symbols, lightning bolts, etc.) on a map?
- How can I have a new line as part of a graphical text string in NCL?
- How come I get different line thicknesses on different output devices using the same thickness value?
- How can I put a timestamp on my plot?
- Why am I not getting the color I expect when I reference a named color?
- Why is my land not being filled in the color I expect?
- How do I set up my NCL script so that it uses a resource file?
- How can I move and resize my labelbar and/or legend?
- How can I set the precision of the label bar labels?
- How can I generate some "nice" 2D random data for a contour and/or vector plot?
Array functions
- How do I get the dimensions of an array?
- How do I create unique random subscripts?
- How do I eliminate missing values from a one-dimensional array?
- How do I generate a one-dimensional array of equally-spaced integers or floating point numbers?
- How do I find or print the minimum/maximum values of my data array?
Graphical output
- How do I change the default NCGM/PostScript/PDF file name to something else?
- How do I convert my NCL graphics file to another format, like PNG, to put on the web or in a presentation?
- How do I remove all the white space from an image?
- Is there a way to make the PostScript files generated by NCL smaller?
- Can I produce a PNG image directly from NCL?
- Is there a way to remove the ".000001." from the PNG filename?
- How can I tilt an NCL graphic?
- How can I convert a series of PS or EPS files to an animation?
- How can I produce Google Earth kmz files?
- How do I convert my multi-frame NCL graphics file to an MPEG movie file?
- How do I include an encapsulated PostScript file from NCL in a LaTex document?
Error messages and other issues
- When I send my NCL graphics to an X11 window, only a partial image is drawn.
- When I run my script, I'm getting a "fatal:NclMalloc Failed" error message.
- When I run NCL, I get an error message about being unable to load the "System Resource File".
- When I run NCL, I get an error message about the X driver, like "error opening display".
- What's the deal with the error message "error: line -1 before or near..."?
- How can I redirect NCL's error messages to another file?
- How can I turn off NCL warning messages?
- I'm trying to list some files, and getting an error "Argument list too long".
- When I try to run ncl, I get an error about "libgfortran.so.x" not being found.
- I'm trying to compile my NCAR Graphics program using the Intel or gfortran compiler, but getting some undefined references.
- When I run ncl version 5.2.0, I get an error "warning:ut_calendar: Invalid specification string."
- When I run ncl, I get an error about libpng not being current.
- I'm getting an error from WRAPIT about being unable to find "-lgfortran".
- I'm getting a strange "workspace reallocation" error message.
- I am trying to create a contour plot and getting an error about the scalar field being constant.
- I am trying to create a contour plot and getting errors about sfXArray and sfYArray having an incorrect dimension size.
- I'm getting a warning, "ContourPlotSetValues: Data values out of range of levels set by EXPLICITLEVELS mode".
- I'm getting an "ARSCAM/ARPRAM ALGORITHM FAILURE" error message.
- I'm getting the error message "PLCHHQ - CHARACTER NUMBER 10 (w) IS NOT A LEGAL FUNCTION CODE".
- I'm getting the error "fatal:NhlCvtStringToEnum: Unable to convert string".
- I'm getting an error from the "shea_util.ncl" script about "copy_VarCoords" being an undefined procedure.
- When running a script with overlaid plots, I'm getting an error "cannot draw Plot Member".
- When I use NCL's systemfunc on a X/Cygwin system, I get the error "cannot create child process".
- When I compile an NCAR Graphics program, I get errors about undefined symbols like "_png_set_rows", "_png_destroy_write_struct", "_png_malloc", etc.
- When I use "ncargex" or "ncargf77", I get an error "cannot find -lpng".
- I'm trying to assign a value to an NCL variable, but getting a "right hand side can't be coerced to type of left hand side" error message.
- I'm calling NCL from a shell script and getting a fatal error on line -1.
- I'm getting an "MDRGSF/MDRGOF - ERROR OPENING RANGS/GSHHS CAT FILE" error message.
- I'm trying to draw primitives (markers, lines, polygons) on my plot, and getting an error essage "tfPolyDrawList element 0 is invalid".
- When I call one of the gsn_csm_xxxx_map plotting scripts, I get an error message about a units attribute not being correct.
- I'm trying to create a contour, vector, or contour plot, and getting a weird error about spline approximation.
- When I print something in NCL, I get an error about my PAGER environment variable.
Memory issues
- What's the biggest array that NCL can allocate?
- I'm running into a memory issue when I create lots of strings.
Documentation
- Is there a way I can download the NCL website documentation so I can access it locally on my machine?
- Where can I see a list of all the NCL resources?
- Where can I see a list of all the NCL functions and procedures?
- Where can I see a list of links to dash patterns, marker styles, color tables, etc?
Miscellaneous
- How should I cite NCL?
- How can I add a logo to an NCL plot?
- How do I call a C or Fortran function or procedure from NCL?
- How do I make sure that a C/Fortran routine I want to wrap doesn't conflict with a routine that might already be part of NCL?
- How do I fix buffering issues with NCL?
- If I obscure an NCL X11 window with another application, the X11 window doesn't refresh when I bring it back to the foreground.
Basics
- Where can I download NCL?
See the NCL download page for full instructions. You can download precompiled binaries for a specific UNIX system, or source code.
- I'm having problems downloading NCL from the ESG website.
Please see our ESG troubleshooting guide for help. If this doesn't help, then send email to the ncl-install email list.
- How do I set up my environment to run NCL?
- Set the NCARG_ROOT environment variable and your search path to
where NCL/NCARG resides
In order to use the software, you must set your NCARG_ROOT environment variable to the parent directory where the NCL executables and accompanying files were installed. You also need to make sure that the directory where the NCL/NCARG executables reside are on your search path. It is best to do this from one of your .* files in your home directory. If you are not sure which shell you are running, you can do an "ls -a" in your home directory to see what kind of files you have that start with ".", and then look in these files to see how environment variables are set.
In the example above, we would set these with the following:
From C-shell (csh):
    setenv NCARG_ROOT /usr/local
    setenv PATH=/usr/local/bin:$PATH
From bash or ksh:export NCARG_ROOT=/usr/local export PATH=/usr/local/bin:$PATHFrom sh:NCARG_ROOT=/usr/local PATH=/usr/local/bin:$PATH export NCARG_ROOT export PATHYou should now be set for using NCL and/or NCAR Graphics. If you have any problems, or questions about installing NCL from source code or binaries, please send email to ncl-install@ucar.edu (you need to subscribe first). - Set the DISPLAY environment variable to indicate where to display
graphics
This is not an NCL specific environment variable, but rather one that is used by any X11 Windows application that you run. For NCL or NCAR Graphics, it is needed when you display your graphics to an X11 window, or if you use ictrans, ctrans, or idt to view your NCGM files.
This variable must be set to the IP address or name of the machine you want to display your graphics on, for example "localhost:13.0" . If you are not running on a remote machine, then you can try setting it to ":0.0". Please contact your system administrator if you are not sure what to set it to.
For example, from C-shell (csh):
    setenv DISPLAY :0.0
    setenv DISPLAY 128.117.14.12:0
    setenv DISPLAY localhost:13.0
From bash:export DISPLAY=:0.0 export DISPLAY=128.117.14.12:0 export DISPLAY=localhost:13.0 - Put a ".hluresfile" file in your home directory
In order to better customize the NCL graphical environment, we highly recommend that you copy a .hluresfile to your home directory. You can customize this file to your liking, but at a minimum, you want to change the default font, the default color table, and the text function code.
- Special instructions if you have an
OPeNDAP-enabled version of NCL
[You don't need to worry about these instructions if you are not using OPenDAP.]
OPeNDAP-enabled binaries require some libraries to be installed on your host computer:
- Secure Sockets Layer (SSL) library
- OPeNDAP libraries
Once you have these libraries, you may be required to set the environment variable LD_LIBRARY_PATH (DYLD_LIBRARY_PATH for Macs) to contain the directory where they are located on your host system in order for OPeNDAP-enabled versions of NCL to work properly.
- Set the NCARG_ROOT environment variable and your search path to
where NCL/NCARG resides
- How do I run NCL?
Once you have NCL installed, you can run it interactively by typing on the UNIX command line:
ncl
This will echo some information to the screen, and give you a prompt:Copyright (C) 1995-2008 - All Rights Reserved University Corporation for Atmospheric Research NCAR Command Language Version 5.1.0 The use of this software is governed by a License Agreement. See http://www.ncl.ucar.edu/ for more details. ncl 0>
To quit out of interactive mode, type "quit" (without the double quotes).To run NCL on an existing NCL script called "myscript.ncl", type on the UNIX command line:
ncl myscript.ncl
- How do I determine the version of NCL?
The version number is echoed whenever you run NCL. You can also type "ncl -V" on the UNIX command line to get the version number.
- Are there any email lists I can join?
Yes. For basic questions about installing NCL and setting up your environment to use it:
http://mailman.ucar.edu/mailman/listinfo/ncl-install
For all other questions on NCL or NCAR Graphics:http://mailman.ucar.edu/mailman/listinfo/ncl-talk
- Where can I see some examples of how to use NCL?
To see hundreds of NCL application examples, see the category list of application pages. These examples are full NCL scripts that you can download. Some of the datasets are provided as a separate link.
If you are a complete beginner to NCL, then there's a tutorial with examples that are described line-by-line.
- Are there any NCL command line options I can use?
Yes, see the "NCL command line options" section in the NCL Reference Manual.
- Are there any editor enhancements for editing NCL scripts?
Yes, see the support page for a list.
- If I'm running NCL interactively, are there any command-line shortcuts I can use?
There are shortcuts that allow you to navigate through previous commands and edit them. For more information, go to the "
NCL Command Line Shortcuts" section in the NCL Reference Manual. - If I'm running interactively, how can I load some existing NCL code?
You can use the loadscript procedure, where you give it the name of the file that contains NCL commands.
- Is there anyway I can turn off the preceding "(n)" output when I print a bunch of values?
If you are using print to print some values, and you see output like this:
Variable: x
Type: float
Total Size: 80 bytes
            20 values
Number of Dimensions: 1
Dimensions and sizes:   [20]
Coordinates:
(0)      0
(1)     0.5263158
(2)     1.052632
(3)     1.578947
(4)     2.105263
(5)     2.631579
. . .
then you can get rid of the "(0)", "(1)", etc, by using the "-n" command line option when you invoke "ncl". Your output will then look like:Variable: x Type: float Total Size: 80 bytes 20 values Number of Dimensions: 1 Dimensions and sizes: [20] Coordinates: 0 0.5263158 1.052632 1.578947 2.105263 2.631579 . . .- My NCL script is quitting suddenly, and I'm not sure where and/or why.
If you are running an NCL script and getting a "bus error" or "segmentation fault" (which technically shouldn't happen, but does on occasion), then try commenting out your "begin" and "end" statement for the main code, and running your script with the "-x" command line option:
ncl -x your_script.ncl
This will cause every line of your script to be echoed to the screen, and you will be able to see where it is quitting suddenly.- How do I tell if I have an OPeNDAP-enabled NCL?
A quick way is to do an "ldd" or "otool -L" on the "ncl" executable to see if it references libraries like "libnc-dap.so" and "libdapclient.so". This will indicate your version of NCL was built with OPeNDAP capabilities enabled:
ldd `which ncl`
You should see output like:libnc-dap.so.3 => /usr/local/lib/libnc-dap.so.3 (0x0000002a95557000) libdap.so.6 => /usr/local/lib/libdap.so.6 (0x0000002a956ee000) libdapclient.so.1 => /usr/local/lib/libdapclient.so.1 (0x0000002a958b9000)
Here's short test to see if your OPeNDAP-enabled NCL is working. Note that you must be on a system that allows OPeNDAP access:url = "http://test.opendap.org/opendap/data/nc/" filename = "123.nc" exists = isfilepresent(url+filename) if(.not.exists) then print("OPeNDAP isfilepresent test unsuccessful.") print("Either you don't have the appropriate permissions to access OPeNDAP servers, or NCL does not have OPeNDAP capabilities on this system") status_exit(1) else print("OPeNDAP isfilepresent test successful.") f = addfile(url + filename,"r") vars = getfilevarnames(f) vars_out = (/"l","j","i","cross","aloan","shot","order","bears"/) sqsort(vars) sqsort(vars_out) print(vars) ; These two lists should print(vars_out) ; be the same. end if
- If I'm running interactively, how can I load some existing NCL code?
NCL core language
- How do I comment a line in NCL? Is there a way to have a block of comments?
The comment character in NCL is a semicolon (';'). You can use it on a line by itself or after an NCL command:
; Here is a comment before a command that assigns a variable.
  x = 5.

  x = 5.     ; This comment can be at the end of a line
Block comments are a new feature in NCL 6.4.0. Surround the lines to be commented out by/;and;/characters, as in:/; All this text is now part of a multi-line comment. ;/
Prior to NCL version 6.4.0, there unfortunately was no way to designate a block of comments, other than putting semicolons in front of all the lines:; ; This is a block of comments, ; each of which must be ; preceded by its own semicolon ;
- Is there a continuation character in NCL?
Yes, you can use the '\' character:
x = (/"This", "is", "a", "long", "array", "of", "strings", "that", \ "we", "can", "continue", "on", "a", "new", "line", "with", "a", \ "\", "character."/) ; Can use \ for arithmetic expressions output(i,1:n-2) = (p4)*(var( i-1, 1 : n-2 ) + var( i, 2 : n-1) + \ var( i+1, 1 : n-2 ) + var( i, 0 : n-3)) + \ (q4)*(var( i-1, 0 : n-3 ) + var( i-1, 2 : n-1) + \ var( i+1, 2 : n-1 ) + var( i+1, 0 : n-3)) - How do I easily convert a number to a string?
Use the '+' string concatenator:
  x   = 3.14
  str = "" + x
- How do I create a new variable that doesn't contain a _FillValue attribute?
x = new(5, float, "No_FillValue")
- How do I create a double, long, short, or byte variable without using "new" or one of the conversion routines, like "integertobyte"?
  x = 1.d      ; double, x = 1d   (also acceptable)
  l = 1l       ; long
  s = 5h       ; short
  b = 1b       ; byte
The long, short, and byte literals were added in V5.1.0. - How do I include the double quote (") character in an NCL string?
Since NCL uses double quotes to denote strings, you have to add an extra step to get them into a string. As of V5.1.1, we have a new function str_get_dq for retrieving the double quote character:
  quote = str_get_dq()
  print("The word " + quote + "string" + quote + " has double quotes around it.")
  print("'Single' quotes are no big deal.")
If you have an older version, you can do it this way:quote = inttochar(34) print("The word " + quote + "string" + quote + " has double quotes around it.") print("'Single' quotes are no big deal.")
- Can NCL prompt for user input?
No, not directly, but you can use NCL's systemfunc function or its command line option capability to do this.
"systemfunc" example
  print("Enter a Number")
  ans = toint(systemfunc("read ANS; echo $ANS"))
  print("Number * 10 = "+(ans*10))
Command line argument examples
A more involved way is to write a shell script that queries for input values. You can then use the NCL command line argument capability to pass these values as arguments on the NCL command line.
Shell script example to prompt for a float and a string
- Create a shell script called "input.sh":
#!/bin/sh

echo -n "Enter a floating point value: "
read x
echo -n "Enter a title (no quotes): "
read title

eval ncl x=$x \'title=\"$title\"\' your_script.ncl
- Create an NCL script called "your_script.ncl" that references "x"
and "title":
;---You can provide a default value for "x" and "title" instead of exiting. if(.not.isvar("x").or..not.isvar("title")) then print("No value provided for 'x' and or 'title'. Exiting") exit end if print("x = " + x) print("title = '" + title + "'") y = x * 100. print("y = x*100 = " + y) - Make sure "input.sh" is executable, and run it:
  chmod 775 input.sh
  ./input.sh
This should prompt you for a value and a title and then print some information.
C-Shell script example to prompt for a filename and a level value
- Create a c-shell script called "input.csh":
#!/bin/csh -f

echo -n "Input filename: "
set fname = $<

echo -n "Input level value: "
set level = $<

eval ncl level=$level 'fname=\""$fname"\"' your_script.ncl
- Create an NCL script called "your_script.ncl" that references
"fname" and "level":
  if(.not.isvar("fname")) then
    fname = "myfile.nc"        ; Set a default
  end if

 if(.not.isvar("level")) then
    level = 850.             ; Set a default
  end if

  print("filename = '" + fname + "'")
  print("level = " + level)

;---Do some more stuff in your NCL script...
  a = addfile(fname,"r")
  T = a->T({level},:,:)     ; Read a 3D variable at a particular level.
- Make sure "input.csh" is executable, and run it:
  chmod 775 input.csh
  ./input.csh
This will prompt you for a filename and level value, and pass this information to the NCL script. This particular NCL script will assign these values to normal NCL variables, and then use them in the script as usual.
- Create a shell script called "input.sh":
- Is it possible to have global variables in NCL?
NCL does not have an explicit way of defining "global variables". However, NCL's scoping rules, which are similar to Pascal's, can be used to simulate "global variables" For more information, see the NCL reference manual, specifically, the NCL statement documentation.
In a nutshell, if you define a variable above a function, procedure, or the main code, you can reference it in that function, procedure, or main code:
PI = 3.14157 ; Use some naming convention for ; global variables [here, all caps] function area_circ(r:numeric) begin return(PI*(r^2)) end ; Main code begin print("PI = " + PI) radius = 1.5 area = area_circ(radius) print("area of a circle with radius " + radius + " = " + area) end - How can I delete multiple NCL variables with one statement?
In version 6.0.0 and later, you can delete multiple variables of mixed types and sizes by using the delete procedure and the special syntax "[/" and "/]" around the variables you want to delete:
  lat  = fspan(-90,90,64)
  lon  = fspan(-180,180,128)
  data = random_uniform(-10,10,(/10,20,30/))
  varnames = (/"T","P","U","V"/)    ; 1D string array
  . . .
  delete([/data,varnames,lat,lon/])

  print(lon(0))    ; This will produce an error that "lon" is undefined
This is currently in alpha-test mode. - How do I delete a named dimension?
Unfortunately, this is not possible. If we get a lot of requests for this capability, then we'll consider adding this functionality. You can set a named dimension to "", but this is not quite the same thing:
  x = (/1,2,3/)
  x!0 = "this"
  print(x)
  x!0 = ""
  print(x)
- Is there a way to see the loaded variables and their dimensions in NCL similar to "whos" in matlab?
See the list_vars procedure.
- I'm getting an unexpected value when I use the power ('^') operator combined with a negative value.
The negation operator ('-') has the highest precedence in an NCL expression, potentially producing unexpected results. For example, the following expression:
x = - 3^2yields a value of 9 because it behaves as:x = (-3)^2Note how the use of parentheses can change the results:print(- (3+2)^2) ----> yields 25whereas:print(- ((3+2)^2)) ----> yields -25Finally, if the '-' symbol appears between two expressions or numbers, then it is treated as a minus rather than negation. Hence, the following yields a value of 9:
x = 0 - 3^2 ; equivalent to x = (0) - (3^2) - How do I create a list of string integers with leading zeros ("008", "009", "010", etc)?
Use the sprinti function with a format like "%0.i" (the "%0" indicates to fill in the strings with leading zeros where possible). For example:
  ii  = ispan(0,100,1)
  iis = sprinti("%0.3i",ii)   ; "000", "001", ... "100"
- How do I get the current date into NCL as a string?
Use the systemfunc function, which executes a UNIX system call and returns the output as a string:
datestr = systemfunc("date") - How do I get a list of files into an array of strings in NCL?
Use the systemfunc function with the UNIX "ls" command:
filenames = systemfunc("ls *.txt") - How can I recursively get a list of files in a directory tree into NCL?
Use the systemfunc function with the UNIX "find" command:
filenames = systemfunc("find /home/haley/data -type f -print")If you are looking for a specific set of files, like ones that end in ".nc", use the "-name" option:filenames = systemfunc("find /home/haley/data -name '*.nc' -type f -print") - How do I concatenate strings and values in NCL?
You can use the "+" operator, which will automatically recognize when you are operating on strings. You can also concatenate strings with other NCL variable types, like float and integers. For example, the following NCL code snippet:
  month    = 1
  day      = 21
  year     = 2002
  date_str = "The date is " + month + "/" + day + "/" + year
will produce the string "The date is 1/21/2002".You can use the functions sprinti and sprintf to generate formatted strings. For example, if you want to construct filenames on the fly with names like "sw001.out", "sw002.out",..., "sw010.out", your code would look something like this:
do i=1,10 filename = "sw" + sprinti("%0.3i",i) + ".out" ...do something with filename... end do - How do I retrieve an environment variable in NCL?
Use the function getenv:
env_str = getenv("PATH") - How do I print nicely formatted, multiple columns of data in NCL?
There are several functions that will nicely format 2D arrays using a user-specified format string. The original procedure was write_matrix. This can write to either a text file or to standard out. It is limited to one variable of the same type. It use fortran style format syntax. Two new procedures were introduced in NCL version 6.1.0: print_table and write_table. These can handle variables of mixed type. Please see the documentation and examples for these procedures.
Here's an example on how to use write_matrix:
  N    = 5
  M    = 7
  ave  = 0.0
  std  = 5.0
  x    = random_normal(ave, std, (/N,M/))

  write_matrix(x, "5f7.2", False)
This example will produce the following output:4.35 4.39 0.27 -3.35 -6.90 4.36 4.66 3.77 -1.66 4.06 9.73 -5.84 0.89 8.46 10.39 4.91 4.59 -3.09 7.55 4.56 1.77 3.68 5.08 0.14 -5.63 -0.63 -14.12 -2.51 1.76 -1.43 -4.29 0.07 5.85 0.87 8.65
A more complicated method is to write a C or Fortran subroutine to print the data as you want it, and then use wrapit77 as described in the section "using the wrapit77 application" in the NCL Reference Manual. There's an example on 2-dimensional array printing in the WRAPIT guide.The functions sprinti and sprintf can also be used to generate formatted output.
- Can multiple variables be returned from a user created function?
Yes. However, it not as direct as (say) Matlab. In NCL, the return argument must be of type list. This can contain variables of different types and sizes.
A schematic example:

    undef("foo")
    function foo(...)
    begin
      :
      :
      x = ..   ; type float    (:,:)
      y = ..   ; type double   (:,:,:,:)
      z = ..   ; type string   (1)  a scalar
      i = ..   ; type integer  (:)

      return( [/ x, y, z, i ] )  ; return as variable of type list
    end

    ans = foo(...)

    printVarSummary(ans)          ; variable of type list

    x   = ans[0]                  ; explicitly extract each return variable
    y   = ans[1]                  ; [..] syntax is for variable of type list
    z   = ans[2]
    i   = ans[3]
    delete(ans)

Note: There is no need to explicitly extract the list variables.
       They could be accessed as components of 'ans'


Please see the Mini-Language Manual:  Sections 2.18 and 5.7
Click "Support" at top of NCL home page ... Manuals
http://www.ncl.ucar.edu/Document/Manuals/language_man.pdf

Also: http://www.ncl.ucar.edu/Document/Manuals/Ref_Manual/NclVariables.shtml
File input/output
- What's the easiest way to convert a GRIB1, GRIB2, HDF 4, or HDF-EOS 2 file to a NetCDF file?
On the UNIX command line:
ncl_convert2nc your_file.xxx
where xxx is the file suffix, like "grb", "hdf", or "hdfeos" (other file extensions are recognized).If you need to write an NCL script to do the conversion, see the output netcdf applications page.
For more information on supported file formats in NCL, see the "Information on supported data formats" section in the NCL Reference Manual.
- How do I dump the contents of a GRIB, HDF, or HDF-EOS file (or variable on the file) to the screen?
Use ncl_filedump on the UNIX command line. Some examples:
  ncl_filedump ced1.lf00.t00z.ega.grb
  ncl_filedump -v PRES_6_SFC -ftime ced1.lf00.t00z.ega.grb
Type "ncl_filedump -h" for a usage message. - How do I convert a large file to a NetCDF file?
If you are using ncl_convert2nc to convert a supported file (like GRIB) to a NetCDF file, and getting the error message:
   ncendef: ncid 0: NetCDF: One or more variable sizes violate format
                            constraints
then try the "-L" option:
ncl_convert2nc U12345.grb -L - How do I write a large (> 2 GB) variable to a netCDF file?
In order to write large variables to a NetCDF file, you have to set the NetCDF "Format" option to "LargeFile" or to "NetCDF4Classic". This requires calling setfileoption and setting the "Format" using one of these three calls:
  setfileoption("nc","Format","LargeFile")

or

  setfileoption("nc","Format","NetCDF4Classic")

or

  setfileoption("nc","Format","NetCDF4")
The reason you have to set this option is that the NetCDF library requires that this decision be made when the file is first created, before there is any knowledge of the size of variables that will be written. We may eventually make this this default, but the current recommendation from Unidata is to maintain backwards compatibility where possible for apps that can only deal with the original small file format of NetCDF.This will make NCL create a NetCDF4 file, which has no limitation on variable size.
NOTE:
For any of the above three options to function properly, "setfileoption" must be called prior to addfile("filename.nc", "c").
- How do I get the latest tables for reading GRIB files?
GRIB1
You can use your own text-based tables that you can update yourself. Start with text-based tables that are downloadable from our website at http://www.ncl.ucar.edu/Document/Manuals/Ref_Manual/NclFormatSupport.shtml#GRIB1-built-in-parameter-tables.
Click on any of the built-in tables and you will find a link to a downloadable text-based version that you can use if you set NCL_GRIB_PTABLE_PATH appropriately. Also read the next section entitled "User-defined GRIB1 parameter tables".
GRIB2
Except for parameters in files created for the TIGGE project, GRIB2 parameters are all defined in text files contained in the grib2_codetables directory tree. By default this directory is found at $NCARG_ROOT/lib/ncarg/grib2_codetables. If you want to add parameters or modify the name, description, or units of any number of parameters, copy the complete directory tree to your own location, and then set the environment variable NIO_GRIB2_CODETABLES to the path of this location. The files that relate specifically to parameter tables can be found in the parallel subdirectories ecmwf/4/ and ncep/4. They have names of the form
4.2.*.*.table. Just be sure to maintain the format of these files when modifying or adding to them. Basically each line contains 5 fields separated by colons. The parameter number is repeated:param number:param number:description (long_name attribute):units:short name (must not contain spaces or non-alphanumeric characters)
Example:0:0:Temperature:K:TMP
- Why have some of my GRIB2 variable names changed since I updated to NCL V5.2.0?
If necessary, you can change them back the way they were by setting the environment variable NIO_GRIB2_CODETABLES to the path: $NCARG_ROOT/lib/ncarg/grib2_codetables.previous. See the release notes for 5.2.0 GRIB Updates for an explanation of why they have changed.
- How do I write a scalar to a NetCDF file?
The first way is to use "ncl_scalar" as a dimension name:
spherical = new(1,"character")
spherical!0 = "ncl_scalar"
spherical = tochar(1)
ncid->spherical = spherical
The second way is to use filevardef:filevardef(ncid, "spherical","character","ncl_scalar") ncld->spherical = tochar(1)
Note that for either of these methods, if you look at this file in NCL it will appear as if there is a dimension named "ncl_scalar". In an ncdump of the file, however, the dimension will not appear, so the variable is a true NetCDF scalar. - How do I retain metadata for a variable that was read off a series of files using "addfiles"?
Use a special function from contributed.ncl called addfiles_GetVar. For example:
load "$NCARG_ROOT/lib/ncarg/nclscripts/csm/contributed.ncl" fils = systemfunc("ls /model/annual*nc") f = addfiles(fils, "r") T = addfiles_GetVar(f,fils,"T") printVarSummary(T) - How do I access an NCL file variable, attributes, or coordinate arrays if they have hyphens/dashes ('-') in the name?
If you have an NCL file variable with hyphens in the name (for example, "in->Data-Set-14"), then you will get an error message if you try to access this variable directly. This is because NCL treats the hyphens as minus symbols:
ncl> print(in->Data-Set-14)
fatal:Either file (in) isn't defined or variable (Data) is not a variable in the file
fatal:Execute: Error occurred at or near line 24
To get around this problem, turn the name of the variable into a string, and enclose the string in dollar signs ('$'):print(in->$"Data-Set-14"$)
or
  var_string = "Data-Set-14"
  print(in->$var_string$)
You can also use $$ for attribute names:
lname = data@$"long-name"$
For more information on using '$' to reference file variables, see the section "File variable string references" in the NCL Reference Manual.
- How do I read/write NetCDF, HDF4, HDF-EOS2, GRIB1, GRIB2, or CCM History Tape files?
To open any one of these types of files, use the addfile function, which opens a data file and returns a pointer to the file. Once you have a pointer to the file, you have access to all of its global and variable attributes and coordinate arrays. You can also use addfile to open a NetCDF or HDF file for writing (not GRIB1, GRIB2, HDF-EOS2, or CCM files, since you can't write these files in NCL).
For example, to open a GRIB file and write some of its variables to a NetCDF file:
begin
  grib_file  = addfile("ced1.lf00.t00z.eta.grb","r")  ; Open GRIB file to read
  ncfile_out = addfile("data.nc","c")             ; Open NetCDF file to write

; Write some data to NetCDF file.
  ncfile_out->PRES  = grib_file->PRES_6_SFC
  ncfile_out->HGT   = grib_file->HGT_6_SFC
  ncfile_out->A_PCP = grib_file->A_PCP_6_SFC_acc
  ncfile_out->NCPCP = grib_file->NCPCP_6_SFC_acc
  ncfile_out->ACPCP = grib_file->ACPCP_6_SFC_acc
  ncfile_out->CAPE  = grib_file->CAPE_6_SFC
end
For some more complex examples, see the file I/O application examples.
For detailed information on the file formats that NCL supports, see the "Information on supported data formats" section in the NCL Reference Manual.
- How do I read/write ASCII files?
Use the asciiread function to read an ASCII file and the asciiwrite or write_matrix procedures to write an ASCII file.
Here's an example:
;
; Assume the "oceanland30e.asc" file contains a single column of integers,
; 16471 of them. "asciiread" allows you to specify the dimensionality of
; the data, and in this case we are passing dimensions (/91,181/), so
; "ocean1" will be a 2-dimensional array dimensioned 91 x 181, which can
; be verified by printing the dimsizes of "ocean1."
;
  ocean1 = asciiread("oceanland30e.asc",(/91,181/),"integer")
  print(dimsizes(ocean1))

;
; Write out part of "ocean1" to a new ASCII file.  "data.asc" will contain
; 15 integers, since (7:3:2,0:4) is a 3 x 5 array.
;
  asciiwrite("data.asc",ocean1(7:3:2,0:4))
For more complex examples, see the ASCII read/write examples in the list of file I/O application examples.
- How do I read CSV files?
See the "Reading CSV files application" applications page.
- How do I write a formatted ASCII file?
Use a function called write_matrix that will nicely format 2D arrays using a user-specified format string.
Here's an example that writes a 2D array to a file called "file.txt":
  N    = 5
  M    = 7
  ave  = 0.0
  std  = 5.0
  x    = random_normal (ave, std, (/N,M/))

  res = True
  res@fout = "file.txt"
  write_matrix (x, "5f7.2", res)
This example will produce the following output in "file.txt":4.35 4.39 0.27 -3.35 -6.90 4.36 4.66 3.77 -1.66 4.06 9.73 -5.84 0.89 8.46 10.39 4.91 4.59 -3.09 7.55 4.56 1.77 3.68 5.08 0.14 -5.63 -0.63 -14.12 -2.51 1.76 -1.43 -4.29 0.07 5.85 0.87 8.65
- How do I read an ASCII file if I don't know how many lines it contains?
There are two ways you can do this:
- Use "-1" in the second argument to asciiread:
z = asciiread("file.dat",-1,float)
If you have multiple columns of data, and you know how many columns there are, then you can use onedtond to restructure the one-dimensional array returned from asciiread. In the example below, assume there are 4 columns of data:z = asciiread("file.dat",-1,"float") ncol = 4 ; number of columns nrow = dimsizes(z)/ncol ; get number of points znew = onedtond(z,(/nrow,ncol/)) ; znew will be nrow x ncol
- Use systemfunc to count the number of lines in
the file before you read it. Assuming again that you have a data
file with 4 columns of data:
    ncol = 4
    nrow = toint(systemfunc("wc -l wgt"))  ; "wc -l" returns the #
                                                     ; of lines in a file
    z = asciiread("file.dat",(/nrow,ncol/),"float")
- Use "-1" in the second argument to asciiread:
- How do I read an ASCII file that contains delimiters?
There's an applications page that describes a script that reads an ASCII file with delimiters, and creates a netCDF file that contains all the data. This script assumes that the first line of your ASCII file contains the names of the fields, and uses these names as variable names on the netCDF file.
- How do I read/write binary files?
Use the appropriate cbinread, cbinwrite, craybinrecread, fbindirread, fbindirwrite, fbinread, fbinrecread, fbinrecwrite, or fbinwrite function, depending on what type of binary file you have. In addition, you may also want to use the functions craybinnumrec or fbinnumrec for getting the number of unformatted Fortran records in a file.
For some complex examples, see the binary read/write examples in the list of file I/O application examples.
See the setfileoption procedure for ways to change how your binary file is read/written (big endian versus little endian, for example).
- Once I've opened a file with "addfile", how do I find out what variables and attributes it contains?
Use the functions getfilevaratts, getfilevardims, and getfilevarnames to retrieve the list of attribute names for a file variable, the list of dimension names for a file variable, or the list of variable names for a file, respectively.
- Is there a way to control whether my binary file is read or written as little endian or big endian?
Use the setfileoption procedure:
  setfileoption("bin","ReadByteOrder","LittleEndian")
  v = cbinread("data.littleEndian.bin",-1,"float")

  setfileoption("bin","WriteByteOrder","BigEndian")
  cbinwrite("data.bigEndian.bin",v)
- I'm having trouble reading a Fortran binary file with records.
It's possible you are running into a problem where the record marker was written with 8 bytes, and NCL is expecting the marker to be 4 bytes.
This happens if the Fortran program that created the binary file was compiled with a version of "gfortran" that sets the marker size to whatever "off_t" is on that system.
As a work-around, you can recompile the code that created the binary file with the option "-frecord-marker=4" to force a 4-byte record, and run the code again to regenerate the file.
It is on our list to create a new option in setfileoption that will allow you to specify the record marker size that the file was written with.
- I'm trying to convert a file to a NetCDF file using "ncl_convert2nc", but getting an error message about violating format constraints.
If you are trying to convert a file to NetCDF using ncl_convert2nc, and getting the following error message:
   ncendef: ncid 0: NetCDF: One or more variable sizes violate format
                            constraints
then you may have what qualifies as a "large file". You need to use the "-L" option with ncl_convert2nc. - Why do I get different results when reading my HDF-EOS2 file, depending on whether I use the ".hdf" or ".hdfeos" extension?
If you use the ".hdf" extension, then NCL uses the underlying HDF4 interface to read your data, whereas if you use the "hdfeos or "he2" extension, NCL reads the file using the HDF-EOS2 library interface.
Using the ".hdfeos" extension software will give you slightly more information, since the HDF-EOS2 software provides software to calculate additional lat/lon information.
Side tip: if your HDF-EOS2 file has an ".hdf" extension, then you can force NCL to read this file as an HDF-EOS2 file simply by appending an ".he2" or ".hdfeos" to the file name in the addfile call (you don't need to rename the file). For example, if your file is called "swath.hdf" and you want to read it as a HDF-EOS2, use the following:
a = addfile("swath.hdf.hdfeos","r")
- Can I read shapefiles using NCL?
NCL currently does not have the ability to read shapefiles. The NCL development team is looking into this format to determine the best way these files might be supported.
Meanwhile, some users have emailed us with suggestions which we'll include here:
- GDAL - Geospatial Data Abstraction Library
- This package includes a set of command lines tools that are very
handy to work with georeferenced data format (including GeoTiff, HDF
and NetCDF): http://www.gdal.org/gdal_utilities.html.
In particular, you can rasterize vector data (like shapefiles) with the command "gdal_rasterize". There's an example in this post on how to use these tools: http://lists.osgeo.org/pipermail/gdal-dev/2006-June/009369.html
You can also extract the polygon from the vector file into an ascii file: http://www.gdal.org/ogrinfo.html
- FWTools package - an open source GIS binary kit for Windows and Linux
- You can use this package to convert shapefiles to text.
The "ogr2ogr" command line utility allows for
type conversion between a variety of GIS related formats (it
hasn't been verified whether NetCDF or HDF is one such format).
A user reported that he converted a shapefile to a Mapinfo file (MIF format) which is a text format file of lon/lat pairs for each defined region. You could then read in this text file using NCL's asciiread function.
- How can I get at vgroup data on my HDF4 file?
NCL cannot (yet) read vgroup data on an HDF file. If you install HDF4 on your system (available from http://www.hdfgroup.org/release4/obtain.html), then you can use the HDF dumper program, "hdp" to get at the vgroup data you need. You first need to use "hdp dumpvd" on the file to find out what "Vdata" index your data is in:
hdp dumpvd calipso.hdf
This will produce output like this:
Vdata: 0
   tag = 1962; reference = 34;
   number of records = 1; interlace = FULL_INTERLACE (0);
   fields = [Product_ID, Date_Time_at_Granule_Start,
                  Date_Time_at_Granule_End,
                  Initial_Subsatellite_Latitude,
                  Initial_Subsatellite_Longitude,
                  Final_Subsatellite_Latitude,
                  Final_Subsatellite_Longitude, Lidar_Data_Altitudes];
   record size (in bytes) = 1746;
   name = metadata; class = metadata;
   number of attributes = 0
- field index 0: [Product_ID], type=4, order=80
   number of attributes = 0
. . .
You can see that the "Lidar_Data_Altitudes" variable is in vdata 0, so use this with the hdp command to get the data only:
hdp dumpvd -i 0 -d -f Lidar_Data_Altitudes calipso.hdf
An alternative approach to extracting the Lidar_Data_Altitudes is to invoke the hdp command line operator from with an NCL script. For example:
; input hdf4 file name and the directory where it resides
   diri = "./"
   fili = "CAL_LID_L1-ValStage1-V3-01.2011-05-01T05-00-22ZN.hdf"

; specify desiredvariable
   vari = "Lidar_Data_Altitudes"

; output text file name and the directory where it is to be placed
   dirh = "./"
   filh = "CAL_LID_L1-ValStage1.height.txt"

; use NCL's system procedure and pipe output to file
   system("hdp dumpvd -i 0 -d -f "+vari+" "+diri+fili+" >! "+dirh+filh)

; read the file created by the hdp
   hgt    = asciiread(dirh+filh, -1, "float")
   hgt!0  = "hgt"
   hjt@long_name = "HEIGHT"
   hgt@units     = "km"

  ;hgt    = hgt(::-1)      ; if height need to be reordered
If you are not sure where hdp resides, from your home directory, try:find . -name hdp -print
- When I run my script, I'm getting an error message "ncclose: ncid 0: NetCDF: Not a valid ID".
You should only see this error if you are using version 5.0.0 of an OPeNDAP-enabled NCL. It usually occurs when you exit the NCL script.
We verified this is a bug created by recent changes to NCL's handling of its internal cleanup and exit procedures. This bug has been fixed and will be available in V5.1.0.
Note that this does not cause a problem in reading NetCDF files. When you write a file, however, you may have to delete the file handler variable before you exit the script, by using the delete procedure:
begin ... f = addfile("newfile.nc","w") ...write stuff to file pointed to by 'f'. delete(f) end - When I try to access the Climate Diagnostics Center [CDC] OPeNDAP server via NCL, I get "Permission denied".
It is likely that the CDC OPeNDAP server does not recognize the IP address of the machine being used. The CDC server was shut down due to security concerns. They have opened the OPeNDAP server on a host by host basis. If you wish to access the CDC OPeNDAP server, please e-mail esrl.psd.data@noaa.gov with:
- The IP address of the machine from which you wish access. This should be a static IP address (not generated via DHCP). It would better if this address could successfully undergo reverse DNS lookup to produce a fully qualified hostname.
- The name of your institution.
- A one-line blurb about your intended use of the data.
See the http://www.cdc.noaa.gov/opendap.html URL for the complete story.
After registration with CDC, an NCL script might look like:
 CDC_URL  = "http://www.cdc.noaa.gov/cgi-bin/opendap/nph-nc/Datasets/" ; generic CDC
 CDC_FILP = "ncep.reanalysis.dailyavgs/pressure/air.2005.nc"     ; data path

 filp = CDC_URL + CDC_FILP
 if (isfilepresent(filp)) then
   fp = addfile(filp,"r")
 else
   print("============================================")
   print("CDC_URL : "+CDC_URL)
   print("CDC_FILP: "+CDC_FILP)
   print("does not exist: message from NCL script")
   print("============================================")
   exit
 end if

 x = fp->FOO
- I'm running into a problem when opening lots of files with addfile or addfiles ("Too many files open").
If you need to open lots of files with addfiles, then call setfileoption as follows, before you call addfiles:
setfileoption("nc", "SuppressClose", False)The number of files you can have open at any time is dependent on your system. A general limit seems to be around 1024.
Data handling
- How do I set a missing value for my data?
For the variable that contains your data, set the attribute "_FillValue" to the missing value. For example, the following NCL code:
  x = (/1,2,3,-999,5,6,7,-999,-999,10/)
  x@_FillValue = -999
sets the missing value of x to -999.The "_FillValue" attribute is recognized by many NCL functions and procedures and thus the computations will behave differently when they encounter missing values (like ignore them or return with an error message). For example, if you pass the above x array to the NCL function sum, you will get a return value of 34.
- How do I determine if my data contains any missing values, or count how many missing values it has?
Use the ismissing function combined with the any function to return a single True or False indicating whether your data contains missing values:
  is_msg = any(ismissing(data)))
  if(is_msg) then
    print("'data' contains missing values.")
  else
    print("'data' doesn't contain any missing values.")
  end if
To count the number of missing values, use the num function:num_msg = num(ismissing(data))) print("data contains " + num_msg + " missing values.")
- How do I change the missing value to another value?
If your data contains a "_FillValue" attribute, simply set it to the value you want, but be sure to use the same type (float, double, etc).
For example, to change your data's missing values from 0 to -999, use:
data@_FillValue = -999
If your data contains a "missing_value" attribute, this won't be recognized by NCL as an official missing value. You want to set the "_FillValue" attribute to this value:data@_FillValue = data@missing_value delete(data@missing_value) ; not necessary, just cleaning up
There are other ways to assign a _FillValue attribute. See the assignFillValue function. - How do I deal with NaN (not-a-number) values in my data?
The computational and plotting functions in NCL cannot handle NaN values directly. You must first convert the NaN values to missing values.
To do this, use the replace_ieeenan function to convert the NaNs to missing values. You can optionally use isnan_ieee to first determine if any of your values are equal to NaN:
If "x" already has a _FillValue attribute:
  if (any(isnan_ieee(x))) then
    replace_ieeenan (x, x@_FillValue, 0)
  end if
If "x" doesn't have a _FillValue attribute:
if (any(isnan_ieee(x))) then x@_FillValue = 1.e20 ; or whatever value you want to use replace_ieeenan (x, x@_FillValue, 0) end if - How do I deal with "Inf" (infinity) values in my data?
As with NaN values, the computational and plotting functions in NCL cannot handle "Inf" values directly. You must first convert the "Inf" values to missing values.
To do this, use the where function:
If "x" already has a _FillValue attribute:
x = where(abs(x).gt.1e20, x@_FillValue, x)
Here's some more generic code to first check if x has a _FillValue attribute:
  if(.not.isatt(x,"_FillValue")) then
    x@_FillValue = default_fillvalue(typeof(x))
  end if
  x = where(abs(x).gt.1e20, x@_FillValue, x)
Data analysis
- How do I average values in a multi-dimensioned array?
Use the avg, dim_avg_n or dim_avg functions.
For example, in the following NCL code snippet where x is a 2 x 3 x 2 array, y will be a scalar value equal to 2.916667:
   x = (/(/(/2,3/), (/4,5/), (/1,2/)/), (/(/3,8/), (/1,4/), (/0,2/)/)/)
   y = avg(x)
If you have a multi-dimensional array, say T(ntim,klev,nlat,mlon) and you wish to obtain the temporal mean at each level, latitude and longitude then:T_time_mean = dim_avg_n(temp, 0) ; (klev,nlat,mlon)
or, to retain meta data:T_time_mean = dim_avg_n_Wrap(temp, 0) ; requires contributed.ncl
If you have a multi-dimensional array, say prc(ntim,nlat,mlon) containing 3-hourly precipitation rates (eg, mm/hour) and it is desired to calculate the average precipitation rate for an each day then:dimprc = dimsizes(prc) ntim = dimprc(0) ; total number of time steps ntJump = 8 ; eight samples per day (=24/3) prcDay = prc(::ntJump,:,:) ; create array with meta data ntStrt = 0 ntLast = ntJump-1 do nt=0,ntim-1,ntJump prcDay(nt/8,:,:) = dim_avg_n(prc(ntStrt:ntLast,:,:), 0) ntStrt = ntStrt + ntJump ntLast = ntLast + ntJump end do printVarSummary(prcDay)
If the original data had been total precipitation over a 3-hour span and the daily total (sum) precipitation had been desired, the approach would be exactly the same except that dim_sum_n would be used:prcDay(nt/8,:,:) = dim_sum_n(prc(ntStrt:ntLast,:,:), 0)
- How can I do an element-wise minimum/maximum between two arrays of the same size?
Use the versatile where function:
   xmin = where(x1.lt.x2,x1,x2)
   xmax = where(x1.gt.x2,x1,x2)
- How do I interpolate my 2-dimensional random data to a 2-dimensional gridded array?
There are lots of functions available for doing different kinds of interpolations and regridding. For a list, go to the NCL functions and procedures page and look in the interpolation or regridding sections.
The Random Data to Grid example URL has several examples. As a specific example, two interpolation functions are natgrid or dsgrid2. Here's an example:
  NX = 21
  NY = 21

; Define the input data arrays.
  x = (/0.00, 1.00, 0.00, 1.00, 0.40, 0.75/)
  y = (/0.00, 0.00, 1.00, 1.00, 0.20, 0.65/)
  z = (/0.00, 0.00, 0.00, 0.00, 1.25, 0.80/)

; Define the output grid.
  xc = 1./(NX-1.)
  xo = ispan(0,NX-1,1) * xc

  yc = 1./(NY-1.)
  yo = ispan(0,NY-1,1) * yc

; Do the gridding using natgrid. "natout" will be a 2-dimensional array
; dimensioned 21 x 21.
  natout = natgrid(x, y, z, xo, yo)
  print(natout)

; Do the gridding using dsgrid2. "dsout" will be a 2-dimensional array
; dimensioned 21 x 21.
  dsout = dsgrid2(x, y, z, xo, yo)
  print(dsout)
- How do I interpolate my 3-dimensional random data to a 3-dimensional gridded array?
First, see the question above on 2-dimensional grids.
Two functions for handling 3D random data are triple2grid and dsgrid3.
Here's an example of using dsgrid3:
  NX = 21
  NY = 21
  NZ = 21
  x = (/0.00, 1.00, 0.00, 1.00, 0.40, 0.75/)
  y = (/0.00, 0.00, 1.00, 1.00, 0.20, 0.65/)
  z = (/0.00, 0.00, 0.00, 0.00, 1.25, 0.80/)
  u = x*x + y*y + z*z

  xo = new((/NX/),float)
  yo = new((/NY/),float)
  zo = new((/NZ/),float)

;
; Create the output grid.
;
  xmin = -2.0
  ymin = -2.0
  zmin = -2.0
  xmax =  2.0
  ymax =  2.0
  zmax =  2.0

  ii = fspan(0,20.,21)
  xo = xmin + (ii/(NX-1)) * (xmax-xmin)
  yo = ymin + (ii/(NY-1)) * (ymax-ymin)
  zo = zmin + (ii/(NZ-1)) * (zmax-zmin)

;
; Interpolate.  "output" will be a 3-dimensional grid dimensioned 21x21x21.
;
  output = dsgrid3(x, y, z, u, xo, yo, zo)
  print(output)
- How can I figure out if a particular latitude/longitude point is within a specific area, like Europe?
There's no ready-made function that will do this based on just the area name, like "Europe". However, if you have the lat/lon coordinates that define the particular area that you're interested in, then you can use the gc_inout function.
Otherwise, assume you have a crude regional approximation that indicates the area you're interested in, say:
  latS =  36
  latN =  70
  lonW = -10
  lonE =  60
Further assume you have a data array "x" with coordinate arrays "time" x "lat" x "lon". You can then set up a "Europe" mask (eMask):work = x(0,:,:) LAT = conform( work, work&lat, 0) LON = conform( work, work&lon, 1) eMask = new ( (/nlat,mlon/), "logical", "No_FillValue") eMask = where(LAT.ge.latS .and. LAT.le.latN .and. \ LON.ge.lonE .and. LON.le.lonW, True, False) copy_VarCoords(work, eMask) ; Copy coordinate arrays ; Clean up delete(work) delete(LAT) delete(LON)To plot an area using your new mask variable to exclude the areas you're not interested in, see example 5 on the mask applications page.
Visualization
- How can I create an "editable" graphics file required for journal publication?
Use "eps" as an output format, when you open a workstation for sending the graphics to.
For example, if you're using the gsn_open_wks function:
wks = gsn_open_wks("eps","myplot")
- How can I maximize the size of a plot in the frame?
If you are using one of the gsn_xxx plotting scripts, then set the special resource gsnMaximize to True.
Run the following simple script and compare the two frames:
  load "$NCARG_ROOT/lib/ncarg/nclscripts/csm/gsn_code.ncl"

  data = generate_2d_array(10, 10, -19.69, 15.82, 0, (/129,129/))

  wks = gsn_open_wks("x11","max")

  plot = gsn_contour(wks,data,False)

  res             = True
  res@gsnMaximize = True
  plot = gsn_contour(wks,data,res)
- How do I get multiple plots on a page?
If your plots are all the same size, then you can use the procedure gsn_panel. If your plots are not the same size, then you can use the viewport resources vpXF, vpYF, vpWidthF, and vpHeightF.
For some panel examples, see the panel applications page. This page also shows you tricks on paneling plots that are not the same size (#9 and #14 are two such examples).
- What's a good way to generate a color map (table)?
See the page on creating your own color map, or the section "Creating your own color map using HSV values HSV color wheel and how it helps you create a color map.
For an example, try modifying the HSV values in the file "
gsn_color.ncl" and running it through NCL to see the different results you get. You can use the function gsn_draw_colormap to draw the current color map associated with the workstation:
  load "$NCARG_ROOT/lib/ncarg/nclscripts/csm/gsn_code.ncl"

  wks = gsn_open_wks("ncgm","gsn_draw_colormap")
  gsn_draw_colormap(wks)   ; Draw the default colormap

  gsn_define_colormap(wks,"hotres")   ; Change color map and
  gsn_draw_colormap(wks)              ; draw it.
- My map projection doesn't look right.
If you're plotting a subset of longitudes and getting a strange looking map, then you may need to set the resource mpCenterLonF. This will tell NCL where you want the center longitude of the plot to be. Usually, this should be set to the halfway point between mpMinLonF and mpMaxLonF:
res@mpCenterLonF = (res@mpMinLonF + res@mpMaxLonF)/2.
- How do I change all of my fonts to be the same in my visualization?
First select a font from the NCL font tables and remember the name, i.e. "helvetica".
If you always want to use this font in all of your NCL scripts, then put the following line in a file called ".hluresfile" in your home directory:
*Font : helvetica(We highly recommend using the helvetica font for all NCL scripts, because the default font doesn't look good when you print it.)If NCL sees a ".hluresfile" in your home directory, it will always load it before running any NCL scripts.
If you want this font to apply only to a particular NCL script, first create a file called xxx.res, where xxx is the second argument to gsn_open_wks. Then, include the above line in that file.
Any fonts that you are explicitly setting in your NCL script will override resources set in ~/.hluresfile or the NCL script-specific resource file.
Here's an example (with the "font.res" below):
  load "$NCARG_ROOT/lib/ncarg/nclscripts/csm/gsn_code.ncl"

  wks = gsn_open_wks("x11","font")   ; Open an X11 workstation.

  y = (/1,3,-1,-2,0,2,3/)
  x = ispan(0,dimsizes(y)-1,1)

  res = True
  res@tiMainString  = "This is an XY plot"
  res@tiXAxisString = "X values"
  res@tiYAxisString = "Y values"

  xy = gsn_xy(wks,x,y,res)   ; Create and draw an XY plot.
The "font.res" file:! Change all fonts to times-bold *Font : times-bold
Try changing "times-bold" in the "font.res" file to other fonts to see the results. Use either a font name or a font index as listed in the font tables.- How can I change the text function code to something other than a colon?
If you want your text function code permanently changed (to, say, a '~') for every time you run NCL, then in the ~./.hluresfile put the following line:
*TextFuncCode : ~TextFuncCode can be set to whatever character you want (the default is a colon, ':'). This special resource can only be set in a resource file and not in an NCL script.To change the text function code to another character inside of an NCL script, use any one of the *FuncCode resources that corresponds with the resource you are using to set the text string.
For example, if you are setting the txString resource:
res@txString = "Time : 0600 hours"then you change the function code associated with this resource to another character (say '~') with the txFuncCode resource:res@txFuncCode = "~" res@txString = "Time : 0600 hours"If you are setting the X axis label with tiXAxisString, then the corresponding function code resource would be tiXAxisFuncCode, and so on.- How can I get a degree symbol in a text string?
You can use font table 34 with the character "0" to get a degree symbol:
load "$NCARG_ROOT/lib/ncarg/nclscripts/csm/gsn_code.ncl"

begin
  wks = gsn_open_wks("x11","degree")

  res              = True                     ; plot mods desired

  res@tiMainString = "Example degree (~S~o~N~) symbol"

  res@tmXBMode     = "Explicit"                ; explicit labels
  res@tmXBValues   = (/  0.2,          0.4,      0.6,          0.8/)
  res@tmXBLabels   = (/"20~F34~0~F~","40~F34~0~F~","60~F34~0~F~","80~F34~0~F~"/)
  res@tmXBLabelFontColor = "Red"

  plot = gsn_blank_plot(wks,res)
end
- How can I get things like accents or umlauts over my text?
It's not trivial, but it is doable, using text function codes. Here's an example:
load "$NCARG_ROOT/lib/ncarg/nclscripts/csm/gsn_code.ncl"

begin

  wks = gsn_open_wks("x11","text")

  res               = True
  res@txJust        = 4
  res@txFont        = 25
  res@txFontHeightF = .1
;
; Explanation of the text string function codes:
;
; :F22: - Select font 22 (Helvetica bold)
; :H-15F35: - Move 15 digitized font units left and select font 35.
; The character "H" in font 35 is an umlaut.
; :H4F22: - Move 4 digitized font units right and select font 22.
; :H-14F35: - Move 14 digitized font units left and select font 35.
; :H3F22: - Move 3 digitized font units right and select font 22.
;
  str1 = ":F22:u:H-15F35:H:H4F22:berho:H-14F35:H:H3F22:hen"

;
; Explanation of the text string function codes:
;
; :F22: - Select font 22.
; :H-16V6F35: - Move 16 digitized units left, 6 digitized units
; up, and select font 35.
; :V-6H5F22: - Move 6 digitized units down and select font 22.
; :H-13F35: - Move 13 digitized units left and select font 35.
; :F22H2: - Select font 22 and move 2 digitized units right.
;
  str2 = ":F22:U:H-16V6F35:H:V-6H5F22:bersta:H-13F35:H:F22H2:nder"

  gsn_text_ndc(wks,str1,0.5,0.7,res)    ; Draw the text string
  gsn_text_ndc(wks,str2,0.5,0.3,res)

  frame(wks)
end
- How can I get special characters, like Greek symbols, in my graphical text strings?
First browse the font tables to find the one that contains the character(s) you want. Clicking on any one of the font names, like "math_symbols", will show you all the characters for that particular font.
Once you find the character you desire, note the font table index ("math_symbols" is index 18, for example), and the corresponding character, then you can use the text function code 'F' to change the font.
For example, to get a bell symbol, you would see that character 'n' in the "symbol_set1" table (index 19) is a bell. You can then use the string "~F19~n~F~" in any text string resource to indicate you want a bell symbol. The "~F~" means go back to the original font.
For example, to use it in a title:
res@tiMainString = "Bell (~F19~n~F~)"
Note that we're assuming the default function code (a colon, ':'), has been changed to a tilde, '~'. See the question above on changing function codes.- Can I use real PostScript fonts in my PostScript file?
Essentially no, except in one situation that is discussed below. When you use NCL font number 4, you will get the stroked simplex_roman font, no matter what kind of workstation you are going to, even a PostScript workstation. If you change "4" to "Helvetica," then you will get NCL font 21 which is a Helvetica font that is drawn using filled areas, i.e. filled areas will be put into the output PostScript and not code to use the built-in PostScript Helvetica font.
However, there is one circumstance which will allow you to use a PostScript font directly and not have filled areas inserted into the output PostScript. This can be accomplished by setting the resource txFontQuality to "low." There are some significant downsides to this. First, no matter what font you select in NCL, the font used in the output PostScript will be Helvetica. If you select a character, such as a degree symbol, that is not in the Helvetica font, it will not be drawn correctly. Secondly, all text strings will be monospaced. Thirdly, when plotting to workstations other than PostScript or PDF, you will get a very low-level stick font.
The primary upside to this is a reduction in the size of the output PostScript file. Another advantage is that you will be using a built-in PostScript font that will be produced with high fidelity, even at very small sizes.
Here is an example of using font quality "low":
begin
  wks = gsn_open_wks("ps","font_test")

  txres = True
  txres@txFontQuality = "low"
  txres@txFontHeightF = 0.04
  txres@txFuncCode    =  ":"
  gsn_text_ndc(wks,"Test PS fonts",.5,.5,txres)
  frame(wks)

  txres@txDirection = "down"
  gsn_text_ndc(wks,"Vertical",.5,.5,txres)
  frame(wks)

  txres@txDirection = "across"
  gsn_text_ndc(wks,                                                   \
    "degree sign:: :F34:0:FC:superscript:: 1.3:F0L1:4:F:10:S:300",    \
    .5,.5,txres)
  frame(wks)
end
- I'm having trouble importing a PS file into an application like Adobe Illustrator.
You can try "fixing" the PostScript using an application like "ps2ps" or "convert" from ImageMagick:
convert test.ps test2.ps
- How can I get the length of my axes to be the same ratio as the range of my axes?
You can use the vpWidthF and vpHeightF resources to control the width and height. You will need to calculate the range of each of your axes, and then figure out the normalized values (from 0 to 1) to use.
Or, if you are using any of the non-map gsn_xxxx plotting functions, then you can set the special resource gsnShape to True:
load "$NCARG_ROOT/lib/ncarg/nclscripts/csm/gsn_code.ncl"
load "$NCARG_ROOT/lib/ncarg/nclscripts/csm/gsn_csm.ncl"

begin
  ny = 100
  mx =  50

; Generate some dummy data.
  z = generate_2d_array(20,20,-136.,450.,0,(/ny,mx/))

; Open an X11 window.
  wks = gsn_open_wks("x11","axes_ratio")

; Generate contour plot with default axes.
  res = True
  res@gsnMaximize = True

  plot = gsn_csm_contour(wks, z ,res)

; Set resource to reshape axes.
  res@gsnShape = True
  plot = gsn_csm_contour(wks, z ,res)

end
- How do I change the aspect ratio or size of my map or plot?
For a plot that doesn't contain a map, you can use the viewport resources vpWidthF and vpHeightF. The viewport coordinates are normalized; that is, they take values from 0.0 to 1.0 (inclusive).
For example, if you want your plot to be wider than it is high, then you might set vpWidthF to 0.4 and vpHeightF = 0.75:
  load "$NCARG_ROOT/lib/ncarg/nclscripts/csm/gsn_code.ncl"
  load "$NCARG_ROOT/lib/ncarg/nclscripts/csm/gsn_csm.ncl"

  wks = gsn_open_wks("x11","viewport")   ; Open an X11 workstation.

  y = (/1,3,-1,-2,0,2,3/)
  x = ispan(0,dimsizes(y)-1,1)

  res = True
  res@vpWidthF  = 0.75
  res@vpHeightF = 0.4

  xy = gsn_csm_xy(wks,x,y,res)   ; Create and draw an XY plot.
In order to change the aspect ratio of a map, you can still use the "vp" resources as above, but you must also set the resource mpShapeMode to "FreeAspect":load "$NCARG_ROOT/lib/ncarg/nclscripts/csm/gsn_code.ncl" wks = gsn_open_wks("x11","viewport") ; Open an X11 workstation. mpres = True mpres@mpShapeMode = "FreeAspect" ; Allow the aspect ratio to be changed. mpres@gsnMaximize = True mpres@vpWidthF = 0.8 mpres@vpHeightF = 0.8 map = gsn_map(wks,"CylindricalEquidistant",mpres)
In the above script, to maximize the plot in the frame but retain the aspect ratio, the special resource gsnMaximize is set to True.- Can I set color resources by color name rather than color index values?
Yes, as long as the color you want to reference exists in your current color map. Any place that you would normally use a color index value, you can use a color name enclosed in double quotes. An ASCII list of the valid color names is in the file "$NCARG_ROOT/lib/ncarg/database/rgb.txt", and a graphical representation is also available".
For example, if color index 2 is red in your color map, and you want to set the main title font color to red, then you can do it one of two ways from an NCL script:
  res@tiMainFontColor = 2     ; index value

  res@tiMainFontColor = "red" ; color name
Whenever a named color is used, the current color map is searched for the color that is the closest match to that color. This means that if you access a color that doesn't have a close match in your color map, you may not get the color you are expecting. To get around this problem, make sure the color map you use contains all the named colors you want by adding them explicitly to your color map.For example, if you want your general color map to have the following RGB values:
(/(/0.0,0.0,0.0/),(/1.0,1.0,1.0/),(/1.0,0.0,0.0/),(/0.0,1.0,0.0/),
  (/0.0,0.0,1.0/),(/1.0,1.0,0.0/),(/0.0,1.0,1.0/),(/1.0,0.0,1.0/),
  (/0.5,0.0,0.0/),(/0.5,1.0,1.0/),(/0.0,0.0,0.5/),(/1.0,1.0,0.5/),
  (/0.5,0.0,1.0/),(/1.0,0.5,0.0/),(/0.0,0.5,1.0/),(/0.5,1.0,0.0/),
  (/0.5,0.0,0.5/)/)
and you also want to include the named colors "Olive", "Plum", "Gold", "MediumBlue", and "LightSlateGray", then set the new color map as follows:... cmap = (/"(/0.0,0.0,0.0/)","(/1.0,1.0,1.0/)","(/1.0,0.0,0.0/)",\ "(/0.0,1.0,0.0/)","(/0.0,0.0,1.0/)","(/1.0,1.0,0.0/)",\ "(/0.0,1.0,1.0/)","(/1.0,0.0,1.0/)","(/0.5,0.0,0.0/)",\ "(/0.5,1.0,1.0/)","(/0.0,0.0,0.5/)","(/1.0,1.0,0.5/)",\ "(/0.5,0.0,1.0/)","(/1.0,0.5,0.0/)","(/0.0,0.5,1.0/)",\ "(/0.5,1.0,0.0/)","(/0.5,0.0,0.5/)",\ "Olive","Plum","Gold","MediumBlue","LightSlateGray"/) wks = gsn_open_wks(...) gsn_define_colormap(wks,cmap) ...Note: in order to mix RGB values with color names, you must enclose each entry in double quotes. More information about named colors is available in the color fill applications page.- How can I speed up the drawing of filled contours in NCL?
You can try setting the cnFillMode resource to "RasterFill" (the default is "AreaFill"), and further set cnRasterSmoothingOn to True if you want smoother contours.
- Can I change color index values or color maps in mid-frame?
The main consideration in doing this is changing the background color. If the background color is changed in mid-picture (color index 0), then in most cases at the time you change the background color your entire frame will be overwritten with that color. As long as you do not change the background color in mid-picture, your results should be as desired. See the simple example below.
Trying to swap in an entire new color map is problematic, again primarily due to considerations with resetting the background color. If you are producing PS or PDF output and if your background color is the default, then things should work. Things should work in all cases in going to NCGM and translating with ctrans. Producing X11 output works unless you specifically reset the background color.
But, to be on the safe side, what will work in all cases is starting off with any color map and then redefining any color indices except the background. For example, if you have a color table with 256 defined colors and want to replace that in mid-picture with a different color table, use the function NhlSetColor to redefine all color index values except for index 0. The logic in the following example illustrates this:
load "$NCARG_ROOT/lib/ncarg/nclscripts/csm/gsn_code.ncl" begin res = True ; ; draw_cells draws cells fitting them into a box with lower left ; corner (xll,yll) and upper right corner (xur,yur) with nx cells ; in x and ny cells in y. For each call each cell is colored ; using increasing indices in cmap, starting with index 0. ; procedure draw_cells(wks:graphic, xll:float, yll:float, xur:float, \ yur:float, nx:integer, ny:integer, \ cmap[*][3]:numeric) begin xinc = (xur-xll)/nx yinc = (yur-yll)/ny do j=0,ny-1 plly = yll + j*yinc pury = plly + yinc do i=0,nx-1 pllx = xll + i*xinc purx = pllx + xinc x = (/pllx,purx,purx,pllx,pllx/) y = (/plly,plly,pury,pury,plly/) res@gsFillColor = i+j*nx gsn_polygon_ndc(wks,x,y,res) end do end do end ; ; Original color map is "black", "red", "green", "blue". ; cmap = (/ (/0.,0.,0./), (/1.,0.,0./), (/0.,1.,0./), (/0.,0.,1./) /) rlist = True rlist@wkColorMap = cmap wks_type = "x11" wks = gsn_open_wks(wks_type,"cell") gsn_define_colormap(wks,cmap) ; ; Draw color boxes using the original color map. ; draw_cells(wks, 0., 0., 1.0, 0.5, 2, 2, cmap) ; ; Redefine indices 1-3. ; NhlSetColor(wks, 1, 0., 1., 1.) ; cyan NhlSetColor(wks, 2, 1., 0., 1.) ; magenta NhlSetColor(wks, 3, 1., 1., 0.) ; yellow ; ; Draw color boxes using the redefined color map. ; draw_cells(wks, 0., 0.5, 1.0, 1.0, 2, 2, cmap) frame(wks) end- How do I get my PostScript/PDF output to cover most of an 8-1/2" x 11" page?
You can do this one of two ways. If you are using one of the gsn_xxx plotting scripts, then the easy way is to set the special resource gsnMaximize to True:
  load "$NCARG_ROOT/lib/ncarg/nclscripts/csm/gsn_code.ncl"

  data = generate_2d_array(10, 10, -19.69, 15.82, 0, (/129,129/))

  wks = gsn_open_wks("pdf,"pdfmax")

  res             = True
  res@gsnMaximize = True
  plot = gsn_contour(wks,data,res)
Another (but harder) way is when you create your PostScript/PDF workstation, use the resources wkDeviceLowerX, wkDeviceLowerY, wkDeviceUpperX, and wkDeviceUpperY to position the output anywhere on the page.load "$NCARG_ROOT/lib/ncarg/nclscripts/csm/gsn_code.ncl" type = "ps" type@wkDeviceLowerX = -75 ; These coordinates can be negative. type@wkDeviceLowerY = -50 type@wkDeviceUpperX = 750 type@wkDeviceUpperY = 950 wks = gsn_open_wks(type,"psmax") res = True blank = gsn_blank_plot(wks,res)
Note that it is possible to have negative values for these resources, and to use them to change the aspect ratio of the plot.- How can I control the size and location of the X11 window that NCL brings up?
Add the lines:
! Make default X11 window larger (adjust as necessary)
*wkWidth   : 800
*wkHeight  : 800
to your "~/.hluresfile" file.- How do I tell NCL to ignore missing values in my plot?
If you are using gsn_xxx routines to generate your graphics, then all you need to do is make sure that the _FillValue attribute of your data is set to the missing value.
Otherwise:
- for contour data - use the ScalarField
resource sfMissingValueV
- for vector/streamline data, use the VectorField
vfMissingUValueV and/or
vfMissingVValueV resources
- for XY data, use the resources caXMissingV and/or caYMissingV
  load "$NCARG_ROOT/lib/ncarg/nclscripts/csm/gsn_code.ncl"

; Create some dummy data for the contour plot.
  T = (/ (/  7,  7,   7,   7,   7,   7,   7,   7,   7, 7, 7 /),\
         (/  7,  5,   5,   5,   5,   5,   5,   5,   5, 5, 7 /),\
         (/  7,  5, 999, 999, 999, 999, 999, 999, 999, 5, 7 /),\
         (/  7,  5, 999,   3,   3,   3,   3,   3, 999, 5, 7 /),\
         (/  7,  5, 999,   3,   2,   2,   2,   3, 999, 5, 7 /),\
         (/  7,  5, 999,   3,   2,   1,   2,   3, 999, 5, 7 /),\
         (/  7,  5, 999,   3,   2,   2,   2,   3, 999, 5, 7 /),\
         (/  7,  5, 999,   3,   3,   3,   3,   3, 999, 5, 7 /),\
         (/  7,  5, 999, 999, 999, 999, 999, 999, 999, 5, 7 /),\
         (/  7,  5,   5,   5,   5,   5,   5,   5,   5, 5, 7 /),\
         (/  7,  7,   7,   7,   7,   7,   7,   7,   7, 7, 7 /)/)

  T@_FillValue = 999    ; Set _FillValue.

  wks = gsn_open_wks("x11","contour")
  contour = gsn_contour(wks,T,False)    ; Draw a contour plot.
Note the hole in the middle of the contour plot due to the presence of missing values.For an XY plot example with missing values:
  load "$NCARG_ROOT/lib/ncarg/nclscripts/csm/gsn_code.ncl"

  wks = gsn_open_wks("x11","xy")

  y = (/1,3,-1,-2,0,2,3,0,5,-2,1,0,0,8,10,5,-3/)

  y@_FillValue = 0               ; Set the missing value.

  xy = gsn_y(wks,y,False)        ; Create and draw an XY plot.
Note the gaps in the XY curve due to missing values.- How can I get more labels on my contour lines?
NCL uses a complex algorithm to determine where to put contour line labels, and sometimes this generates unexpected results, like not getting enough contour labels.
You can set the cnLinelabelPlacementMode to different values to try to control the way the contour lines are labeled. The default is "Randomized", and you can try the values "Constant" or "Computed".
The resource cnLineLabelDensityF allows you to increase the density of the contour labels, if cnLinelabelPlacementMode is set to "Computed" or "Randomized".
See the contour labels applications page for some examples.
- My X or Y axis values are not linear. How can I change this?
You can set the special gsn resources gsnXAxisIrregular2Linear and/or gsnYAxisIrregular2Linear to True.
For an example, run the following code:
load "$NCARG_ROOT/lib/ncarg/nclscripts/csm/gsn_code.ncl"
load "$NCARG_ROOT/lib/ncarg/nclscripts/csm/gsn_csm.ncl"

begin
;
; Generate some dummy data.
;
  level = (/1000, 850, 700, 500, 400, 300, 250, 200, 150, 100/)
  lat   = fspan(-90,90,20)

  nlat  = dimsizes(lat)
  nlev  = dimsizes(level)
  data  = generate_2d_array(10, 12, -20., 17., 0, (/ nlev,nlat/))

  data!0   = "lev"     ; Name the dimensions and
  data!1   = "lat"     ; attach coordinate arrays
  data&lev = level     ; This coordinate array is irregulary spaced
  data&lat = lat

  wks = gsn_open_wks("x11","linear")
  gsn_define_colormap(wks,"rainbow")

; Set up resources.
  res                     = True
  res@gsnMaximize         = True        ; Maximize plot in frame
  res@gsnSpreadColors     = True        ; Span full color map
  res@cnFillOn            = True        ; Turn on contour fill
  res@cnLinesOn           = False       ; Turn off contour lines
  res@lbLabelAutoStride   = True        ; Control labelbar spacing

  res@tiYAxisString       = "Irregularly-spaced values"
  plot = gsn_csm_contour(wks,data,res)  ; Create filled contours

  res@tiYAxisString       = "Y axis linearized"
  res@gsnYAxisIrregular2Linear = True
  plot = gsn_csm_contour(wks,data,res)  ; Create filled contours
end
- How do I get log scaling on either of my plot axes?
For an XY plot, set the transformation resources trXLog and/or trYLog to True, depending on which axes you want to be in log scaling.
Here's an example with default linear axes, and then with the Y axis "logged":
  load "$NCARG_ROOT/lib/ncarg/nclscripts/csm/gsn_code.ncl"

; Create dummy data for XY plot.
  y =  (/10, 100, 5000, 10, 9000, 70, 300, 10000, 600/)

  wks = gsn_open_wks("x11","logxy")   ; Open an X11 workstation.

  xyres = True
  xyres@tiXAxisString = "linear"
  xyres@tiYAxisString = "linear"

  xyplot = gsn_y(wks,y,xyres)  ; Create and draw the XY plot.

; Change the Y axis scale to be log and redraw the plot.
  xyres@trYLog        = True
  xyres@tiYAxisString = "log"
  xyres@xyComputeYMin = True   ; To keep from getting some warning msgs.

  xyplot = gsn_y(wks,y,xyres)  ; Create and draw the XY plot.
For a contour plot, the method for changing to log scaling depends on whether the coordinates for the axis you want to log are regularly or irregularly spaced. If they are regularly spaced, then use trXLog or trYLog just like it was done for the XY plot above:load "$NCARG_ROOT/lib/ncarg/nclscripts/csm/gsn_code.ncl" ; Create some dummy data for the contour plot. N=25 T = new((/N,N/),float) jspn = ispan(-N/2,N/2,1)^2 ispn = ispan(-N/2,N/2,1)^2 do i = 0, dimsizes(ispn)-1 T(i,:) = ispn(i) + jspn end do T = 100.0 - sqrt(8^2 * T) wks = gsn_open_wks("x11","logcon") ; Open an X11 workstation. cnres = True cnres@sfYCStartV = 10 cnres@sfYCEndV = 1000 cnres@tiXAxisString = "linear" ; Label for X axis. cnres@tiYAxisString = "log" ; Label for Y axis. cnres@trYLog = True ; Log scaling for Y axis contour = gsn_contour(wks,T,cnres) ; Create and draw contour plot.
If you are using one of the gsn_xxx plotting functions, and if the coordinates for the axis you want to log are irregularly spaced (as they are if your data contains coordinate arrays or you set one of either the sfXArray or sfYArray resources), then you can set the appropriate gsnXAxisIrregular2Log or gsnYAxisIrregular2Log resource to True:load "$NCARG_ROOT/lib/ncarg/nclscripts/csm/gsn_code.ncl" ; Create some dummy data for the contour plot. N = 25 T = new((/N,N/),float) jspn = ispan(-N/2,N/2,1)^2 ispn = ispan(-N/2,N/2,1)^2 do i = 0, dimsizes(ispn)-1 T(i,:) = ispn(i) + jspn end do T = 100.0 - sqrt(8^2 * T) wks = gsn_open_wks("x11","logcon") ; Create some dummy data for the Y axis that is not regularly spaced. y = (/ 10, 50, 100, 150, 250, 500, 750, 1000, 1100, 1300, 1500, \ 1750, 2000, 2200, 2400, 2600, 3000, 4000, 4500, 5000, 5100, 5500, \ 7000, 9000,10000/) cnres = True cnres@sfYArray = y ; Irregular Y axis cnres@gsnYAxisIrregular2Log = True ; Force Y axis to be log. cnres@tiYAxisString = "log" ; Label for Y axis. cnres@tiXAxisString = "linear" ; Label for X axis. contour = gsn_contour(wks,T,cnres) ; Create and draw contour plot.
For some more complex examples, see examples 4-6 on the zonal applications page for an example of these and similar resources.- How do I fill my contour levels with various shading patterns and/or solid colors?
If you just want to fill your contour levels with various solid colors, set cnFillOn to True. If you are using gsn_xxx interfaces, then you can additionally set gsnSpreadColors to make sure your full color map is spanned. To change the default colors used for the contour levels, set cnFillColors to an array of desired color indexes.
If you want to fill the contour levels with different shading patterns, you must set cnMonoFillPattern to False, and then set cnFillPatterns to an array of desired fill pattern indexes.
There are 18 different fill patterns: pattern 0 is solid fill, patterns 1-16 are various fill patterns, and pattern 17 is a special stipple fill pattern. If you use "-1" for a fill pattern, this means to leave it transparent (no fill).
There's a function called gsn_contour_shade that allows you to specify contour levels where you want specific shading or colors.
Here's an example showing how to create a contour plot using different fill patterns and colors:
  load "$NCARG_ROOT/lib/ncarg/nclscripts/csm/gsn_code.ncl"
  load "$NCARG_ROOT/lib/ncarg/nclscripts/csm/gsn_csm.ncl"

; Create some data for the contour plot.
  data = generate_2d_array(10, 10, -19.69, 15.82, 0, (/129,129/))

  wks = gsn_open_wks("x11","fillcon")

  cnres                   = True
  cnres@cnFillOn          = True   ; Turn on contour level fill.
  cnres@cnMonoFillPattern = False  ; Indicate you want multiple fill patterns.
;
; Set cnFillPatterns and cnFillColors to various indexes representing
; fill patterns and colors.  A fill pattern index of "0" is solid fill.
; If you don't want any fill for a particular contour level, set it
; to "-1," which means "transparent."
;
  cnres@cnFillPatterns    = (/0, 2, 3, 0, 6, 8,10,-1, 9, 0,11,12,17,16/)
  cnres@cnFillColors      = (/6,10,14, 8, 4, 2, 9, 1,12, 3,20,13, 5, 7/)

  contour = gsn_csm_contour(wks,data,cnres)
For examples of gsn_contour_shade, see example 13 on the contour effects applications page.- How do I overlay a contour plot (or a vector/streamline plot) on a map?
The easiest way to do this is use one of the overlay functions found in the list of gsn_xxx interfaces (like gsn_csm_contour_map, gsn_csm_vector_scalar_map, etc).
If your data doesn't contain any coordinate arrays and it hasn't already been transformed into some map projection, then you need to set the resources sfXArray and sfYArray (vfXArray and vfYArray for vector/streamline plots) to arrays that define the values for the axes. For overlaying on a map, these values would be longitude and latitude respectively.
Here's a simple contour example:
  load "$NCARG_ROOT/lib/ncarg/nclscripts/csm/gsn_code.ncl"

; Create some dummy data for the contour/map plot.
  data = generate_2d_array(10, 10, -19.69, 15.82, 0, (/64,128/))

  wks = gsn_open_wks("x11","fillcon")

  res          = True
  res@sfXArray = fspan(-180,180,128)
  res@sfYArray = fspan( -90, 90, 64)

  plot = gsn_contour_map(wks,data,res)
If the plot has already been transformed to map coordinates, then you can set the tfDoNDCOverlay resource to True, indicating to NCL that no map transformation is to take place. In order for this to work, however, your map projection must be set up to exactly match the area your data represents. Sometimes this information is available, say, on the same file that the data came from.Here's a simple (and rather crude) vector example using a cylindrical equidistant map:
  load "$NCARG_ROOT/lib/ncarg/nclscripts/csm/gsn_code.ncl"

; Create some dummy data for the contour/map plot.
  udata = generate_2d_array(10, 10, -19, 15, 0, (/32,64/))
  vdata = generate_2d_array(10, 10, -21, 17, 0, (/32,64/))

  wks = gsn_open_wks("x11","fillcon")

  res          = True
  res@tfDoNDCOverlay = True

  plot = gsn_vector_map(wks,udata,vdata,res)
Of course, these types of plots are usually more complex than the above, because if you don't know the map projection, it can be difficult setting up the map limits correctly. For some more complex examples, see the native grid application page.- How do I force the tickmarks to point inward?
If you are using one of the gsn_csm plotting scripts in which the tickmarks are pointing outward, then you can force them to point inward by setting these four resources:
  res@tmXBMajorOutwardLengthF = 0.0
  res@tmYLMajorOutwardLengthF = 0.0
  res@tmXBMinorOutwardLengthF = 0.0
  res@tmYLMinorOutwardLengthF = 0.0
- I'm trying to control the tickmarks on the top or right axis, and nothing is happening.
By default, the top tickmarks and their labels are controlled by the settings for the bottom tickmarks. Likewise, the right tickmarks are controlled by the settings for the left tickmarks.
If you want to modify the top tickmarks individually of the bottom tickmarks, then you need to set the resource tmXUseBottom to False. For the right tickmarks, set tmYUseLeft to False.
See example 8 on the XY applications page.
- How can I improve the resolution of my map outlines?
Use the mpDataBaseVersion resource. The default is "LowRes". If you change this to "MediumRes" or "HighRes", you will improve the resolution of your map outlines.
Note: the "HighRes" resource shows coastal outlines only, and you should not use this resolution for global maps (it's slow, and you may see some strange artifacts). The high-resolution database does not come with NCL; instructions for downloading and installing this database can be found on the high-resolution coastlines description page.
For an example comparing the three levels of resolutions:
  load "$NCARG_ROOT/lib/ncarg/nclscripts/csm/gsn_code.ncl"
  load "$NCARG_ROOT/lib/ncarg/nclscripts/csm/gsn_csm.ncl"

  wks = gsn_open_wks("x11","mapres")

  res                   = True
  res@gsnMaximize       = True           ; Maximize plot in frame
  res@mpMinLonF         = -15.           ; Area to zoom in on.
  res@mpMaxLonF         =  15
  res@mpMinLatF         =  40.
  res@mpMaxLatF         =  70.

; Default "LowRes" database.
  map = gsn_csm_map(wks,res)

; "MediumRes" database.
  res@mpDataBaseVersion = "MediumRes"
  map = gsn_csm_map(wks,res)

; "HighRes" database.
  res@mpDataBaseVersion = "HighRes"
  map = gsn_csm_map(wks,res)
- When I draw a map using the high-resolution map database, I seem to randomly get different resolutions.
This is because the high-res map database has 5 levels of resolutions, and NCL dynamically chooses the best one based on the size of your plot on the page, and the range of your map.
To control this, you can set the mpDataResolution resource to one of the values "Coarsest", "Coarse", "Medium", "Fine" or "Finest".
You should only use "Fine" or "Finest" if you are zoomed in a fairly small area of the map. These resolutions can take a long time to draw.
See example 20 on the "maps only" applications page.
- How can I get more geographical outlines in my map, like the provinces of China?
We have added more outlines (like China provinces) to our map databases, and they will be available in version 5.1.0. You can see a sample of what this will look like by going to example 16 on the "maps only" applications page.
Meanwhile, if you already have latitude/longitude locations for the desired outlines, then you can draw them yourself. There are some examples where extra map outlines for India and Brazil were added by hand.
Go to:
http://www.ncl.ucar.edu/Applications/polyg.shtml
and see examples 9 and 11.- If I am creating a color contour or vector plot, how do I select my colors such that they are spread across my whole color map?
If you are using one of the gsn_xxx interfaces, then, you can set the special resource gsnSpreadColors to True. Otherwise, you can set the cnFillColors or vcLevelColors to arrays of color indices or names.
Run the following script and compare the color fills in the two frames:
  load "$NCARG_ROOT/lib/ncarg/nclscripts/csm/gsn_code.ncl"
  load "$NCARG_ROOT/lib/ncarg/nclscripts/csm/gsn_csm.ncl"

  cdf_file = addfile("$NCARG_ROOT/lib/ncarg/data/cdf/contour.cdf","r")

  Z    = cdf_file->Z(0,0,:,:)           ; geopotential height

  wks = gsn_open_wks("x11","spread_colors")   ; Open an X11 workstation.

  gsn_define_colormap(wks,"temp1")      ; Use a rainbow color map that
                                        ; has 63 colors and goes from
                                        ; gray to blue to red.
  res                       = True
  res@cnFillOn              = True   ; Turn on contour fill.
  res@lbLabelAutoStride     = True   ; Control labelbar label spacing.

  plot = gsn_csm_contour(wks,Z,res)  ; Draw a filled contour plot.
                                     ; are mostly blue.

  res@gsnSpreadColors = True         ; Choose colors across whole color map.
  plot = gsn_csm_contour(wks,Z,res)  ; Note that the contour colors now
                                     ; span from gray to blue to red.
If you want to only use a subset of the color map, then you can also set gsnSpreadColorStart and gsnSpreadColorEnd resources:
  load "$NCARG_ROOT/lib/ncarg/nclscripts/csm/gsn_code.ncl"
  load "$NCARG_ROOT/lib/ncarg/nclscripts/csm/gsn_csm.ncl"

  cdf_file = addfile("$NCARG_ROOT/lib/ncarg/data/cdf/contour.cdf","r")
  Z        = cdf_file->Z(0,0,:,:)           ; geopotential height

  wks = gsn_open_wks("x11","spread_colors")
  gsn_define_colormap(wks,"tbr_240-300")

  res                      = True
  res@gsnMaximize          = True
  res@cnFillOn             = True    ; Turn on contour fill
  res@gsnSpreadColors      = True    ; Spread the colors
  res@gsnSpreadColorStart  =  23     ; Start at 24th color
  res@gsnSpreadColorEnd    = 187     ; There are 201 colors
  res@lbLabelAutoStride    = True    ; Control labelbar labels

  plot = gsn_csm_contour(wks,Z,res)
- How do I generate a wire-frame surface or isosurface plot in NCL?
There are a basic set of 3D plotting routines, based on a library interface called
Tdpack. For wire-frame plots, you can use tdez2d, and for isosurfaces you can use tdez3d. For some examples of these and other Tdpack routines, see the Tdpack applications page.
- How do I draw weather symbols (wind barbs, weather front lines, high and low pressure indicators, arrows, dots, weather icons, cloud symbols, lightning bolts, etc.) on a map?
Use the procedures wmbarb, wmdrft, and/or wmlabs in combination with one of the gsn_*map* functions.
Here's an example of drawing a weather front and a couple of "High" symbols on a satellite view map projection:
load "$NCARG_ROOT/lib/ncarg/nclscripts/csm/gsn_code.ncl" ; Create a color map and an X11 workstation. cmap = (/ (/ 1., 1., 1. /), \ ; 0 - White background. (/ 0., 0., 0. /), \ ; 1 - Black foreground. (/ 1., 0., 0. /), \ ; 2 - Red. (/ 0., 0., 1. /), \ ; 3 - Blue. (/ 0., 1., 1. /), \ ; 4 - Cyan. (/ 1., 0., 1. /)/) ; 5 - Magenta. wks = gsn_open_wks("x11","wmlabs") gsn_define_colormap(wks,cmap) ; Create a satellite view projection. mpres = True mpres@gsnFrame = False ; Don't advance the frame. mpres@gsnMaximize = True ; Maximize plot on page. mpres@mpOutlineBoundarySets = "National" mpres@mpGridLineColor = 0 mpres@mpCenterLatF = 40. mpres@mpCenterLonF = -105. map = gsn_map(wks,"Satellite",mpres) ; Draw a stationary front. wmsetp("ezf",1) ; Tell wmap we are using an existing map projection. wmsetp("lin",1.0) ; Line width of front curve. wmsetp("fro","stationary"); Specify stationary front. wmsetp("cfc",3) ; Use blue for the triangles. wmsetp("wfc",2) ; Use red for the bumps. wmsetp("swi",0.04) ; Increase the size of the bumps and triangles. xlat = (/ 20., 30., 35., 40., 45. , 50./) ; Latitudes. xlon = (/-195., -125., -115., -105., -95., -85./) ; Longitudes. wmdrft(wks, xlat, xlon) ; Draw front. ; Draw a couple of High symbols. wmsetp("hib",4) ; Cyan for background. wmsetp("his",1) ; Black for shadow. wmsetp("hic",5) ; Magenta for bounding circle. wmsetp("sht",0.02) ; Increase size. xl = (/ 50., 50./) ; Latitudes. yl = (/-105.,-145./) ; Longitudes. wmlabs(wks, xl, yl, "HI") ; Draw symbols. frame(wks)- How can I have a new line as part of a graphical text string in NCL?
Use the text function code that represents a carriage return ('C'):
load "$NCARG_ROOT/lib/ncarg/nclscripts/csm/gsn_code.ncl" begin wks = gsn_open_wks("x11","test") ; Assumes '~' is the function code, and not the default ':' title = "This is a title~C~with a carriage return" txres = True txres@txFontHeightF = 0.03 gsn_text_ndc(wks,title,0.5,0.5,txres) end- How come I get different line thicknesses on different output devices using the same thickness value?
Line thicknesses displayed on different output devices (X11, PostScript, PDF, etc.) can be significantly different for the same line thickness value. This is due to several factors.
Every device has a default, or nominal, line thickness (also sometimes call line width). This nominal line width is the width of a line drawn with the default thickness value of 1.0. In general this nominal line width is different for different devices. What a given device considers its default line width can vary from barely visible to fat. For example, the nominal line width for PostScript output may look thinner than a line drawn with the same width specification on an X11 window. Also, the results for X11 output can vary depending on the resolution of the output device.
The linewidth scale factor is applied to the nominal line width on a given device. However, it will not necessarily produce lines that are exactly that factor bigger than the default width. In fact the scale factor may have no effect, or unexpected effects. In general the scale factor is applied to the default line width of the device and maps onto the nearest available hardware line width that a device supports. For printed PostScript output the results you get will probably be as accurate as you will want, but for X11 output, or PostScript displayed on a computer monitor, you will get varying results.
Different devices also interpret fractional, or zero, line widths differently. For example, PostScript and PDF will always produce a line, no matter how small the line width value is - a zero linewidth value will produce a line one pixel wide. However, for X11 output any line width value less than 0.5 will usually map to a zero-width line, that being the closest available hardware line width. In contrast to PS or PDF, a zero-width line in X11 output is not drawn.
If you are trying to "zero" out a line, the recommendation is to do it some other way than setting the line thickness to 0. For example, you can draw it in the background color. This way you will get the same results for X11 and PostScript.
The bottom line is that you should not be surprised by what you get when it comes to line widths - it definitely depends on the output device.
The following script can be run to get an idea what various lines drawn with different thickness specifications will look like on different devices.
load "$NCARG_ROOT/lib/ncarg/nclscripts/csm/gsn_code.ncl"

begin
  wktype = "ps"
  wks  = gsn_open_wks (wktype, "thickness")
  cmap = (/"White","Black"/)
  gsn_define_colormap(wks,cmap)

;
;  Main title.
;
  txres = True
  txres@txFontHeightF = 0.04
  txres@txFont = 22
  gsn_text_ndc(wks,"Line thicknesses",0.5,0.95,txres)
  txres@txFontHeightF = 0.025
  gsn_text_ndc(wks, \
     "(results will vary depending on the output device)",0.5,0.88,txres)

;
;  Specify the sample line thicknesses.
;
  thicknesses = (/8.00, 4.00, 2.00, 1.00, 0.75, 0.50, 0.25, 0.00/)

;
;  Draw and label lines with the sample thicknesses.
;
  pres = True
  ytop = 0.78
  txres@txFontHeightF = 0.02
  txres@txJust = "CenterLeft"
  do i = 0,dimsizes(thicknesses)-1
    pres@gsLineThicknessF  = thicknesses(i)
    yh = ytop - 0.1*i
    gsn_text_ndc(wks,"Thickness = " + thicknesses(i),0.05,yh+0.025,txres)
    gsn_polyline_ndc(wks,(/0.05,0.95/),(/yh,yh/),pres)
  end do

  frame (wks)
end
- How can I put a timestamp on my plot?
Use the infoTimeStamp procedure:
  load "$NCARG_ROOT/lib/ncarg/nclscripts/csm/gsn_code.ncl"
  load "$NCARG_ROOT/lib/ncarg/nclscripts/csm/gsn_csm.ncl"
  load "$NCARG_ROOT/lib/ncarg/nclscripts/csm/shea_util.ncl"

  data = generate_2d_array(10, 10, -19.69, 15.82, 0, (/129,129/))

  wks = gsn_open_wks("x11","max")

  plot = gsn_contour(wks,data,False)

  res             = True
  res@gsnFrame    = False
  plot = gsn_csm_contour(wks,data,res)

  infoTimeStamp(wks,0.02,"")

  frame(wks)
- Why am I not getting the color I expect when I reference a named color?
Each named color has a specific RGB value associated with it. If this RGB value is not in your current color map, then NCL will try to find the next closest color using a special algorithm. Depending on your current color map, this may yield surprising results.
The most common example of this problem is when somebody is using one of the gsn_csm_xxxx_map examples, which by default fill the land areas in light gray. If you change your color map to one that doesn't have any shades of gray in it, then the land masses will be filled in with the closest thing it can find to gray.
The solution is to explicitly add gray (or whatever named color you are referencing) to your color map:
   wks = gsn_open_wks("x11","test")
   igray = NhlNewColor(wks,0.7,0.7,0.7)
You can see RGB values for every named color by clicking on any one of the named color thumbnails, or looking at the big RGB text file that defines all the named colors.- Why is my land not being filled in the color I expect?
By default, the gsn_csm_xxxx_map scripts try to fill the land with gray. If you are using a color map that doesn't have gray in it, then NCL will try to find the closest color to gray. This might be white, or it might be something else entirely, like pink.
There are three possible solutions:
- If you don't want any land fill, then the solution is to turn off
map fill by setting res@mpFillOn
= False.
- If you want the land filled in gray, then you will need to add
gray to your color map:
   wks = gsn_open_wks("x11","test")
   gsn_define_colormap(wks,"some_color_map")
   igray = NhlNewColor(wks,0.7,0.7,0.7)
Gray will be added to the end of your existing color map, so if you are creating filled contours or vectors, you may need to further set:
res@gsnSpreadColorEnd = -2 ; default is -1
so that the last color is not included in your color contour or vector plot.
- If you want to fill the land in some other color, then set res@mpLandFillColor to a different color.
- How do I set up my NCL script so that it uses a resource file?
If you call gsn_open_wks to open a workstation, then the second argument is what allows you to have an optional resource file. For example, if you have the following script:
load "$NCARG_ROOT/lib/ncarg/nclscripts/csm/gsn_code.ncl"

begin
; Create an X Workstation object.
  wks = gsn_open_wks("x11","title_app")

; Draw a text string
  gsn_text_ndc(wks,"Hello, World",0.5,0.5,False)
end
then it will look for a resource file called "title_app.res". If you then have the following lines in your "title_app.res" file:*txFontColor : 2 *txFont : helvetica-bold *txFontHeightF : 0.06
you should see a red "Hello, World" string in the center of the frame.Note that you cannot put the special gsn resources in a resource file!
- How can I move and resize my labelbar and/or legend?
This one confuses users, because they're not "lb" or "lg" resources as one might expect. Instead, you need to use what are called PlotManager resources:
- pmLabelBarOrthogonalPosF / pmLegendOrthogonalPosF
- Moves labelbar or legend perpendicularly to the plot; start with small values like 0.02 or -0.05.
- pmLabelBarParallelPosF / pmLegendParallelPosF
- Moves labelbar or legend parallel to plot; start with small values like 0.02 or -0.05.
- pmLabelBarWidthF / pmLegendWidthF
- Sets width of labelbar or legend; use values between 0 and 1.
- pmLabelBarHeightF / pmLegendHeightF
- Sets height of labelbar or legend; use values between 0 and 1.
  load "$NCARG_ROOT/lib/ncarg/nclscripts/csm/gsn_code.ncl"
  load "$NCARG_ROOT/lib/ncarg/nclscripts/csm/gsn_csm.ncl"

  cdf_file = addfile("$NCARG_ROOT/lib/ncarg/data/cdf/contour.cdf","r")
  Z        = cdf_file->Z(0,0,:,:)           ; geopotential height

  wks = gsn_open_wks("x11","labelbar")
  gsn_define_colormap(wks,"temp1")

  res                          = True
  res@gsnMaximize              = True   ; Maximize plot
  res@gsnSpreadColors          = True   ; Span full color map
  res@cnFillOn                 = True   ; Turn on contour fill.
  res@lbLabelAutoStride        = True   ; Control labelbar label spacing

  res@pmLabelBarOrthogonalPosF = -0.03  ; Move labelbar towards plot
  res@pmLabelBarWidthF         =  0.50  ; Width of labelbar
  res@pmLabelBarHeightF        =  0.10  ; Height of labelbar

  plot = gsn_csm_contour(wks,Z,res)
- How can I set the precision of the label bar labels?
For contour plots, you can use the cnLineLabelFormat resource.
- How can I generate some "nice" 2D random data for a contour and/or vector plot?
Use the generate_2d_array function:
  load "$NCARG_ROOT/lib/ncarg/nclscripts/csm/gsn_code.ncl"

  data = generate_2d_array(10, 10, -19.69, 15.82, 0, (/129,129/))

  wks = gsn_open_wks("x11","max")

  plot = gsn_contour(wks,data,False)

  res             = True
  res@gsnMaximize = True
  plot = gsn_contour(wks,data,res)
Also, see example 17 on the panel applications page. - My map projection doesn't look right.
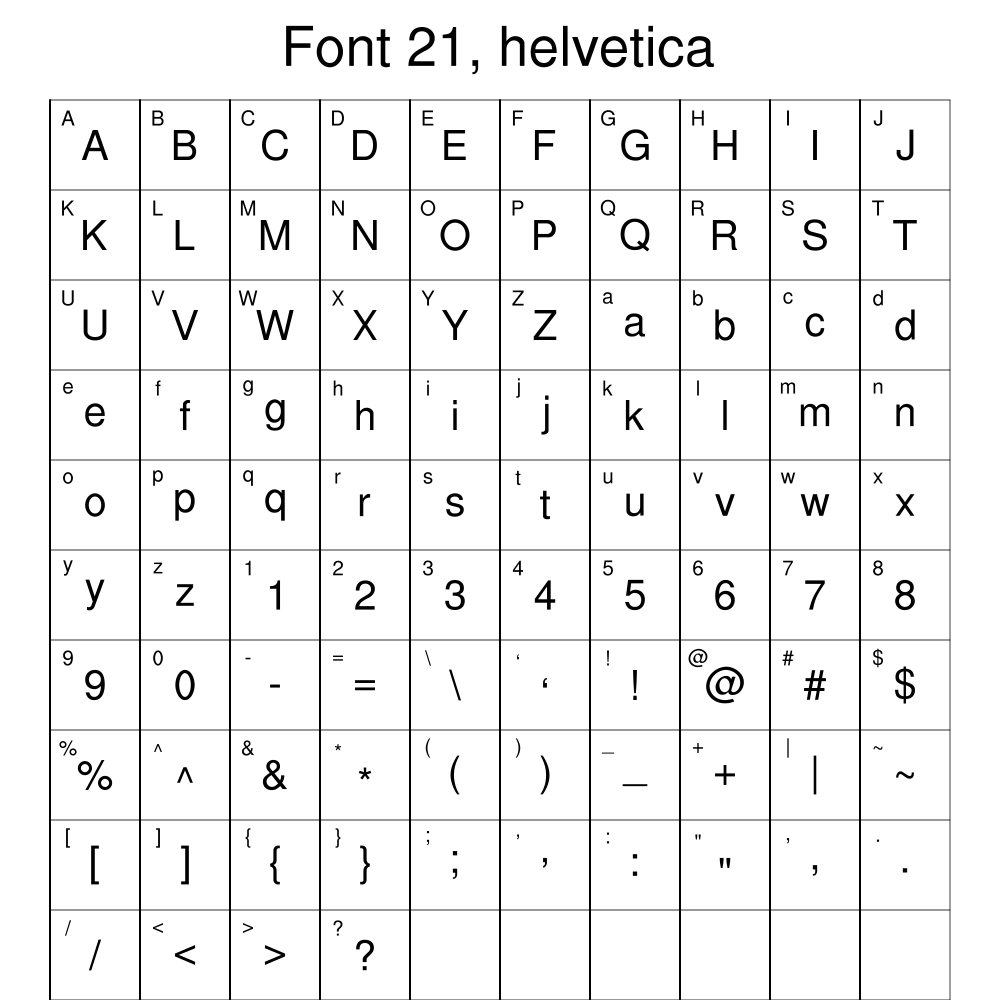
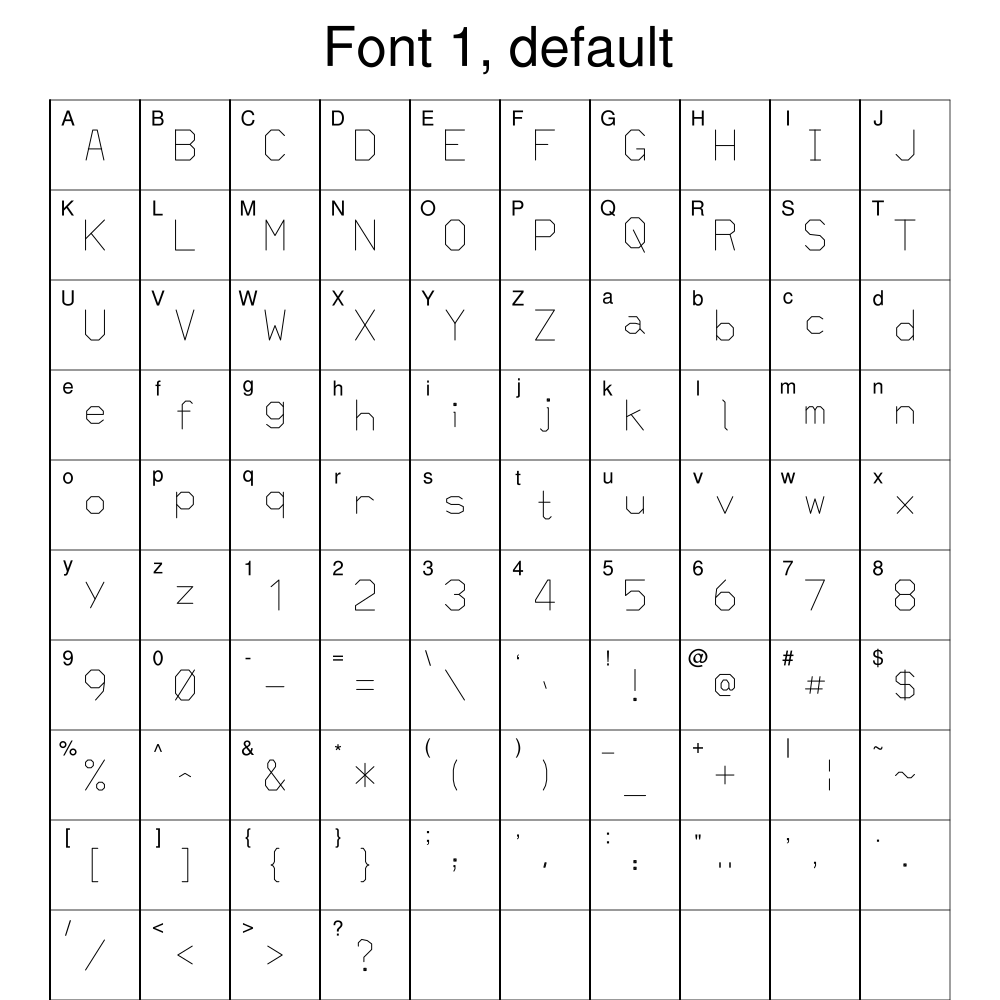
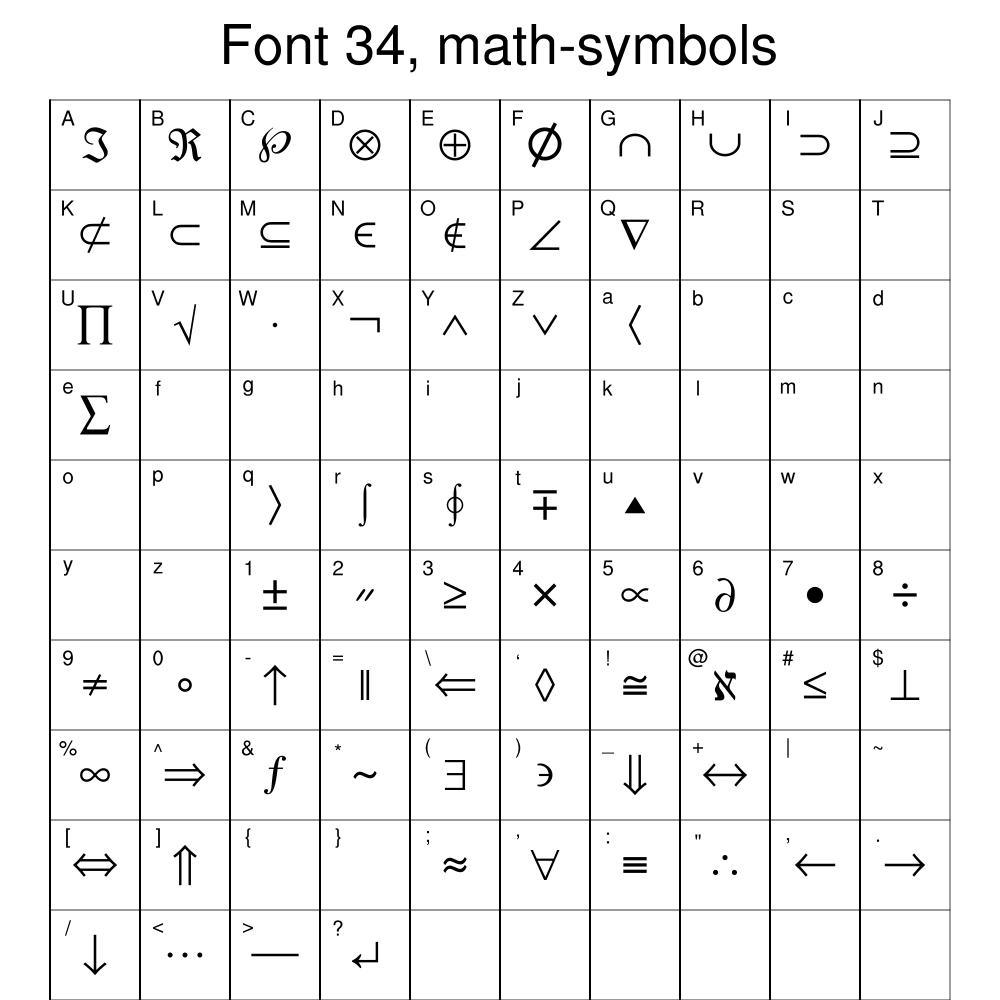
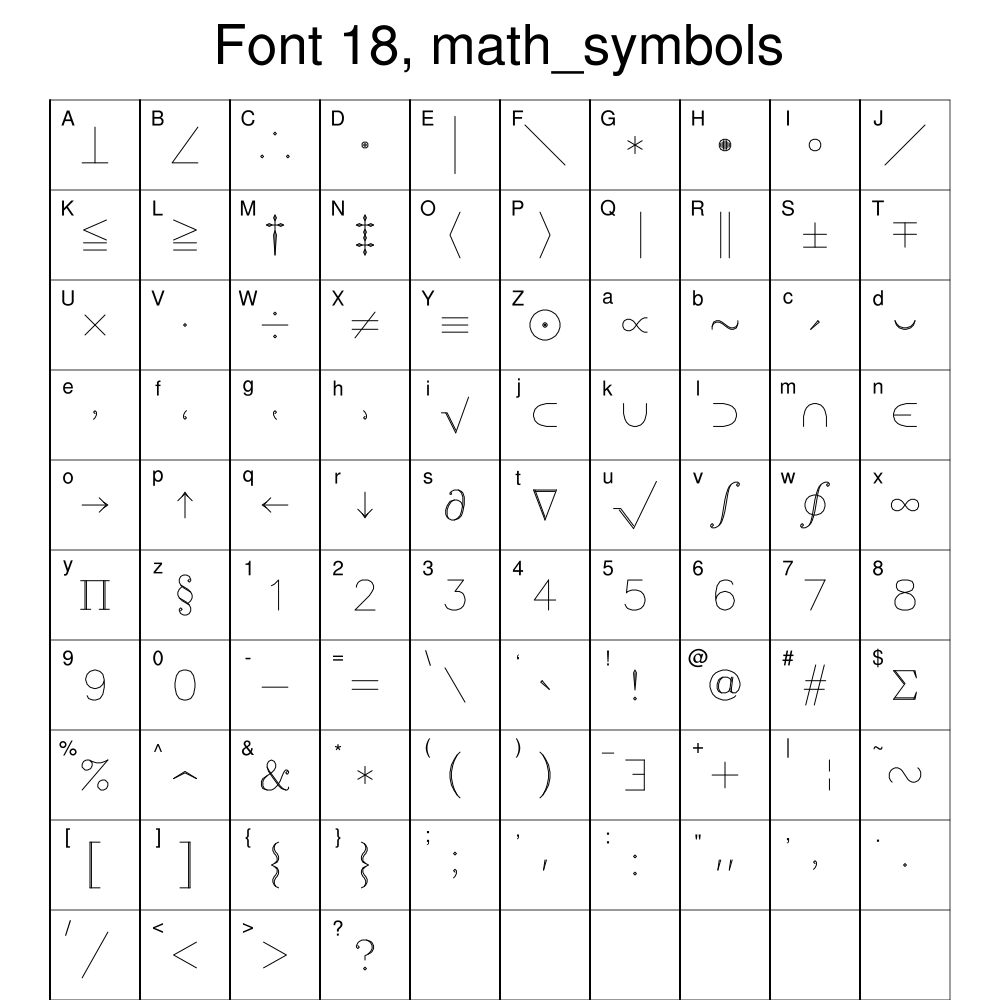
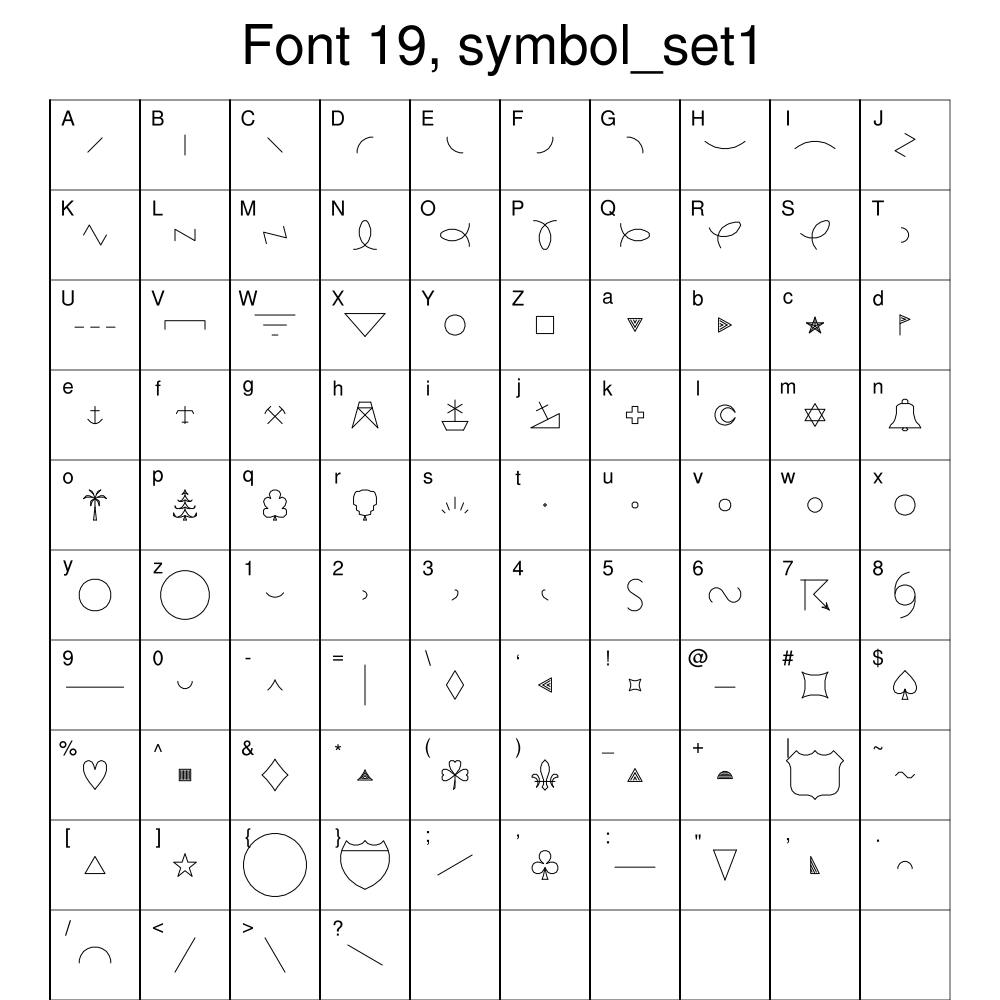
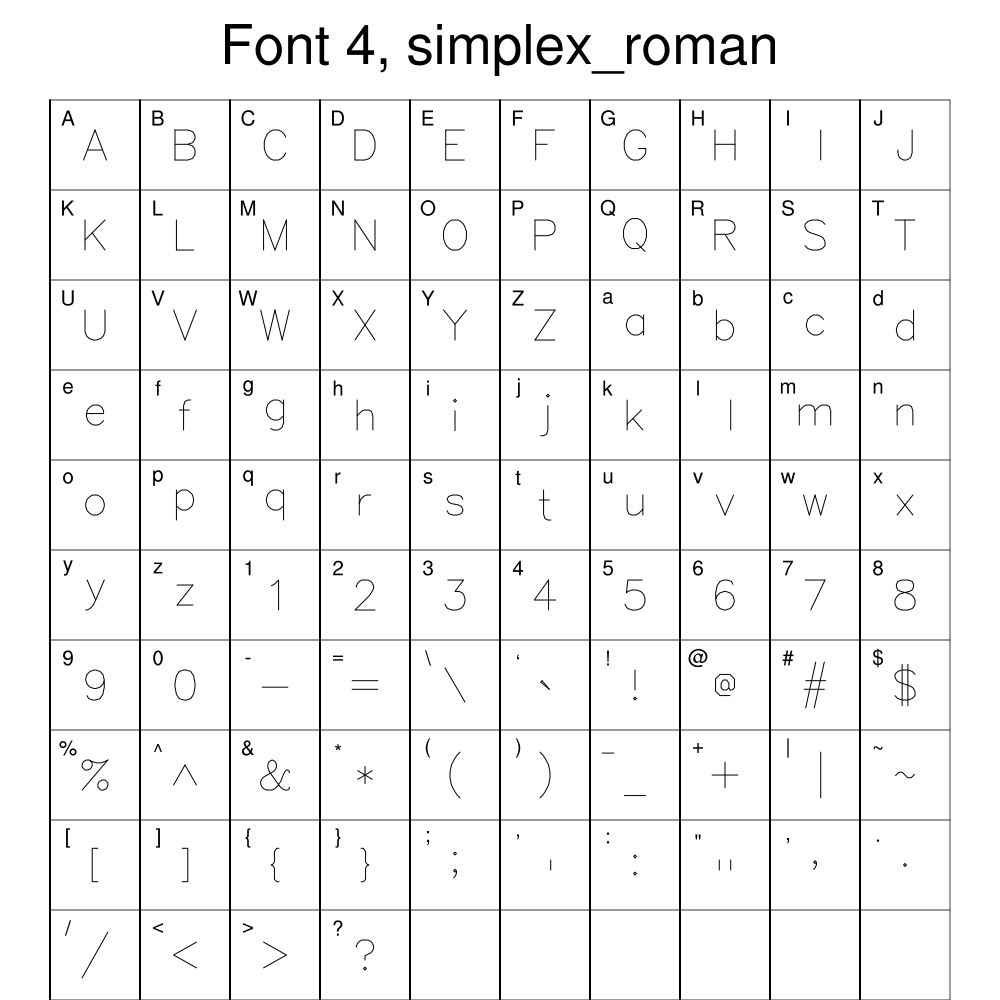
Array functions
- How do I get the dimensions of an array?
Use the dimsizes function, which returns the dimension sizes as a one-dimensional array. For example, if your array was set with:
  x = (/(/(/5,2/), (/2,3/), (/4,4/)/), (/(/0,8/), (/5,1/), (/3,6/)/), \
        (/(/9,9/), (/3,0/), (/5,7/)/), (/(/2,1/), (/4,7/), (/1,6/)/)/)
then the following codey = dimsizes(x)
will return y equal to (/4, 3, 2/). - How do I create unique random subscripts?
Use the function generate_unique_indices.
You can also do this by hand. For example, to generate 1000 unique subscripts:
  r = random_uniform(0,1,1000)  ; random numbers
  i = dim_pqsort(r, 1)           ; return indices
- How do I eliminate missing values from a one-dimensional array?
Say you have a triplet: lat[*], lon[*], val[*] where "val" has some values set to _FillValue. One approach to eliminating triplets that have missing values is to use the ind and ismissing functions and the .not. relational operator:
  ii = ind( .not.ismissing(val) )
  if(.not.any(ismissing(ii))) then
    LAT = lat(ii)    ; triplet with no "val" set to _FillValue
    LON = lon(ii)
    VAL = val(ii)
  else
    LAT = lat
    LON = lon
    VAL = val
  end if
The "if" statement is necessary, because if "val" doesn't contain any missing values, then "ii" will be a missing value and trying to use it as a subscript will cause a fatal error. - How do I generate a one-dimensional array of equally-spaced integers or floating point numbers?
Use the function ispan to generate integers and fspan to generate floats. For example, to generate the list of integers (9, 12, 15, ..., 96, 99):
iarray = ispan(9,99,3)
To generate 20 equally-spaced floating point numbers between 0.0 and 50.0:farray = fspan(0.0,50.0,20)
- How do I find or print the minimum/maximum values of my data array?
Use the functions min and max. For example, in the following NCL code where x is a 4 x 2 array, xmin will be equal to -3 and xmax will be equal to 8:
   x = (/(/-1,3/), (/0,5/), (/1,-2/), (/-3,8/)/)
   xmin = min(x)
   xmax = max(x)
You can use the printMinMax procedure to "pretty" print the min/max values.
Graphical output
- How do I change the default NCGM/PostScript/PDF file name to something else?
Change the second argument in the call to gsn_open_wks. Here's an example of changing the PS file name to "plot1.ps":
  load "$NCARG_ROOT/lib/ncarg/nclscripts/csm/gsn_code.ncl"

begin
  wks = gsn_open_wks("ps","plot1")

  plot = gsn_map(wks,"CylindricalEquidistant",False)

end
- How do I convert my NCL graphics file to another format, like PNG, to put on the web or in a presentation?
You can directly write your graphics to a "PNG" file using "png" as the first argument to gsn_open_wks.
If you want more control over the PNG image, or you want to send it to a different output format, you can first write the output to a PostScript (PS) or Encapsulated PostScript (EPS) file, and then use "convert" from the ImageMagick suite of tools or pstoimg to convert to "png" or another format.
You can get the ImageMagick suite from:
http://www.imagemagick.org/
Click on the "download" link on the left side and you will be presented with lots of options for download locations.Once you have the tools built and installed, you can convert your PS files to other formats using:
convert -geometry 800x800 -density 300 -trim file.ps file.pngThe "geometry" option allows you to specify a pixel size for the image. This must be a square. The "-density" option allows you to increase the quality of the image, which is especially important if you plan to make a large poster. The "-trim" option removes white space around the image.You can put the "convert" command right in your NCL script, after all the calls that generate graphics, but you must delete the workstation first:
  fname = "example"
  wks = gsn_open_wks("ps",fname)
  ...code for generating graphics
  delete(wks)

  cmd = "convert -geometry 800x800 -density 300 -trim " + fname + ".ps " + \
                                                          fname + ".png"
  system(cmd)
The delete procedure effectively causes your PS file to be closed properly.Documentation on "convert" can be found at:
http://www.imagemagick.org/script/convert.php
There are lots of options available with convert, that, according to their web page, allow you to "resize an image, blur, despeckle, dither, draw on, flip, join, re-sample, and much more."Another tool recommended by a user is "pstoimg", which can create smaller PNG files and of better bettery quality (we haven't verified this personally). Here's a sample conversion line for going from PDF to PNG:
pstoimg -trans -interlace -type png -density 120 -crop a -multi *.pdf
- How do I remove all the white space from an image?
See the question above on how to create a PNG image for web or presentation tools. If you're using "convert" to convert images, you can use the "-trim" option as a start.
- Is there a way to make the PostScript files generated by NCL smaller?
We hope to fix the problem of large PostScript files in V5.2.0 of NCL. Meanwhile, check if your system has an application called "ps2pdf". This application will compress a PS file and create a smaller PDF file.
ps2pdf input_postscript_file ouput_pdf_file
If you are on a Mac, you can use "Preview" to reduce the file size. Open the file with "Preview", click "Save as ..." under the file menu, and select "Reduce File Size" for the Quartz Filter in the pop-up menu. - Can I produce a PNG image directly from NCL?
You can call the gsn_open_wks function with "png" as the type (first argument).
- Is there a way to remove the ".000001." from the PNG filename?
We plan to add an option in a future release of NCL to not include the frame number if you are generating a single image.
Meanwhile, you can use the system command to rename the file. You have to be sure to call delete on the workstation first, to properly close the file.
  fname = "example"
  wks = gsn_open_wks("ps",fname)
  ...code for generating graphics
  delete(wks)

  cmd = "mv " + fname + ".000001.png " + fname + ".png")
  system(cmd)
- How can I tilt an NCL graphic?
You can't do this with NCL directly, but if you send the output to a PNG file:
wks = gsn_open_wks("png","file")Then you can use the free rotate3D tool, that depends on ImageMagick. You may already have ImageMagick installed if you use a tool called "convert".To use rotate3D, you can do it after you run the NCL script:
rotate3D 0,45,0 file.png file_tilt.png
Or, you can do it directly in the NCL script, after you are done drawing to the PNG file. You first have to call delete on the workstation object to make sure the PNG file is properly closed:
wks = gsn_open_wks("png","file") . . . draw some graphics . . . delete(wks) system("rotate3D 0,45,0 file.png file_tilt.png") - How can I convert a series of PS or EPS files to an animation?
Take a look at:
http://www.imagemagick.org/Usage/anim_basics/#loop
It shows how to create animations with ImageMagick, a graphical suite for image manipulation. For example, using "convert" from ImageMagick, you can do something like this:
convert -delay 50 *.eps anim.gif
Then display "anim.gif" in your browser or other suitable viewer.
[Thanks to Matues Teixeira and Dave Allured for these suggestions.]
Another suggestion came from Robert Cohen of East Stroudsburg University:
- Generate one PostScript for each image.
- Run ImageMagick's "convert" tool to convert each to an mpeg file (Robert had to use a Windows version of "convert" since the Cygwin version had problems)
- Run "ffmpeg" to combine all of the files into one AVI file. (Robert found that AVI produced a better video loop than MPEG).
- The end result ran fine on a 32-bit machine and looked fine in Windows Media Player or PowerPoint.
- How can I produce Google Earth kmz files?
Ryan Pavlick of the Max Planck Institute for Biogeochemistry created an NCL script showing how to do this. See:
http://rpavlick.github.io/kmlncl
- How do I convert my multi-frame NCL graphics file to an MPEG movie file?
You can start with a PostScript (PS) file, and then use "convert" from the ImageMagick suite of tools to convert the PS file to an MPEG file.
First install the ImageMagick tools installed on your system. These are a suite of free tools from converting from one format to another.
You will also need to download the program "mpeg2encode". The source code for this can be downloaded from:
http://www.mpeg.org/
From here you want to download the source code for "mpeg2vidcodec". The "mpeg2encode" code is pretty straightforward to build (in the directory mpeg2/src/mpeg2enc).
Once you have mpeg2encode installed, you can convert your PS file to MPEG with:
convert file.ps file.mpg
- How do I include an encapsulated PostScript file from NCL in a LaTex document?
Let's say that you need to include an encapsuled postscript generated by NCL in your LaTeX document. If this image contains character strings, you may want them to be written in your own LaTeX style. Here is a solution contributed by Raphael Pierre, a PhD student at Fresnel Institute in France:
As an example, let's consider the x-axis label of some plot.
- Adapting the NCL source file.
A priori, no matter the font you specify in your .ncl file, just pick one.
res@tiXAxisFont = 21 ; Helvetica.Choose a dummy character (you'll have to reuse it afterwards) but avoid character strings.res@tiXAxisString = "a"The important step is the one that follows.res@tiXAxisFontQuality = "Low"This option forces NCL to include the font in the output file, the .eps image.To ensure this has been done correctly, open the .eps file with a text editor and check if a line like that:
%%DocumentFonts: Helveticaappears at the bottom. - Adapting the LaTeX source file.
Add the usual packages for including graphics (e.g. graphicx). Add the PSfrag package (available on CTAN and in usual LaTeX distros) which will permit you to replace the dummy character by the adequate string.
\usepackage{psfrag}Use the appropriate command.\begin{figure} \psfrag{a}{$x$} \includegraphics{figure.eps} \end{figure}And you're done.
Error messages and other issues
- When I send my NCL graphics to an X11 window, only a partial image is drawn.
We have seen issues with X11 on machines that have embedded Intel graphics processors. The behavior is that the plot is only partially drawn, and if you run the script several times back-to-back you may see the plot is drawn to varying/random levels of (in)completeness.
If you determine you have an Intel GPU on your machine, make sure you have their latest graphics drivers installed.
- When I run my script, I'm getting a "fatal:NclMalloc Failed" error message.
This message likely means the memory requirements of the variable(s) in an NCL script have exceeded the available memory on your machine. This can happen if you are trying to read or create very large arrays, or if you have lots and lots of variables.
Say, for example, there is 8 GB of available memory and there are two variables of type float (4 bytes) that have the following dimensions:
  x(ntim,nlat,mlon)      (1320,360,720)
  x: 1320*360*720       = 342144000 values
  x: bytes              = 342144000*4  = 1368576000 bytes (~1.37GB)

  y(ntim,klev,nlat,mlon) (1320,6,360,720)
  y: 1320*6*360*720     = 2052864000 values
  y: bytes              = 2052864000*4 = 8211456000 bytes (~8.21GB)
These two arrays require 9,580,032,000 bytes (~9.58 GB). This will lead to an error:
fatal:NclMalloc FailedPossible approaches:
- Read fewer 'time' steps and retain the spatial dimensions:
  x = f->X(0:ntim/2,:,:)   or   x = f->X(ntim/2:,:,)
  y = f->Y(0:ntim/2,:,:,:) or   y = f->Y(ntim/2:,:,:,:)
- Reduce the spatial dimensions:
  x = f->X(:,::2,::2)    or   x = f->X(:,::2,::4)
  y = f->Y(:,:,::2,::2)  or   y = f->Y(:,:,::2,::4)
If you don't have really big arrays, but you have created lots of variables in your script, then use delete to remove variables you no longer need:
   f = addfile("some_file.nc","r")
   T      = f->T
   P      = f->P
   QVAPOR = f->QVAPOR
   PH     = f->PH
   T      = T + 300.
   P      = P + f->PB
   QVAPOR = QVAPOR > 0.000
   PH     = ( PH + f->PHB ) / 9.81

   z      = wrf_user_unstagger(PH,PH@stagger)
   tk     = wrf_tk( P , T )    ; calculate TK
   delete([/PH,T/])

   slp    = wrf_slp( z, tk, P, QVAPOR )
   delete([/z,tk,P,QVAPOR/])
Note that several delete commands are used, rather than one big one at the end. This is so you can free up memory as you go, in case new calculations cause you to exceed your machine's memory limit.
- Read fewer 'time' steps and retain the spatial dimensions:
- When I run NCL, I get an error message about being unable to load the "System Resource File".
If your error message looks like this:
warning:Unable to load System Resource File /usr/local/lib/ncarg/sysresfile
warning:WorkstationClassInitialize:Unable to access rgb color database -
        named colors unsupported:[errno=2]
warning:["Palette.c":1533]:NhlLoadColormapFiles: Invalid colormap directory:
        /usr/local/lib/ncarg/colormaps
then you likely don't have your NCARG_ROOT environment variable set correctly.
If it looks like this:
warning:Unable to Get System Resource File Name?
warning:Unable to load System Resource File (null)
fatal:GetSysAppDir:Unable to get a default value for the system App Resource directory
then you likely don't have your NCARG_ROOT environment set at all.
NCARG_ROOT needs to be set to the root location of where the NCL software is installed. If you are not sure what NCARG_ROOT should be set to, type (on the UNIX command line):
which nclIf this returns (for example), "/usr/local/ncl/bin", then NCARG_ROOT should be set to /usr/local/ncl. See the section "Set the NCARG_ROOT environment variable" section on the NCL download page for more information.
- When I run NCL, I get an error message about the X driver, like "error opening display".
If your error message looks like this:
warning:GKS:GOPWK: --X driver error: DISPLAY environment variable not set
warning:GKS:GESC: --SPECIFIED WORKSTATION IS NOT OPEN
fatal:Workstation with PID#8 is not open
fatal:Unable to open Workstation-Can't Create
fatal:Unable to access object with id:-4
...
then this means that NCL is trying to open an X11 window on your screen, but your DISPLAY environment variable is not set. This is necessary in order to display any kind of X application to your screen.See the section "Set the DISPLAY environment variable" section on the NCL download page for information on how to set it.
- What's the deal with the error message "error: line -1 before or near..."?
If you get this error message when running an NCL script:
  fatal:syntax error: line -1 before or near

  ^

  fatal:error in statement
then you probably have a "begin" statement in your script, but no "end" statement. - How can I redirect NCL's error messages to another file?
You can add the following code near the top of your NCL script:
  err = NhlGetErrorObjectId()
  setvalues err
    "errFileName" : "my_script_errors"
  end setvalues
For more information about error reporting, see the documentation for NhlGetErrorObjectId. - How can I turn off NCL warning messages?
You can add the following code near the top of your NCL script:
  err = NhlGetErrorObjectId()
  setvalues err
    "errLevel" : "Fatal"          ; only report Fatal errors
  end setvalues
This will turn off all "warning" type messages, so only do this if you are feeling pretty confident about your code.For more information about error reporting, see the documentation for NhlGetErrorObjectId.
- I'm trying to list some files, and getting an error "Argument list too long".
If you are using something like NCL's systemfunc command to create a list of files.
  diri  = "/some/directory/path/"
  files = systemfunc("ls -1 " + diri + "sgp15swfcldgrid*")
and getting the following error:
sh: /bin/ls: Argument list too long
Then you can use one of the two methods instead:
files = systemfunc("cd "+diri+" ; echo sgp15swfcldgrid* | xargs ls") files = systemfunc("find " + diri + " -name 'sgp15swfcldgrid*' -print | xargs basename") - When I try to run ncl, I get an error about "libgfortran.so.x" not being found.
This can happen if your version of NCL was compiled with a different version of "gfortran" than what you have installed on your system.
To fix this, you can try one of these things:
- Make sure you downloaded the correct NCL for your system. For
Linux systems, we offer binaries compiled with different versions of
"gcc", so make sure you downloaded the correct one. See http://www.ncl.ucar.edu/Download/linux.shtml
for more information.
- Try to find the libgfortran.so.x file that it is
complaining about. If found, add this path to your LD_LIBRARY_PATH
(or DYLD_LIBRARY_PATH for MacOS) environment variable.
- For Linux systems, install the "compat-libgfortran" runtime
library. See one of these sites for starters:
- http://rpmfind.net/linux/rpm2html/search.php?query=compat-libgfortran-41
- https://admin.fedoraproject.org/pkgdb/acls/name/compat-libgfortran-41?_csrf_token=8a34a015d0f0b3ccca2627a1a58108960859779f
- Install the version of gfortran that your version of NCL was built
with. (It is possible to have multiple versions of gfortran installed
on the same system without conflict.)
For MacOS systems, you can use MacPorts to get gcc/gfortran. Enter "gcc" in the search box and look for packages called something like "gcc45", or "gcc46", depending on which version you need.
Once you install gcc/gfortran, it may then be necessary to set the LD_LIBRARY_PATH (or DYLD_LIBRARY_PATH for MacOS) environment variable to the path of the "libgfortran.so.x" file.
- If all else fails, send email to the ncl-install list.
- Make sure you downloaded the correct NCL for your system. For
Linux systems, we offer binaries compiled with different versions of
"gcc", so make sure you downloaded the correct one. See http://www.ncl.ucar.edu/Download/linux.shtml
for more information.
- I'm trying to compile my NCAR Graphics program using the Intel or gfortran compiler, but getting some undefined references.
If your undefined references contain the string "gfortran", like "_gfortran_copy_string", then you may need to link in "-lgfortran":
  ifort -O agex01.f -L/usr/local/lib -L/usr/X11R6/lib -lncarg -lncarg_gks \
        -lncarg_c -lXpm -lX11 -lXext -lgfortran
Note: if you use "ncargf77" or "nhlf77" to compile your programs, then you can modify these to include the extra libraries needed (and change the compiler if desired). Edit the files $NCARG_ROOT/bin/ncargf77 and $NCARG_ROOT/bin/nhlf77 with your favorite UNIX editor and first change the line:set fortran = "gfortran"
orset f77 = "gfortran"
to whatever Fortran compiler you are using, andset libextra = ""
orset extralibs = ""
to whatever additional libraries you might need, for example:set libextra = "-lgcc -lg2c"
orset libextra = "-lgfortran"
If you are getting some undefined references (like "s_cmp" or "s_copy") when you compile your NCAR Graphics program, then you may need to link in some additional compiler libraries.
For example, if your undefined references are "s_cmp", etc, then the additional system libraries should be "-lgcc -lg2c":
  ifort -O agex01.f -L/usr/local/lib -L/usr/X11R6/lib -lncarg -lncarg_gks \
        -lncarg_c -lXpm -lX11 -lXext -lgcc -lg2c
These librares may available through the "compat-g77" package. - When I run ncl version 5.2.0, I get an error "warning:ut_calendar: Invalid specification string."
NCL Version 5.2.0 was built against UDUNITS-2, V2.1.14. It needs to have the correct path to some UDUNITS xml files in order to work properly.
If you have the environment variable UDUNITS2_XML_PATH set to point to an different version of UDUNITS-2, then you may see this message. Try unsetting this environment variable with "unset" or "unsetenv".
- When I run ncl, I get an error about libpng not being current.
The "ncl" executable has several dependencies on the PNG library (libpng), and there may be a dependency on a shared version of this library. Most Linux and MacOS systems come with this library already installed.
In some cases, however, you may have an older version of this library on your system, and "ncl" may complain that it is not current enough.
We ran into one case where upgrading an Apple system from MacOS 10.5.2 to MacOS 10.5.8 solved the problem, because that caused the PNG library to be upgraded.
If you don't have this library, then it is fairly simple to build and install if you have a C compiler, or you can download an already compiled library for your system. First check with your system administrator about upgrading your version of this library.
To get an updated version yourself:
- Go to http://www.libpng.org/pub/png/libpng.html
and either download a precompiled binary, or the source code (the
".tar.gz" file under "with config script").
- For instructions on building from source code, go to:
http://www.ncl.ucar.edu/Download/build_from_src.shtml#PNG
- Go to http://www.libpng.org/pub/png/libpng.html
and either download a precompiled binary, or the source code (the
".tar.gz" file under "with config script").
- I'm getting an error from WRAPIT about being unable to find "-lgfortran".
On LINUX and MacOS systems, WRAPIT will use the gfortran compiler by default. On some systems, the gfortran library (libgfortran.a) may be installed in a location that can't be automatically "seen" by WRAPIT. You can use the UNIX "locate" command to find the gfortran library, and the the "-L" option with WRAPIT to indicate where it is.
For example, if:
locate libgfortran.a
returns:/usr/lib/gcc/x86_64-redhat-linux/4.1.1/libgfortran.a
then your WRAPIT command will look like this:WRAPIT -L /usr/lib/gcc/x86_64-redhat-linux/4.1.1 yourfile.f
- I'm getting a strange "workspace reallocation" error message.
If you get an error message that looks something like this:
    fatal:ContourPlotDraw: Workspace reallocation would exceed maximum size
    16777216
    fatal:ContourPlotDraw: draw error
    fatal:ContourPlotDraw: draw error
    fatal:PlotManagerDraw: error in plot draw
    fatal:_NhlPlotManagerDraw: Draw error
then you need to bump up your workspace size. First, retrieve the default "workspace id", and then set the "wsMaximumSize" resource to a value larger than 100000000, the default value. To do this, add the following code right after you create a workstation:setvalues NhlGetWorkspaceObjectId() "wsMaximumSize" : 300000000 end setvalues
You can permanently bump up the workspace size by setting this resource in your ~/.hluresfile:*wsMaximumSize : 300000000
You may also need to play with the 300000000 value. This is just a first guess.If you are drawing a contour plot, you might instead try switching to raster contouring, by setting the resource "cnFillMode" to "RasterFill".
- I am trying to create a contour plot and getting an error about the scalar field being constant.
If you see this error message:
warning:ContourPlotInitialize: scalar field is constant; ContourPlot not possible:[errno=1102]
it's because you are either 1) trying to contour an array that is all equal to the same value or 2) trying to contour an array that's a mix of one value and missing values. There is currently no way to generate contours from the first case, but if you have the second case, then you can use a work-around of setting the missing values to a valid value, thus giving you two valid values that you can contour.
See example "conLev_4.ncl" on the contour levels page.
- I am trying to create a contour plot and getting errors about sfXArray and sfYArray having an incorrect dimension size.
If the error looks like this:
warning:ScalarFieldSetValues: 2d coordinate array sfXArray has an incorrect dimension size: defaulting sfXArray
warning:ScalarFieldSetValues: 2d coordinate array sfYArray has an incorrect dimension size: defaulting sfYArray
Then it may be that you are calling one of the gsn_csm_contour_xxxx plotting scripts, which try to add a longitude cyclic point by default. You can turn this off by setting gsnAddCyclic to False.
- I'm getting a warning, "ContourPlotSetValues: Data values out of range of levels set by EXPLICITLEVELS mode".
This warning is telling you that the explicit contour levels you chose are not in the same range of your data. You need to look at the levels you are choosing (via the cnLevels resources) and compare them with the minimum / maximum of the data you are trying to plot, to make sure the range of the levels and your data intersect at some point.
Use the printMinMax procedure to check the min/max of your data.
- I'm getting an "ARSCAM/ARPRAM ALGORITHM FAILURE" error message.
This bug was fixed in version 5.2.1 for a large percentage of NCL scripts, but we occasionally see this bug creep up in newer versions of NCL in special cases. If you do run into it with a newer version of NCL, please keep reading for suggestions.
This bug is usually caused by a precision error in our low-level contouring algorithm. It seems to occur when you have very "twisty" contours in a small area, like in a panel plot. It is also more likely happen when you are drawing filled contours using the default "area fill" mode.
One thing you can try as a work-around is to fill the contours using "raster fill" mode instead:
res@cnFillMode = "RasterFill"
In addition, you can smooth the raster contours, making them closer in appearance to area-filled contours:res@cnRasterSmoothingOn = True
Unfortunately, if you need "area fill", there's no instant fix for this. We found that if you tweak certain things, like the rotation of your plot (mpCenterLonF), the size of the plot (vpWidthF/vpHeightF), or the contour levels themselves, you might be able to get rid of this error message.
There's a more detailed and low-level description.
We are interested in hearing from folks who run into this problem and for whom the above suggestions don't help. You can help us debug the problem by sending email to the ncl-talk@ucar.edu list (you must subscribe first) and providing us with the smallest script possible that shows the problem and the data.
- I'm getting the error message "PLCHHQ - CHARACTER NUMBER 10 (w) IS NOT A LEGAL FUNCTION CODE".
This is happening because you are using a character in a plot text string that is a reserved function code character. The default function code is a colon (':').
You've probably forgotten to download this ".hluresfile" file and put it in your home directory. It will set the function code to the tilde ('~') character.
- I'm getting the error "fatal:NhlCvtStringToEnum: Unable to convert string".
This fatal message occurs when you are setting a resource that expects a certain set of string values, and you give it something invalid.
For example, the mpProjection resource only recognizes a fixed set of values, like "LambertConformal", "Stereographic", or "Mercator", to name a few. If you try to set it to "IAmTheBest", you will get this error.
- I'm getting an error from the "shea_util.ncl" script about "copy_VarCoords" being an undefined procedure.
If you are seeing this error:
  fatal:syntax error: line 3200 in file $NCARG_ROOT/lib/ncarg/
  nclscripts/csm/shea_util.ncl before or near \n
     copy_VarCoords(x, advect)
  ---------------------------^
  fatal:syntax error: possibly an undefined procedure
  fatal:Syntax Error in block, block not executed
then you probably simply need to swap the order that "contributed.ncl" and "shea_util.ncl" are loaded. Make sure "contributed.ncl" is loaded first:load "$NCARG_ROOT/lib/ncarg/nclscripts/csm/contributed.ncl" load "$NCARG_ROOT/lib/ncarg/nclscripts/csm/shea_util.ncl"
- When running a script with overlaid plots, I'm getting an error "cannot draw Plot Member".
If your error message looks something like this:
warning:NhlDraw: cannot draw Plot Member, ID 11, independently
Then you are probably trying to draw a plot that has been overlaid on another plot. For example, the following code would cause this error:. . . wks = gsn_open_wks("x11","test") res = True res@gsnDraw = False res@gsnFrame = False contour_line = gsn_csm_contour(wks,z1,res) res@cnFillOn = True contour_fill = gsn_csm_contour(wks,z2,res) overlay(contour_fill,contour_line) draw(contour_line) ; contour_line is now an "overlay" plot, and ; can't be drawn individually. frame(wks)The above draw command needs to be:draw(contour_fill)
If you need to draw "contour_line" by itself, then you will need to do this before the overlay call:. . . res = True res@gsnDraw = False res@gsnFrame = False contour_line = gsn_csm_contour(wks,z1,res) res@cnFillOn = True contour_fill = gsn_csm_contour(wks,z2,res) draw(contour_line) frame(wks) overlay(contour_fill,contour_line) draw(contour_fill) frame(wks)
- When I use NCL's systemfunc on a X/Cygwin system, I get the error "cannot create child process".
This problem was originally reported in ncl-talk:
http://www.ncl.ucar.edu/Support/talk_archives/2008/1642.html
Vladyslav Lyubartsev was kind enough to post a solution to this problem:
The solution has been found here:
http://www.mylifestartingup.com/2009/04/fatal-error-unable-to-remap-to-same.html
- Close out of Cygwin (and all Cygwin processes).
- Open a Windows command prompt (start -> run - > type 'cmd' or on vista : start -> type 'cmd' in the start search window)
- Go to your cygwin bin directory. For me it is c:\cygwin\bin.
- Type 'ash'
- Type '/usr/bin/rebaseall'
- Resolve any errors (I had a warning that went unresolved and it still worked fine)
- Reboot...and you should be good.
- When I compile an NCAR Graphics program, I get errors about undefined symbols like "_png_set_rows", "_png_destroy_write_struct", "_png_malloc", etc.
If you are building against a pre-compiled set of NCAR Graphics libraries, then these libraries were likely built with PNG support built in. This gives you the ability to have direct PNG output.
However, it also means that you must include the PNG library ("-lpng") and "-lz" at the end of your application's compile line.
You can either build NCAR Graphics from source code yourself, without "png" support, or you can build and install the PNG library yourself. The latter is much easier.
See the next question for more information about building the PNG library. Once you have the library, add "-lpng -lz" to the end of the compile line that contains all the NCAR Graphics libraries.
- When I use "ncargex" or "ncargf77", I get an error "cannot find -lpng".
NCAR Graphics has an internal PNG driver, and hence NCAR Graphics programs require the PNG library to be linked in.
You might already have the PNG library on your system. Look for files called something like "libpng.a", "libpng.so", or "libpng.dylib" (for Macs).
If you don't have this library, then it is fairly simple to build and install if you have a C compiler, or you can download an already compiled library for your system.
- Go to http://www.libpng.org/pub/png/libpng.html
and either download a precompiled binary, or the source code (the
".tar.gz" file under "with config script").
- For instructions on building from source code, go to:
http://www.ncl.ucar.edu/Download/build_from_src.shtml#PNG
Note that "/usr/local" is just an example here, use whatever installation path you want.
- If you are using "ncargcc" or "ncargf77" to compile your program,
then edit each of the files "ncargcc", "ncargf77", and "ncargf90" in
$NCARG_ROOT/bin and add "-L/path/to/libpng " to the front of
"-lpng", where /path/to/libpng is the location of this library
on your system. For example, if it's in "/usr/local/lib", then change
the line:
set pnglib = "-lpng -lz"toset pnglib = "-L/usr/local/lib -lpng -lz"
- Go to http://www.libpng.org/pub/png/libpng.html
and either download a precompiled binary, or the source code (the
".tar.gz" file under "with config script").
- I'm trying to assign a value to an NCL variable, but getting a "right hand side can't be coerced to type of left hand side" error message.
If you see this when you run your NCL script:
fatal:Assignment type mismatch, right hand side can't be coerced to type
      of left hand side
this means that you are trying to assign the wrong type of value to an NCL variable that already exists. For example, you will see this error message if you do this:x = 1 x = 5.
because a floating point value can't be assigned to an integer variable. This is to protect the user against possible data loss. To do the above, use floattointeger:x = 1 x = floattointeger(5.)
There are many other conversion routines. - I'm calling NCL from a shell script and getting a fatal error on line -1.
If you are calling NCL from a C-shell, bash shell, or some other shell script, and it's exiting with the error:
fatal:syntax error: line -1 before or near .
then you may need to include an "exit" statement right at the very end of your NCL script to make sure it terminates properly. We are considering this a bug and hope to fix it sometime.
- I'm getting an "MDRGSF/MDRGOF - ERROR OPENING RANGS/GSHHS CAT FILE" error message.
If you are trying to draw maps with NCL and getting the following error message:
  fatal:MapRGDHDrawMapList: MDRGSF/MDRGOF - ERROR OPENING RANGS/GSHHS CAT FILE
  fatal:PlotManagerDraw: error in plot draw
  fatal:_NhlPlotManagerDraw: Draw error
then this means you are trying to use the high-resolution map database (res@mpDataBaseVersion = "HighRes"), but you haven't downloaded the necessary map database files.For information on how to get the database, go to the page on high-resolution coastlines.
- I'm trying to draw primitives (markers, lines, polygons) on my plot, and getting an error essage "tfPolyDrawList element 0 is invalid".
If you are using one of the gsn_add_polyxxx functions to add primitives to your plot, and seeing one or more error messages:
warning:TransformPostDraw: tfPolyDrawList element 1 is invalid
warning:TransformPostDraw: tfPolyDrawList element 2 is invalid
then this most likely means that the variable being used to hold the return value from this function is not unique. For example, the following code will produce this error message, because the second usage of "dum" will cause the first usage of "dum" to be clobbered:dum = gsn_add_polyline(wks,plot,x,y,lnres) dum = gsn_add_polymarker(wks,plot,x2,y2,mkres)
To fix the above code, you need to use unique variables for both calls:dum1 = gsn_add_polyline(wks,plot,x,y,lnres) dum2 = gsn_add_polymarker(wks,plot,x2,y2,mkres)
It is also important to note that variables holding return values from one of the gsn_add_polyxxx functions must live for the duration of the script. So, if the primitive function calls are inside a function, you need to make sure their return values "live" outside the function. You can do this by returning the variable as an attribute of the return variable:function add_primitives_to_plot(wks,plot) local i, nlines, x1, y2, lnres begin ;---Assume we want to add four lines to the plot nlines = 4 dum = new(nlines,graphic) lnres = True ... do i = 0,nlines-1 x1 = ... y1 = ... dum(i) = gsn_add_polyline(wks,plot,x1,y1,lnres) end do ... plot@dum = dum return(plot) end
Another way to do this that doesn't require preallocating a "dum" graphic array is to use the unique_string function to return a unique name. You can then use this as a unique variable name, and attach it directly to "plot" using the special $...$ syntax:
  do i = 0,nlines-1
    x1 = ...
    y1 = ...
    tmpstr = unique_string("dum")   ; "dum1", "dum2", ...
    plot@$tmpstr$ = gsn_add_polyline(wks,plot,x1,y1,lnres)
  end do
or
do i = 0,nlines-1 x1 = ... y1 = ... plot@$unique_string("dum")$ = gsn_add_polyline(wks,plot,x1,y1,lnres) end do - When I call one of the gsn_csm_xxxx_map plotting scripts, I get an error message about a units attribute not being correct.
If you are using one of the gsn_csm_xxx_map functions to overlay data on a map, and seeing one or both of the following error messages:
    (0)   is_valid_lat_ycoord: Warning: The units attribute of
    the Y coordinate array is not set to one of the allowable
    units values (i.e. 'degrees_north'). Your latitude labels
    may not be correct.

    (0)   is_valid_lat_xcoord: Warning: The units attribute of
    the X coordinate array is not set to one of the allowable
    units values (i.e. 'degrees_east'). Your longitude labels
    may not be correct.
then this means that your data contains coordinate arrays, but the coordinate arrays either don't have the necessary "units" attribute, or it's not set to one of the allowable values ("degrees_east" for longitude values and "degrees_north" for latitude values).If your coordinate arrays are indeed degrees east and degrees north, then you can set the units attribute as follows (this code snippet assumes your data array is called "data" and that the coordinate arrays are called "lat" and "lon"):
  data&lat@units = "degrees_north"
  data&lon@units = "degrees_east"
- I'm trying to create a contour, vector, or contour plot, and getting a weird error about spline approximation.
If you see this error:
     warning:_NhlCreateSplineCoordApprox: Attempt to create spline
     approximation for Y axis failed: consider adjusting trYTensionF value
     warning:IrTransInitialize: error creating spline approximation for
     trYCoordPoints; defaulting to linear
then this usually means that your X or Ycoordinate array values are spaced irregularly enough such that NCL can't figure out how to "interpolate" them to a linear axis. This error is most commonly seen when there are gaps in the coordinate variable; for example, if you have data only over the poles, and not in the tropical region.
One possible solution is to zoom in on your data such that the coordinate arrays of the zoomed in portion are more "regular". You can use coordinate subscripting to accomplish this.
Another possibility is that your longitude coordinate array is not cyclic, but you are trying to plot a global map. In this case, you may need to set gsnAddCyclic to False.
- When I print something in NCL, I get an error about my PAGER environment variable.
If you see an error like this:
warning:Error Forking pager check PAGER environment variable and restart, continuing using "more"
This is probably due to your PAGER environment variable being set to something NCL doesn't recognize. A work-around is to set the NCL_NO_SYSTEM_PAGER environment variable.From csh/tcsh:
setenv NCL_NO_SYSTEM_PAGER
From bash/ksh/sh:
export NCL_NO_SYSTEM_PAGER=
- When I print something in NCL, I get an error about my PAGER environment variable.
Memory issues
- What's the biggest array that NCL can allocate?
As of version 6.0.0 of NCL, you can create variables larger than 2 GB on a 64-bit system. Of course, you may be limited by the memory on your machine.
On a 32-bit system, NCL is limited to creating arrays whose dimension sizes can be represented by a C signed integer (32-bit integer). This means that you can only allocate up to 2 GB [(2^31)-1] bytes of total memory, regardless of how much memory you have on your machine.
The type of the NCL variable that you are creating also figures into the size. For example, each integer or float value takes up 4 bytes, so if you want to create a float or integer array on a 32-bit system, the largest one you can create is ((2^31)-1)/4.
For a double array, this is further reduced to a size of ((2^31)-1)/8.
- I'm running into a memory issue when I create lots of strings.
If you create strings in NCL, the memory for them never gets freed internally, even if you delete them. If you create lots of strings (and we do mean a lot), then, you may run into memory problems or notice an increased slow down as the script progresses.
NCL permanently (by design) stores every unique string it encounters in a hash table and assigns it a unique integer id, which is passed around instead of a pointer reference to the string itself. This simplifies programming for tasks such as string comparison. In the usual case for NCL, this has worked pretty well.
Unfortunately, there is a drawback to this approach. Let's say you have a do loop that is executed many times (like 2 million). Further assume that inside this loop, you build up strings from small components and that each of these strings is unique.
As you go through this big loop, we have found that the virtual memory required to hold these unique strings tends to grow, and as the hash table gets larger, it takes more and more processing time to distinguish each string as unique or not. Using performance monitoring tools we found that in one case, when a string-intensive program first started, it was spending about 25% of its time locating strings in the hash table. That had grown to 85% of the time towards the end of the loop.
We have been doing some research into fixing this quirk, but meanwhile, the best we can do is to suggest trying to find ways around having to create a lot of unique strings. Email ncl-talk@ucar.edu if you have any concerns or questions about this.
Documentation
- Is there a way I can download the NCL website documentation so I can access it locally on my machine?
TJ Onley pointed out this nice solution. For example, if you just want to download the files under http://www.ncl.ucar.edu/Document, use:
wget -r -l0 -p -np -nH -k http://www.ncl.ucar.edu/Document/
This will create a directory called "Document", and in that directory, you can open the "index.shtml" file with your web browser and have access to all the files locally.
- Where can I see a list of all the NCL resources?
Here's a list of resources by category. There is also an alphabetical list, but this can be hard to browse.
- Where can I see a list of all the NCL functions and procedures?
See the alphabetical list of NCL functions and procedures.
The functions and procedures can also be viewed by category (i.e. "graphics routines", "interpolation"), and by type (that is, whether it's a built-in function, a "contributed.ncl" function, etc).
- Where can I see a list of links to dash patterns, marker styles, color tables, etc?
Follow the popular links on the left side of any NCL page.
Miscellaneous
- How should I cite NCL?
To cite NCL in a publication, please include the DOI and a link to it, if possible:
   The NCAR Command Language (Version 6.0.0) [Software]. (2012).
   Boulder, Colorado: NCAR/CISL/VETS. doi:10.5065/D6WD3XH5
You will need to update the version and year as appropriate.
- How can I add a logo to an NCL plot?
If the logo you want to add is in an image file, like "xxx.jpg" or "xxx.png", then you can attach it to an NCL PS, PDF, or PNG image using ImageMagick's "composite tool.
The "composite" command can be called from inside an NCL script using NCL's system call. See example "logo_4.ncl" on the "Logos" example page.
- How do I call a C or Fortran function or procedure from NCL?
For Fortran functions, there's a useful script called WRAPIT which uses wrapit77 to generate the wrapper function, and it also figures out what kind of system you're on and generates the shared object for you. For more information, see the WRAPIT documentation.
For C routines, you can use an application called wrapit77 which generates a C wrapper that you then compile and link with the "ld" command to create a shared object. For more information about wrapit77 and some examples on how to use it, go to the "Incorporating your own Fortran or C code" section in the Getting Started Using NCL manual.
- How do I make sure that a C/Fortran routine I want to wrap doesn't conflict with a routine that might already be part of NCL?
If you're using WRAPIT to wrap a subroutine, you need to make sure that the name of your subroutine doesn't have the same name as a routine name used by the "ncl" executable.
It's a good idea, then, to stay away from common names like "average" or "gamma". If your routine has the same name as an NCL routine, then your wrapped subroutine may not work properly.
To check that your subroutine name is not already part of the ncl executable, you can use the "nm" command. For example, say you want to use "gamma" as your function name. To check if "gamma" is already used by NCL:
nm $NCARG_ROOT/bin/ncl | grep -i gamma
You will see some output like:
    0000000100283a28 T _dgammaslatec_
    00000001002b30df T _dsgamma_
    0000000100272ed2 T _gamma_
    0000000100dd1db3 t _gammafn
    000000010014f5e1 T _gammainc_W
    00000001001a3ed3 T _random_gamma_W
                     U _tgamma
The "T" before the name means there's a routine with that name in the ncl executable. The underscores should be ignored, as they are added internally by the compilers. From this list you can see there's a routine called "_gamma_". Hence "gamma" is already a used name.
If you rename yours to something like "mygamma", or "gamma2", you will be fine.
- How do I fix buffering issues with NCL?
If you are running an NCL script that echoes output to your screen, but are seeing issues with the output not showing up until the script is finished, then you can try a couple of things:
Use the "tee" command:
ncl program.ncl | tee program.out
If on a Linux machine, try the Linux program "unbuffer":unbuffer ncl program.ncl >> output.txt 2>&1 &
- If I obscure an NCL X11 window with another application, the X11 window doesn't refresh when I bring it back to the foreground.
This is possibly due to an X11 backing store problem. If you run the command:
xdpyinfo | grep backing
and the output is similar to:options: backing-store NO, save-unders NO
then you will need to enable backing store in your X server configuration.There are different ways to do this, depending on what kind of system you're on. On a Linux system, try inserting the line:
Option "backingstore"
in the Device section of your X server configuration file (normally /etc/X11/XF86Config or /etc/X11/XF86Config-4). Alternatively, you can run your X server with the option "+bs" to obtain the same result without editing your configuration file. Restart your X server, then run the dpyinfo command again to verify that backing store is now enabled.On a PC running Hummingbird, run Exceed's "xconfig" program. In the xconfig menu, double-click on "Performance". Make sure "Save Unders" is checked, set "Maximum Backing Store" to "Always", set "Default Backing Store" to "When Mapped", and set "Minimum Backing Store" to "When Mapped".
- Adapting the NCL source file.