NCL > What's New
What was added in previous releases of NCL
6.6.1 |
6.6.0 |
6.5.0 |
6.4.0 |
6.3.0 |
6.2.1 |
6.2.0 |
6.1.2 |
6.1.1 |
6.1.0 |
6.1.0-beta |
6.0.0 |
6.0.0-beta |
5.2.1 |
5.2.0 |
5.1.1 |
5.1.0 |
5.0.0 |
4.3.1 |
4.3.0 |
a034 |
a033 |
a032 |
a031 |
a030 |
a029 |
a028 |
a027 |
a026 |
a025 |
a024 |
a023 |
a022 |
a021 |
a020 |
a019 |
a018 |
a017 |
a016 |
a015 |
a014 |
a013 |
a012 |
a011 |
a010 |
a009 |
a008 |
a007 |
a006 |
a005 |
[current release - 6.6.2]
Version 6.6.2
February 28, 2019
Version 6.6.2 is the current
version of NCL.
Go to the download
page for information on downloading this version.
Versions 6.6.0 and 6.6.1
Versions 6.6.0 and 6.6.1 were not officially released due to some internal bugs that were fixed in version 6.6.2.
Version 6.5.0
July 16, 2018
- New functions for task parallelism
- New functions
- New "elseif" statement
- New profiler command line option
- NCL scripts that are now preloaded
- New resources
- New color tables
- Graphics enhancements
- Function enhancements
- Other enhancements
- Function and procedure bugs fixed
- Graphics bugs fixed
- Other bugs fixed
New functions for task parallelism
This version contains two new functions that enable NCL scripts to execute multiple independent tasks in parallel. The tasks can be any operation that can be invoked from a UNIX command line. One example might be using an NCL driver script to execute a series of other NCL scripts in parallel.
- subprocess - this is the main function which takes as input the shell command to execute.
- subprocess_wait - checks the finish status of a concurrent process launched by subprocess.
For examples of using these functions, see the task parallelism examples page.
New Functions
- dim_pad_extend - extends (i.e.,
expand, append, pad) an existing array along the 'record dimension' to
a user specified size.
- dim_pad_modulo - pads (i.e.,
expand, append, extend) an existing array such that the size of a
specified dimension is a user specified 'modulo' length.
- enthalpy - computes
atmospheric enthalpy.
- esacr_n - computes sample auto-correlations on
the given dimension.
- exponential_curve_fit -
calculates the coefficients for a simple exponential curve fit of the
form ' y = A*exp(B*x)' using least squares.
- geolocation_circle - creates
latitudes and longitudes that define concentric circles at user
specified distances from a central location.
- get_bitfield - unpacks bit fields from an array.
- Several new file I/O query functions were added for consistency purposes and more meaningful names:
- getfileatts - alias for getvaratts (only allows a file pointer)
- getfiledimnames / getfiledims - alias for getvardims (only allows a file pointer)
- getfilevardimnames - alias for getfilevardims
- getvardimnames - alias for getvardims
- getvardimsizes - alias for dimsizes
- isconform - checks two variables for array
conformance (same shape and size).
- keyword_values -
reads a text file that contains keywords and associated values (similar to fortran NAMELIST).
- tlcl_evp_bolton - computes
the lifting condensation level temperature using water vapor pressure.
- tlcl_mixr_bolton - computes
the lifting condensation level temperature using mixing ratio and
pressure.
- tlcl_rh_bolton - computes
the lifting condensation level temperature using relative humidity.
- tlcl_td_bolton - computes
the lifting condensation level temperature using dew point
temperature.
- mixhum_convert - converts
mixing ratio to specific humidity or vice-versa.
- pot_temp_equiv_tlcl -
computes equivalent potential temperature using the lifting
condensation temperature.
- regline_weight - calculates
the linear regression coefficient between two series where the
dependent (y) variable's values are weighted by some measure of
uncertainty (typically, standard deviations) such that the Chi-square
goodness-of-fit is minimized.
- refevt_hamon - uses the Hamon
formulation to derive reference evapotranspiration.
- str_match_bool
/ str_match_bool_ic - returns a logical array of
True/False/Missing indicating where the input array of strings contain
the given substring.
- simple_legend_ndc - creates a
legend in NDC space based on user supplied resources. Similarly
to simple_legend,
simple_legend_ndc
gives the user complete control over the design and placement of the
legend, and can be seen as an easier way to create legends in NCL.
- static_energy_atm -
computes the atmospheric moist and dry static energy.
- temp_virtual -
computes atmospheric virtual temperature.
- unwrap_phase - unwraps
(correct) phase angles to produce smoother phase plots.
- zscore - computes the zscore
of a variable's given dimensions at all other dimensions and retains
metadata.
New "elseif" statement
This version will have the long-requested "elseif" statement!
The old way of using "else if" required you to have an "end if" for every "else if" statement:
  a = 5
  if (a.eq.1) then
    a = a + 1
  else if (a.eq.2) then
    a = a + 2
  else if (a.eq.3) then
    a = a + 3
  else if (a.eq.5) then
    a = a + 5
  else
    a = -1
  end if
  end if
  end if
  end if
  print("a = " + a)
The new way, with the use of "elseif" (no spaces) looks like this:
  a = 5
  if (a.eq.1) then
    a = a + 1
  elseif (a.eq.2) then
    a = a + 2
  elseif (a.eq.3) then
    a = a + 3
  elseif (a.eq.5) then
    a = a + 5
  else
    a = -1
  end if
  print("a = " + a)
The old way will still work, and both codes above should return:
a = 10
New profiler command line option Examples coming soon. Stay tuned...
Preloaded NCL scripts
Several NCL scripts are now preloaded, and you no longer need to explicitly load them at the top of your own scripts. Here's a full list of the preloaded scripts:
    "$NCARG_ROOT/lib/ncarg/nclscripts/csm/gsn_code.ncl"
    "$NCARG_ROOT/lib/ncarg/nclscripts/csm/gsn_csm.ncl"
    "$NCARG_ROOT/lib/ncarg/nclscripts/csm/contributed.ncl"
    "$NCARG_ROOT/lib/ncarg/nclscripts/csm/shea_util.ncl"
    "$NCARG_ROOT/lib/ncarg/nclscripts/esmf/ESMF_regridding.ncl"
    "$NCARG_ROOT/lib/ncarg/nclscripts/csm/bootstrap.ncl"
    "$NCARG_ROOT/lib/ncarg/nclscripts/csm/extval.ncl"
    "$NCARG_ROOT/lib/ncarg/nclscripts/csm/crop.ncl"
    "$NCARG_ROOT/lib/ncarg/nclscripts/csm/heat_stress.ncl"
    "$NCARG_ROOT/lib/ncarg/nclscripts/wrf/WRFUserARW.ncl"
It's perfectly fine to continue loading one or more of these scripts, even if NCL is preloading them.
In most cases you will not notice but loading these scripts does take a few tenths of a second. In certain situations where you want to run many very short scripts the resulting overhead may cause a significant slowdown of your work flow. For this case, a new command line option, '-s', allows you to start NCL without preloading any scripts.
New resources
- gsnShadeFillDotSizeF - allows you to
set the dot size if you are using stippling fill when
calling gsn_contour_shade.
- gsnShadeFillScaleF /
gsnShadeFillScales - allows you to set
the fill scales for pattern fill when
calling gsn_contour_shade.
See example "wavelet_3.ncl" on the Contour effects page.
- tmGridDrawOrder - allows you to
control the draw order for the tick mark grid lines.
See example "leg_650_10.ncl" on the Legends page.
New color tables
NCL V6.5.0 has 29 new color maps added.
The table below contains a suite of color maps for vegetation.
- NEO_xxxx - these four color maps come from
NASA's Earth
Observatory website
- NOC_ndvi - from
NASA Ocean Color
website
- vegetation_ClarkU - contributed by Clark Labs /
Clark University
- vegetation_modis - contributed by the vegetation team at the NOAA Joint Polar Satellite System Program Office.
| NEO_div_vegetation_a | 
| NEO_div_vegetation_b | 
|
| NEO_div_vegetation_c | 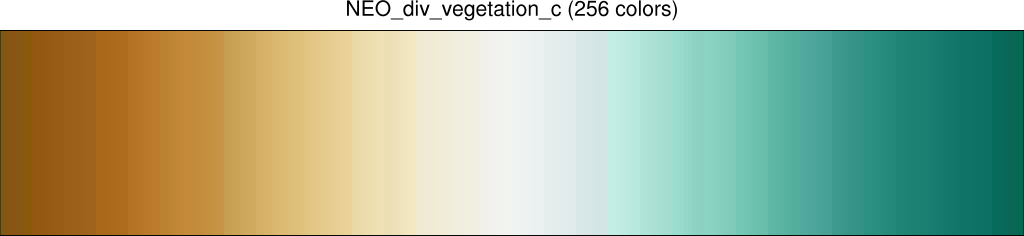
| NEO_modis_ndvi | 
|
| NOC_ndvi | 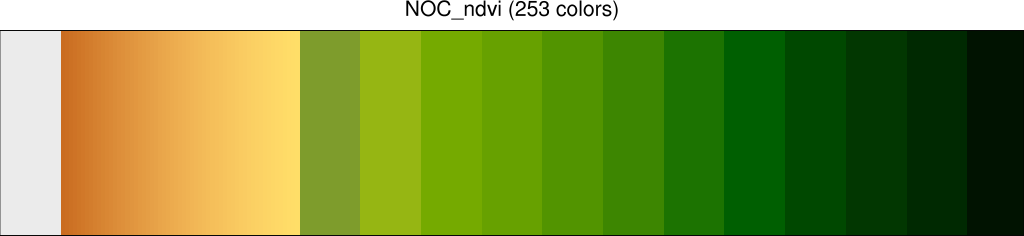
| vegetation_ClarkU | 
|
| vegetation_modis | 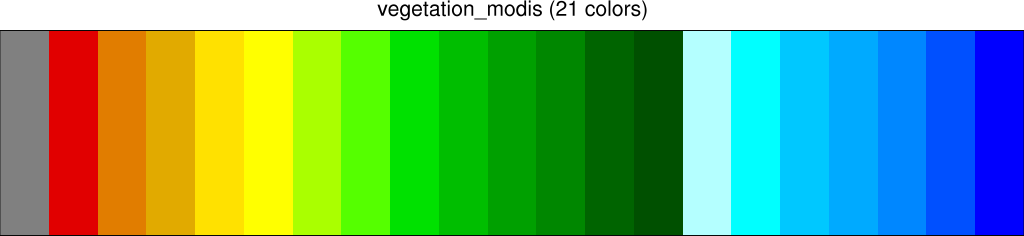
| Click on color map name or color bar for more information or larger image. | |
The table below contains a matplotlib suite of color maps for oceanography. Thanks to Sam McClatchie of NOAA for the suggestion.
| cmocean_algae | 
| cmocean_amp | 
|
| cmocean_balance | 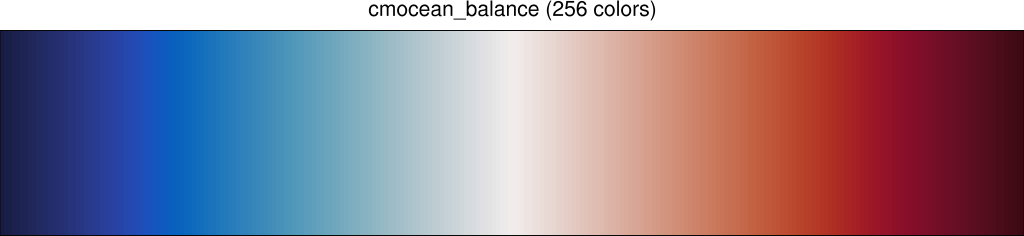
| cmocean_curl | 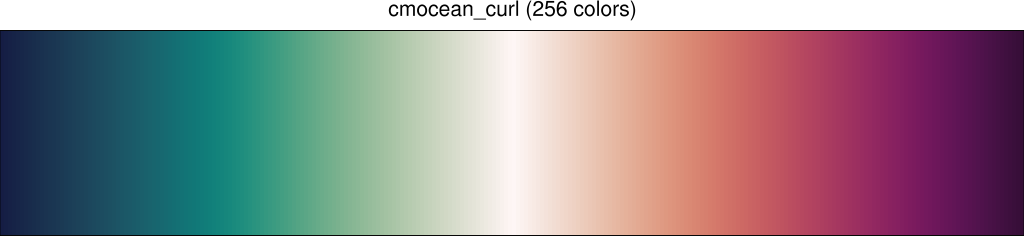
|
| cmocean_deep | 
| cmocean_delta | 
|
| cmocean_dense | 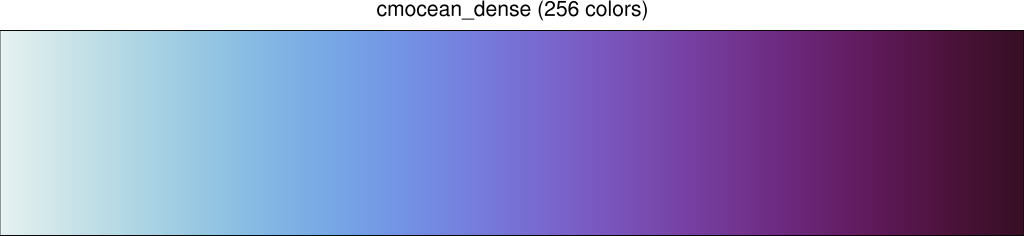
| cmocean_gray | 
|
| cmocean_haline | 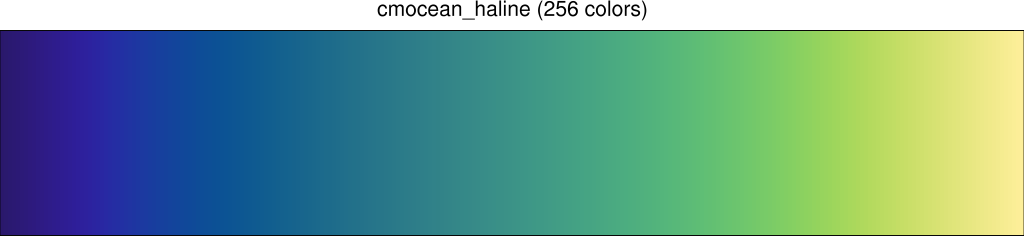
| cmocean_ice | 
|
| cmocean_matter | 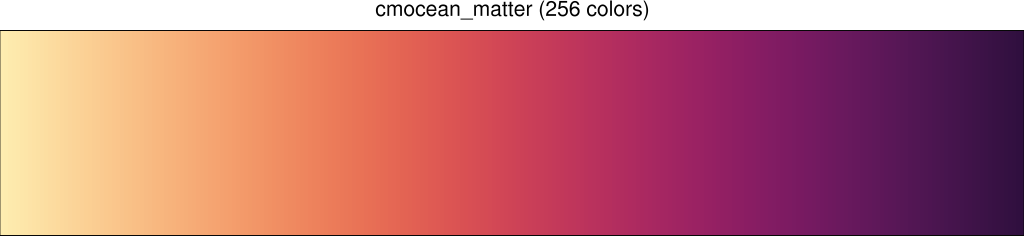
| cmocean_oxy | 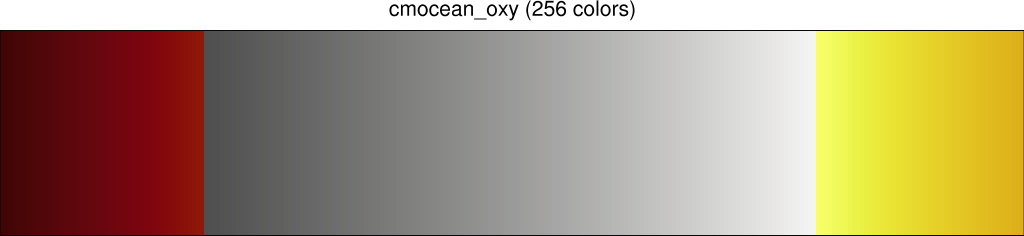
|
| cmocean_phase | 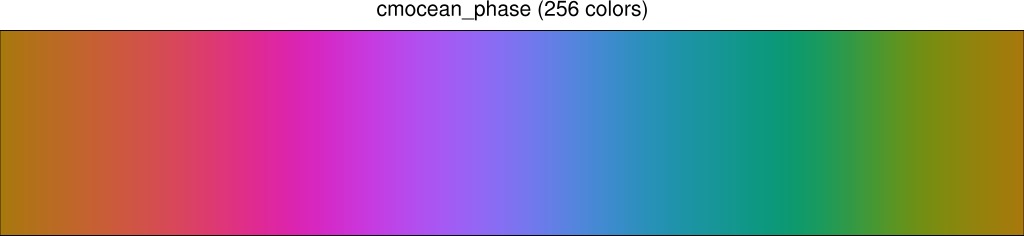
| cmocean_solar | 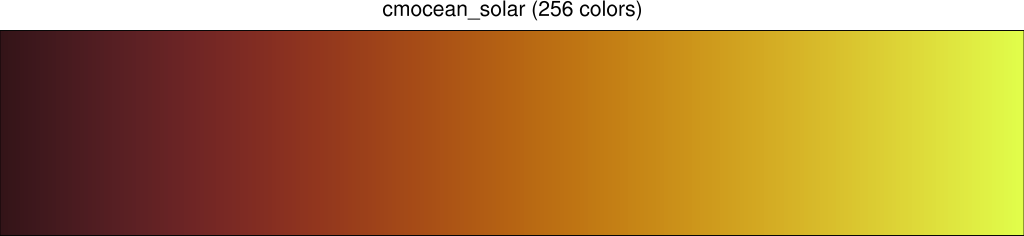
|
| cmocean_speed | 
| cmocean_tempo | 
|
| cmocean_thermal | 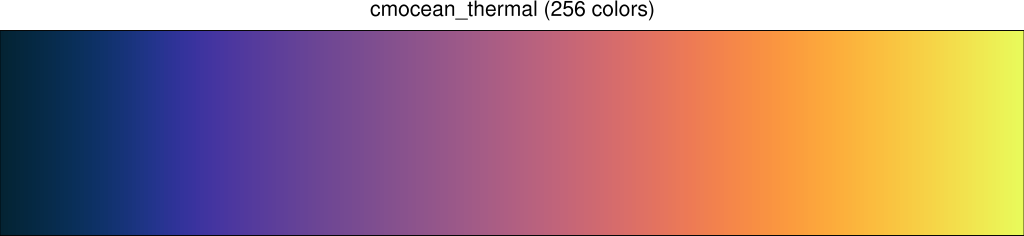
| cmocean_turbid | 
|
| Click on color map name or color bar for more information or larger image. | |||
The table below contains four random color maps:
- srip_reanalysis - selected by
the SPARC reanalysis
intercomparison project group for reanalysis comparisons. This
group carefully selected colors so that groups of reanalyses worked
well and so colorblind people could use it. The idea is that papers
will have these colors for time-series comparisons. Thanks to Cathy
Smith (NOAA/ESRL PSD and CU CIRES) for bringing it to our attention.
- UKM_hadcrut - from the UK Met Office
- GSFC_landsat_udf_density -
from NASA's
Landsat Science "undisturbed forests"
- drought_severity - a drought severity color map
| srip_reanalysis | 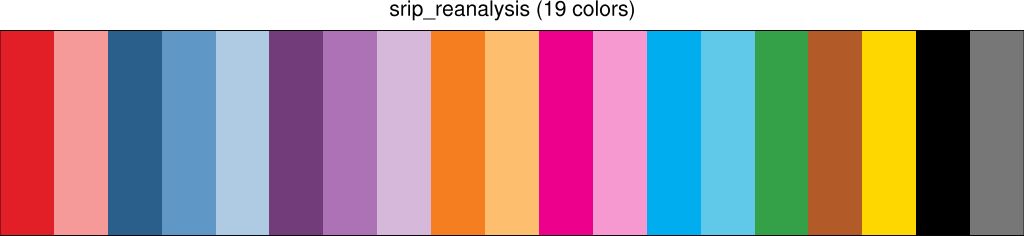
| UKM_hadcrut | 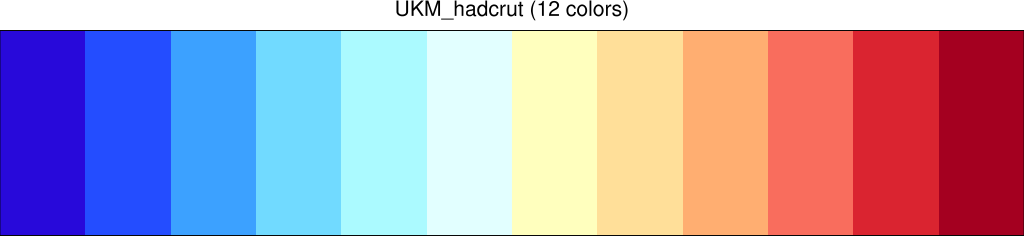
| ||
| GSFC_landsat_udf_density | 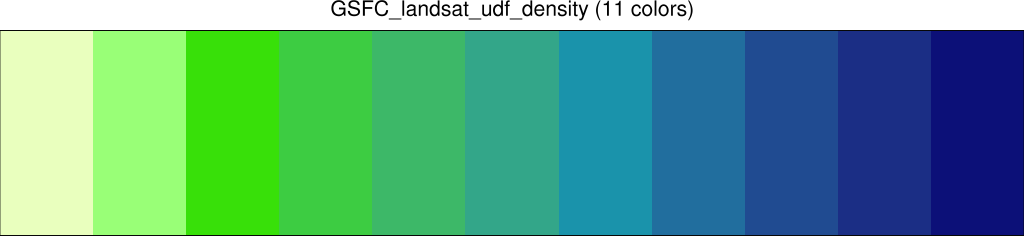
| drought_severity | 
| ||
| Click on color map name or color bar for more information or larger image. | |||||
Graphics enhancements
- get_color_index /
get_color_rgba - these functions were enhanced to
allow the third argument to be an array of values. This can
signficantly speed up the routines if you have a lot of calls to these
functions.
See example table_8.ncl.
Function enhancements
- cd_inv_string - new
formatting options added for month names, and changed 'f' option
to 'r' to match cd_string.
- nggcog - this procedure was updated to allow
numeric input and/or float and double output. See
example polyg_27.ncl for an
example.
Other enhancements
- ncl_convert2nc - an "-nc4" option was
added to allow the conversion of files to NetCDF 4.
Function and procedure bugs fixed
- bin_avg - this function expects equal grid
spacing for the destination grid. The internal test required exact
spacing. However, some grid spacing led to round-off errors which
caused the test to fail. More robust testing was used to address this
issue.
- calculate_daily_values
/ calculate_monthly_values
/ calculate_segment_values - the
documentation for each function was updated to clarify the supported
`data structures. The calculate_daily_values
and calculate_monthly_values
functions now support 5-dimensional structures of the form:
(ncase,time,level,lat,lon) and (time,ncase,level,lat,lon).
- calendar_decode2 - no
longer exits with an error if the "calendar" attribute is set to
"proleptic_gregorian".
- cd_calendar
/ cd_string - the "calendar"
attribute can now be any case ("julian", "JULIAN", "Julian", etc).
- clmDayTLLL - fixed a bug where
it wasn't handling the 360-day calendar properly.
- daylight_fao56 - fixed an issue
which arose when two-dimensional latitude/longitude coordinates
were encountered.
- dim_acumrun_n - fixed a bug that would cause
this function to crash if you passed in an "lrun" that was greater
than the number of elements of the input array.
- dim_pqsort / dim_pqsort_n -
these functions would fail if you tried to sort an array with more
than two gigabyte values.
- fbinread / fbinwrite /
fbindirread /fbindirwrite - these functions
can now read and write > 2 GB variables.
- get_isolines - was not correctly checking for
out-of-bounds conditions and sometimes returned non-sensical values.
See the isolines examples
page for NCL graphical scripts that use this function.
- lspoly / lspoly_n -
these functions were potentially returning the wrong coefficients
if multiple least-squares polynominals were input at once.
- natgrid_Wrap - was not
correctly attaching the coordinate arrays to the return variable (it
had the rightmost two dimensions swapped).
- paleo_outline - fixed a bug that was
restricting the string length of the base name of the map files to 512
characters.
- pot_vort_isobaric - when opt=1,
this function returned seven variables as elements of a list variable. It was
supposed to return three variables.
- product - now allows types int64, uint, and
uint64 to be input.
- stat_medrng - now allows the output arguments to
be scalars as advertised.
- trop_wmo - was returning -999 for
missing values, but no _FillValue attribute was being set.
- ut_string_fix - was not
calling ut_calendar_fix under the hood, and thus it
still had the infamous "60 second" bug.
- wgt_volrmse - was returning the wrong values
due to a value being squared twice.
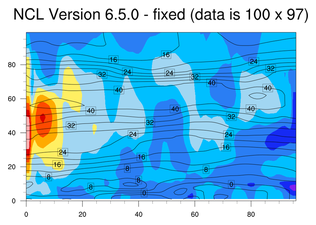
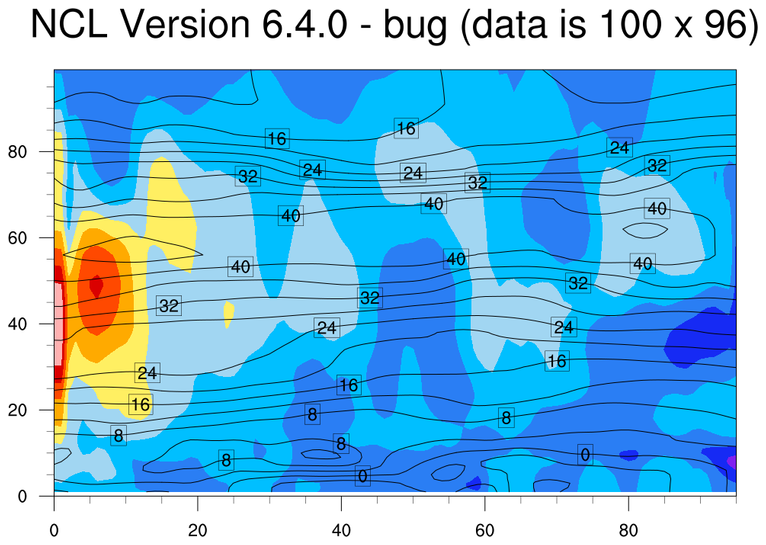
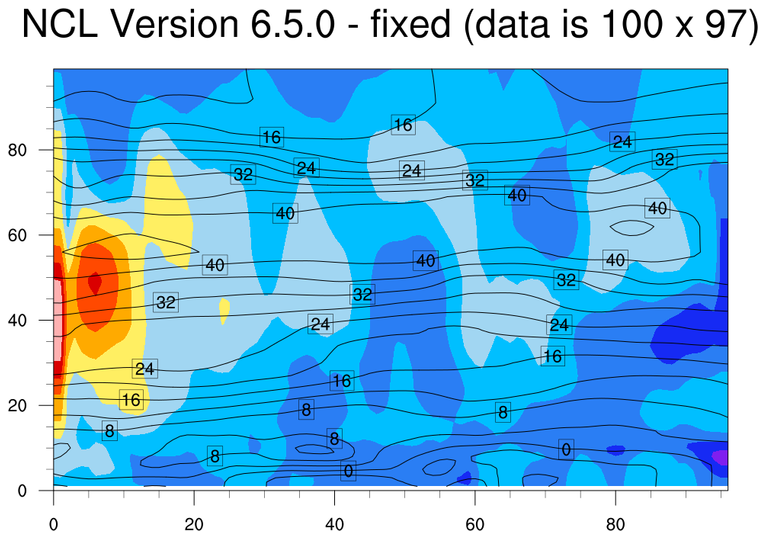
- wrf_user_intrp2d /
wrf_user_intrp3d - these two
vertical cross section routines weren't including the 0th grid point
when setting up the output domain, causing the output array to be
missing a grid point in the rightmost dimension. In the figures below,
you can see the error by comparing the right edge of each plot.
(Click on color map name or color bar for more information or
larger image.)
Graphics bugs fixed
- cnLineLabelFormat - this
resource is now recognized by the gsn_csm contouring routines.
- cnLowLabelFontColor /
cnHighLabelFontColor - these
resources are now recognized by
the wrf_contour function.
- cnLineLabelFontThicknessF /
cnHighLabelFontThicknessF /
cnLowLabelFontThicknessF /
cnInfoLabelFontThicknessF - these contour font thickness
resources are no longer ignored.
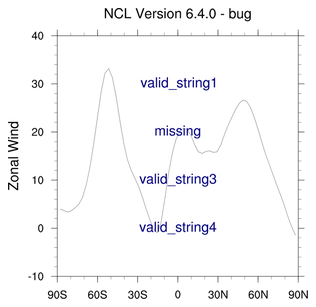
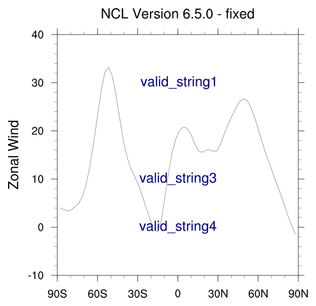
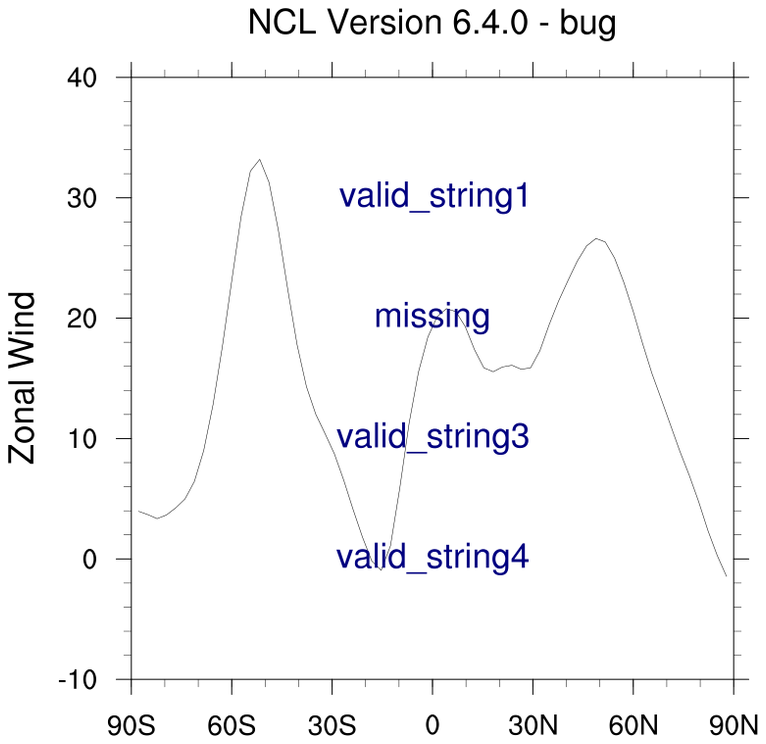
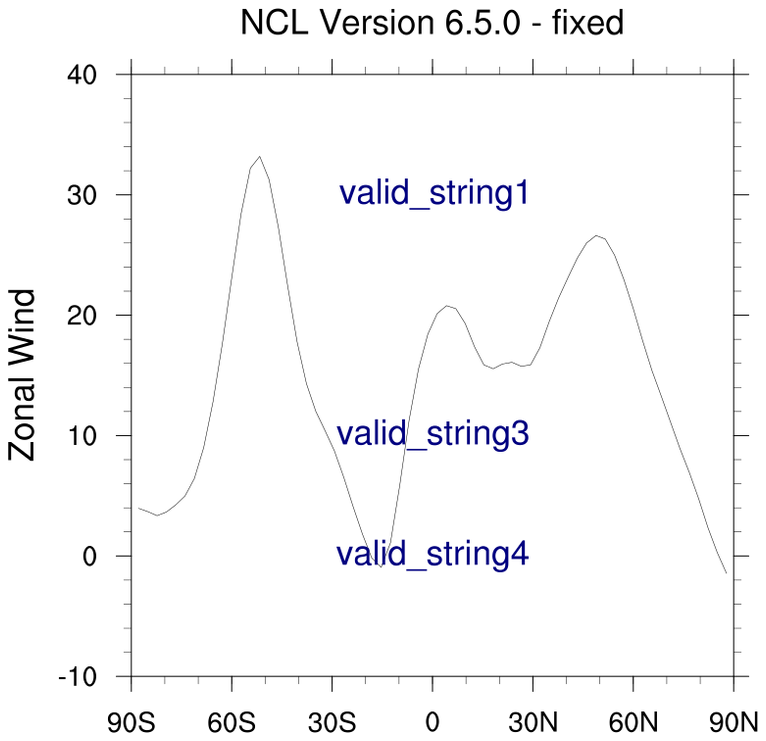
- gsn_add_text /
gsn_create_text /
gsn_text /
gsn_text_ndc - fixed a bug in which
missing text strings would show up on the plot as whatever the missing
value was for that string. (Click on images for a larger view.)
- gsn_csm_streamline_scalar_map_polar
- fixed a bug where this function would fail if you tried to turn off
the labelbar by setting lbLabelBarOn
to False.
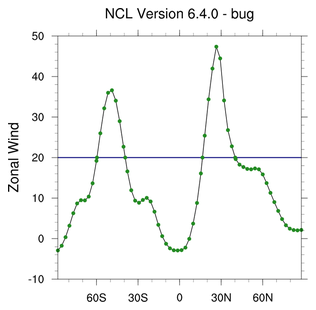
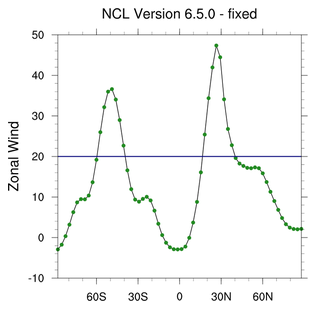
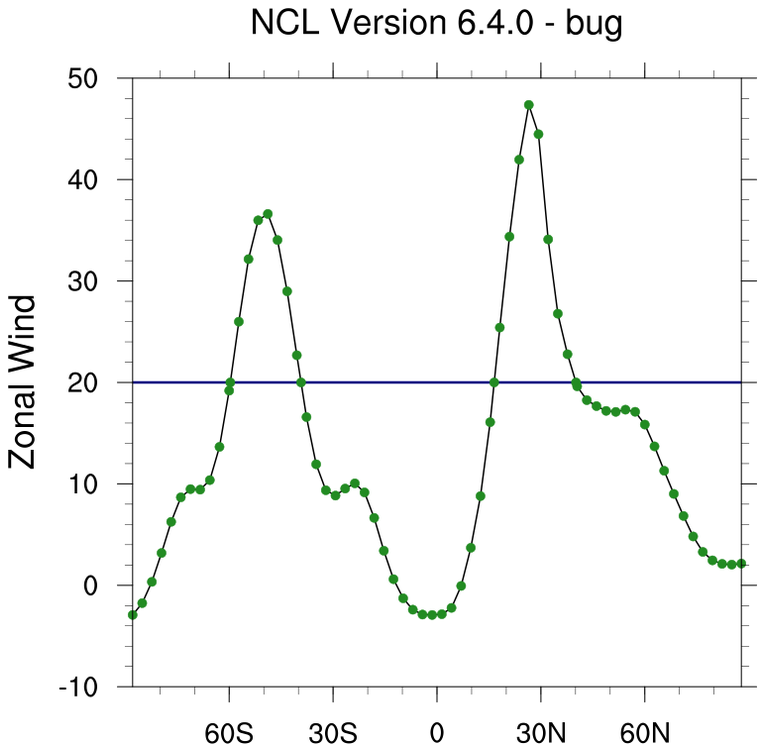
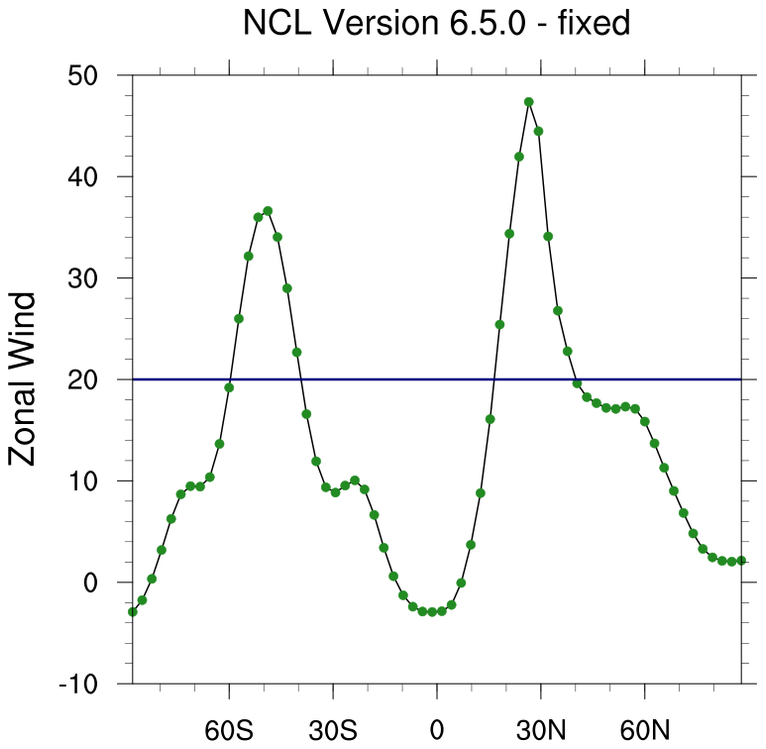
- gsnYRefLine / gsnXRefLine
- Fixed a bug where drawing your curves with markers or markers and
lines (xyMarkLineMode = "markers" or
"marklines") would cause extra markers to show up at locations where
the X or Y reference line crossed your curve(s). (Click on images for
a larger view.)
- Fixed a bug where if you are adding a different number of X and Y
reference lines to a plot via these two resources, then you may get a
fatal error:
fatal:Number of dimensions on right hand side do not match number of dimension in left hand side
fatal:["Execute.c":8640]:Execute: Error occurred at or near line 6014 in file
     /usr/local/lib/ncarg/nclscripts/csm/gsn_csm.ncl
If you have NCL V6.4.0 and need a fix for this problem now, download this gsn_csm_640_fix.ncl file and load it from your own script after any other load commands.
- Fixed a bug where drawing your curves with markers or markers and
lines (xyMarkLineMode = "markers" or
"marklines") would cause extra markers to show up at locations where
the X or Y reference line crossed your curve(s). (Click on images for
a larger view.)
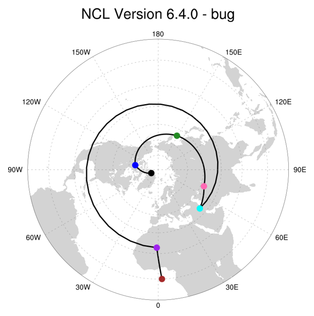
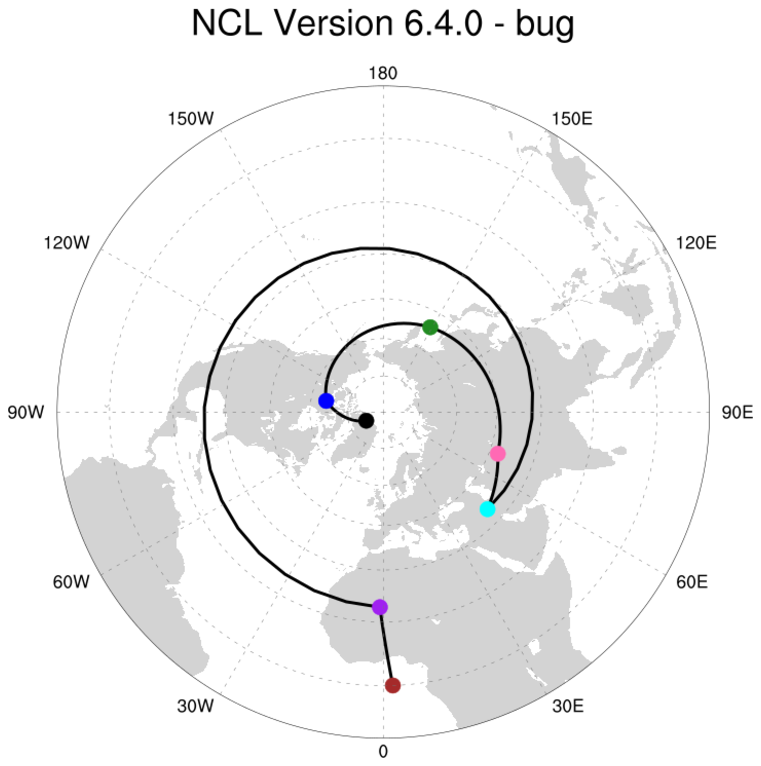
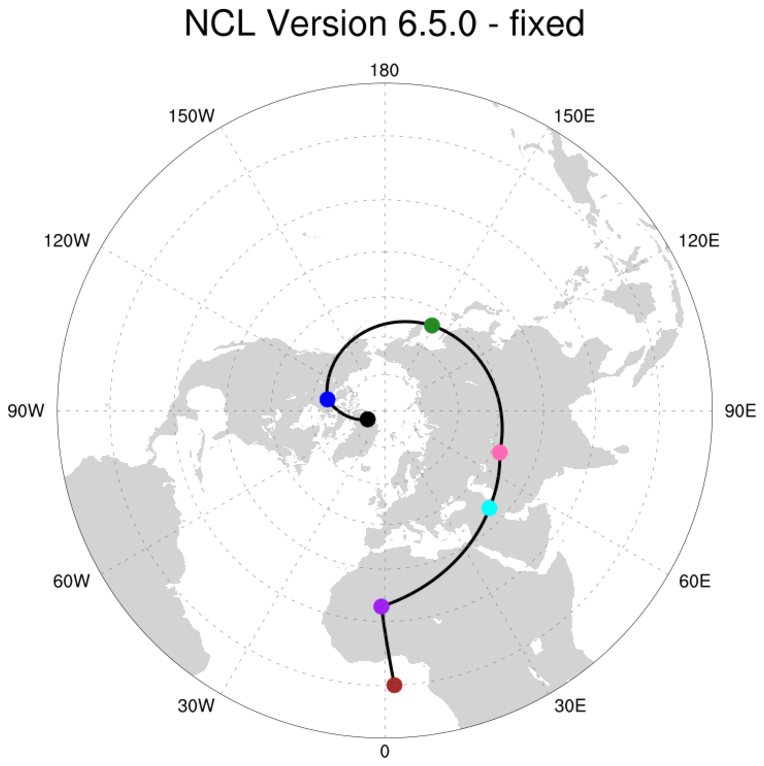
- gsn_add_polyline / gsn_polyline
- Fixed a bug in which NCL was not always drawing the shortest path
between two points on a map. (Click on images for a larger view.)
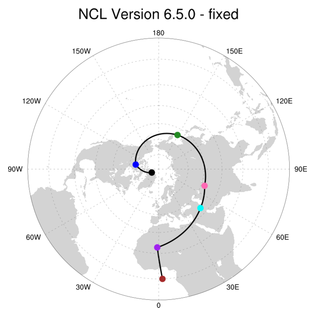
- Fixed a bug in which the lines wouldn't be drawn correctly if the
precision exceeded that which could be represented by a float.
- Fixed a bug in which NCL was not always drawing the shortest path
between two points on a map. (Click on images for a larger view.)
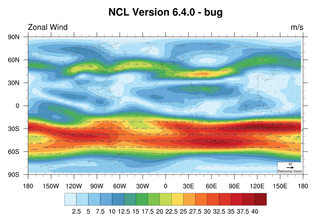
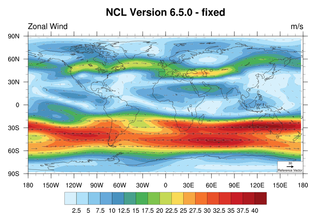
- Fixed a bug where if you were drawing filled contours or vectors
with transparency applied (for example, via resources like
cnFillOpacityF or
vcGlyphOpacityF), the opacity was
also being applied to the map outlines. The map outlines have been
fixed to be fully opaque. (Click on images for a larger view.)
- gsn_csm_xxxx_map functions - Fixed a bug where
if mpCenterLonF was set to
something less than 0 (and
pmTickMarkDisplayMode was not set
to "Always"), the longitude labels in the eastern hemisphere were
continuing to be labeled with "W".
- gsn_panel
/ gsnPanelLabelBar - Fixed a bug where if
you are running a script that calls
gsn_panel to panel XY
plots and setting gsnPanelLabelBar
to True, then you would get a fatal error:
fatal:Variable (mono_fill_scl) is undefined
fatal:["Execute.c":8640]:Execute: Error occurred at or near line 6100 \
   in file $NCARG_ROOT/lib/ncarg/nclscripts/csm/gsn_code.ncl
The gsnPanelLabelBar resource cannot be applied to XY plots anyway, so the solution is to simply not set this resource. In the next release, NCL will produce a warning instead of exiting with an error.
- tfDoNDCOverlay - This resource
used to only be settable to True / False. As of several versions ago,
this resource can now be set with strings. The gsn_csm functions,
however, were still only allowing True/False values. You can
now set this resource either way.
The following settings show the new values and their allowable equivalents:
res@tfDoNDCOverlay = 0
res@tfDoNDCOverlay = False
res@tfDoNDCOverlay = "DataTransform"

res@tfDoNDCOverlay = 1
res@tfDoNDCOverlay = True
res@tfDoNDCOverlay = "NDCViewport"

res@tfDoNDCOverlay = 2
res@tfDoNDCOverlay = "NDCDataExtent"
The string settings are case insensitive, so "DataTransform" is the same as "datatransform" which is the same as "DaTaTranSfORM".
To see an example of what the three values mean, see example dataonmap_14.ncl on the Plotting data on a map examples page.
Other bugs fixed
- GRIB2 - fixed issues with reading files containing aerosol data.
- ncl_convert2nc
- fixed a bug where this script would not work properly if you give it
more than two files.
Version 6.4.0
February 28, 2017
- New functions
- New features
- Backwards-incompatible changes
- Updated functions
- New resources
- New example pages
- New color table
- File I/O Improvements
- Bugs fixed
- Miscellaneous improvements
- Known issues
New functions
- Array Create,
Manipulator,
Query
- count_unique_values_n - Counts the number
of unique values across a given dimension.
- dim_maxind - Returns the
index of the first occurrence of a maximum value within the specified
dimension.
- dim_minind - Returns the
index of the first occurrence of a minimum value within the specified
dimension.
- isscalar - Determines if a variable is a scalar
(True) or not (False).
- is_string_numeric - Returns True for every
element of a string array that contains a numeric value.
- Venn Diagram -
A small suite of two-set Venn Diagram functions.
- venn2_difference - Get the unique element
Venn diagram difference of two arrays.
- venn2_intersection - Get the
unique element
Venn
diagram intersection of two arrays.
- venn2_union - Get the unique
element
Venn diagram union of two arrays.
- venn2_difference - Get the unique element
Venn diagram difference of two arrays.
- count_unique_values_n - Counts the number
of unique values across a given dimension.
- Bootstrap functions -
Application of the bootstrap method.
- bootstrap_correl - Bootstrap
estimates of sample cross correlations (ie, Pearson's correlation
coefficient) between two variables.
- bootstrap_diff - Bootstrap mean
differences from two samples.
- bootstrap_estimate -Extract the
user specified element from the bootstrapped values.
- bootstrap_regcoef - Bootstrap
estimates of the linear regression coefficient.
- bootstrap_stat - Bootstrap
estimates of basic statistics derived from a variable.
- bootstrap_correl - Bootstrap
estimates of sample cross correlations (ie, Pearson's correlation
coefficient) between two variables.
- CESM
- albedo_ccm - Calculates the
albedo given a pair of model radiation variables.
- time_reassign - Reassign
(replace) a Cf-conforming "time" variable by calculating the mid-time
values using the "bounds" attribute.
- time_reassign_cv2var -
Reassign (replace) a Cf-conforming "time" coordinate variable
associated with a variable by calculating the mid-time values using
the "bounds" attribute.
- albedo_ccm - Calculates the
albedo given a pair of model radiation variables.
- Crop & Evapotranspiration -
A suite of functions for computing crop water requirements based upon
the
FAO Irrigation
and drainage paper 56 including Penman-Monteith estimates (FAO 56)
of reference evapotranspiration.
- Date,
String
- cd_inv_string - Converts
string time values to numeric values, using the given format string.
- cla_sq - Create a string
that uses single quotes (') to enclose command line assignment
statements (CLAs) for later use by NCL's system
procedure.
- cd_inv_string - Converts
string time values to numeric values, using the given format string.
- Extreme Value
Statistics -
A small suite of functions focused on extreme value distributions.
- extval_frechet - Calculates
the probability (PDF) and cumulative (CDF) distribution functions of
the Frechet Type II distribution given the shape, scale and location
parameters.
- extval_gev - Calculates the
probability (PDF) and cumulative (CDF) distribution functions of the
of the Generalized Extreme Value (GEV) distribution given the shape,
scale and location parameters.
- extval_gumbel - Calculates
the probability (PDF) and cumulative (CDF) distribution functions of
the Gumbel (Type I) distribution function given the scale and location
parameters.
- extval_mlegam - Estimates the
shape, scale, location other parameters for the Gamma distribution
using Maximum-Likelihood Estimation.
- extval_mlegev - Estimates the shape, scale and
location parameters for the Generalized Extreme-Value (GEV)
distribution using Maximum-Likelihood Estimation.
- extval_pareto - Calculates
the probability (PDF) and cumulative (CDF) distribution functions of
the Pareto distributions (Generalized, Type I, TYpe II) given the
shape, scale and location parameters.
- extval_recurrence_table -
Calculates the recurrence interval (return period), cumulative and
exceedence probabilities based upon a time series.
- extval_return_period -
Calculates the period of an event (eg, flood, heat wave, drought)
occurring given an average event recurrence interval and specified
probability level.
- extval_return_prob -
Calculates the probability of an event (eg, flood, heat wave, drought)
given an average event interval and a specified exceedance period.
- extval_weibull - Calculates
the probability (PDF) and cumulative (CDF) distribution functions of
the Weibull Type III distribution given the shape, scale and location
parameters.
- extval_frechet - Calculates
the probability (PDF) and cumulative (CDF) distribution functions of
the Frechet Type II distribution given the shape, scale and location
parameters.
- General Applied Math
- calculate_daily_values -
Calculate daily values [avg, sum, min, max] from high frequency
temporal values.
- calculate_segment_values -
Calculate segment (eg, pentad [5-day], weekly [7-day]) values from
high frequency temporal values.
- ceemdan - Complete ensemble empirical mode
decomposition with adaptive noise.
- cohsq_c2p - Given
coherence-squared and the effective degrees-of-freedom, calculate the
associated probability.
- cohsq_p2c - Calculate the
value(s) of coherence-squared required for a specified significance
level and effective degrees-of-freedom.
- demod_cmplx - Perform a
complex demodulation on one or more time series.
- eemd - Perform ensemble empirical mode
decomposition.
- eofunc_n / eofunc_ts_n /
eofunc_n_Wrap /
eofunc_ts_n_Wrap /
eof2data_n
These are identical to eofunc / eofunc_ts / eofunc_Wrap / eofunc_ts_Wrap / eof2data, except you no longer need to reorder the input array so that 'time' is the rightmost dimension.
- get_d2r - Return a constant
that converts degrees to radians.
- get_pi - Return pi as
a type float or double.
- get_r2d - Return a constant
that converts radians to degrees.
- calculate_daily_values -
Calculate daily values [avg, sum, min, max] from high frequency
temporal values.
- Heat-Stress functions
- fire_index_haines -
Calculates the Haines fire index for a sounding.
- heat_apptemp - Compute apparent
temperature.
- heat_discoi - Compute a
simplified human discomfort index.
- heat_discoi_stull - Compute the
human discomfort index due to excessive heat and humidity using the
Stull wet bulb temperature
(wetbulb_stull).
- heat_esidx_moran - Compute an
environmental stress index (ESI) which is an alternative to the wet
bulb globe temperature (WBGT).
- heat_humidex - Compute the
'feels-like' temperature for humans.
- heat_index_nws - Computes the
'heat index' as calculated by the National Weather Service.
- heat_swamp_cooleff - Compute
the swamp cooler temperatures at 65% amd 80% efficiency.
- heat_thic_thip - Compute the
thermal humidity comfort index (thic) and the thermal humidity
physiology index (thip).
- heat_wbgt_inout - Compute the
composite Wet-Bulb Globe Temperature (WBGT) index with options for
indoor or outdoor formulations.
- heat_wbgt_simplified -
Simplified WBGT index.
- wetbulb_stull - Calculate
wet bulb temperature at standard sea level pressure (1013.25 hPa)
using the method of R.Stull.
- fire_index_haines -
Calculates the Haines fire index for a sounding.
- Legends
- simple_legend - Creates a
legend based on user supplied resources. simple_legend gives the user
complete control over the design and placement of the legend, and can
be seen as an easier way to create legends in NCL. See
examples leg_16.ncl and
leg_17.ncl.
- simple_legend - Creates a
legend based on user supplied resources. simple_legend gives the user
complete control over the design and placement of the legend, and can
be seen as an easier way to create legends in NCL. See
examples leg_16.ncl and
leg_17.ncl.
- Meteorology
- brunt_vaisala_atm - Compute
the Brunt-Vaisala frequency which is a measure of bouyancy in a
continuously stratified atmosphere.
- coriolis_param - Compute
Coriolis parameter.
- eady_growth_rate - Compute
the Eady maximum baroclinic growth rate.
- epflux - Compute
quasi-geostrophic Eliassen-Palm fluxes at isobaric levels.
- grad_latlon_cfd - Compute
the meridional and zonal gradients of a variable on a global or
limited area rectilinear grid.
- latent_heat_water - Estimate
latent heat flux for water: evaporization (condensation), melting
(freezing) or sublimation (deposition).
- pot_temp_equiv - Compute
equivalent potential temperature..
- pres_hybrid_jra55 - Calculates the "full"
hybrid levels for the 60-level Japanese ReAnalysis.
- relhum_ice / relhum_water -
Calculates relative humidity with respect to ice/water, given
temperature, mixing ratio, and pressure.
Contributed by Alan Brammer of the University at Albany - SUNY.
- rigrad_bruntv_atm - Compute
the atmospheric gradient Richardson number and, optionally, the
Brunt-Vaisala, buoyancy and shear.
- satvpr_water_bolton -
Estimate the saturation vapor pressure over water using Bolton's
equation 10.
- satvpr_water_stipanuk -
Estimate the saturation vapor pressure over water using the Stipanuk
approximation.
- wetbulb - Compute wetbulb temperature.
- wgt_vertical_n - Calculate a
weighted vertical average and/or sum (integral).
- wind_speed - Calculate wind
speed from zonal and meridional wind components and return associated
meta data.
- wind_stats - Given a
sequence of wind speeds and directions, compute assorted wind-related
statistics including the standard deviation of the wind direction.
- brunt_vaisala_atm - Compute
the Brunt-Vaisala frequency which is a measure of bouyancy in a
continuously stratified atmosphere.
New features
You can now do "block style" comments in NCL, using /; and ;/ to start and end a block:
/;
    This is inside an NCL block style comment,
    available in NCL V6.4.0.
;/

  print("A demonstration of block comments")

/;
  print("This line should not be printed")
  print("...nor this one")
  print("...or this one")
 ;/
NCL User Guide examples and data files included
All 100+ NCL User Guide (NUG) tutorial scripts and many of the required data files are included with NCL V6.4.0.
Look in the directories:
$NCARG_ROOT/lib/ncarg/nclex/nug
$NCARG_ROOT/lib/ncarg/data/nug
or use the "ng4ex" command to generate the full list or run any one of them individually:
  ng4ex -nug -list
  ng4ex NUG_curvilinear_basic
A complete set of scripts and data files can also be found online.
You can now generate labelbars with triangle ends instead of rectangle ends. See the lbBoxEndCapStyle resource mentioned in the new resources section, or examples lb_16.ncl, lb_17.ncl, gpm_1.ncl, and corel_3.ncl on the labelbar examples page.
Several NCL scripts are now preloaded, and you no longer need to explicitly load them at the top of your own scripts. Here's a full list of the preloaded scripts:
    "$NCARG_ROOT/lib/ncarg/nclscripts/csm/gsn_code.ncl"
    "$NCARG_ROOT/lib/ncarg/nclscripts/csm/gsn_csm.ncl"
    "$NCARG_ROOT/lib/ncarg/nclscripts/csm/contributed.ncl"
    "$NCARG_ROOT/lib/ncarg/nclscripts/csm/shea_util.ncl"
    "$NCARG_ROOT/lib/ncarg/nclscripts/csm/bootstrap.ncl"
    "$NCARG_ROOT/lib/ncarg/nclscripts/csm/extval.ncl"
    "$NCARG_ROOT/lib/ncarg/nclscripts/wrf/WRFUserARW.ncl"
It's okay to still load these scripts even though it's no longer required.
In most cases you will not notice but loading these scripts does take a few tenths of a second. In certain situations where you want to run many very short scripts the resulting overhead may cause a significant slowdown of your work flow. For this case, a new command line option, '-s', allows you to start NCL without preloading any scripts.
Backwards-incompatible changes
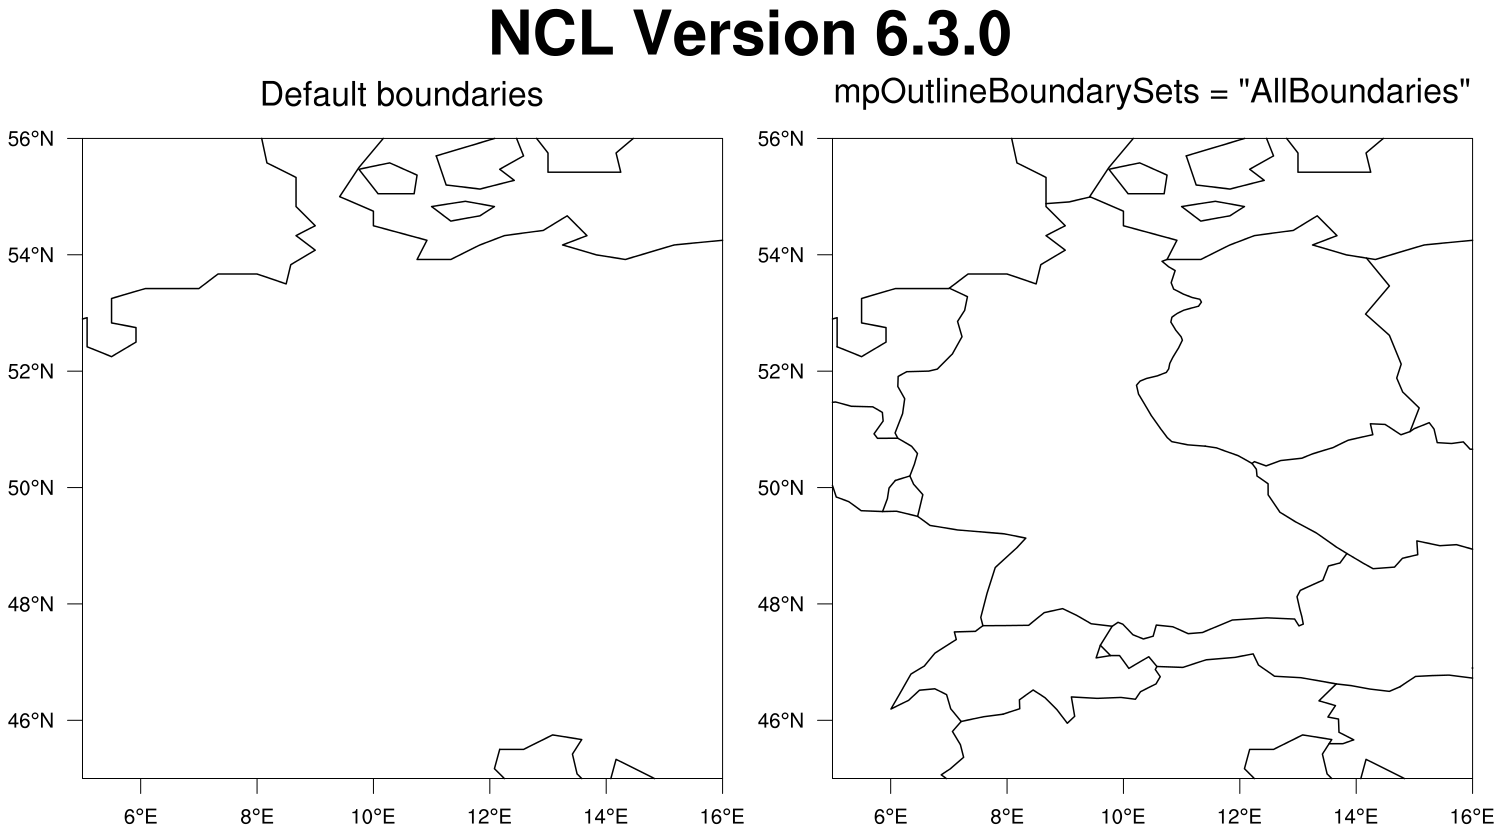
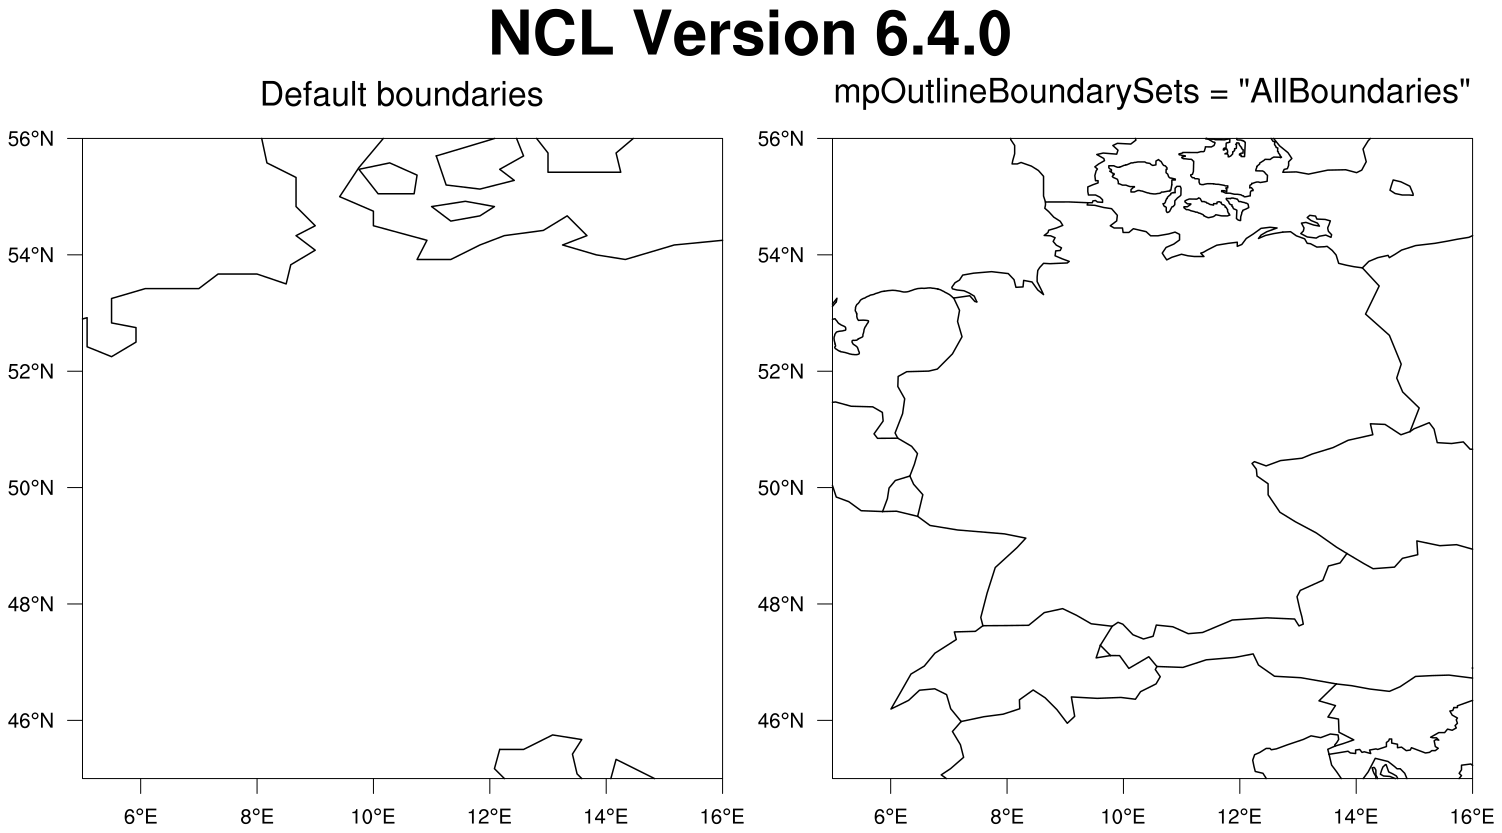
The "MediumRes" map database will now be the default in some cases
This involves a change to the default value of the mpDataBaseVersion resource
This resource has a new default value of "Dynamic". This means that the "LowRes" database (the default in older versions of NCL) will be used, unless either of the boundary-set resources mpFillBoundarySets or mpOutlineBoundarySets are set to anything other than "Geophysical", in which case the "MediumRes" database will be used.
This behavior represents a balance between performance and accuracy for common use cases. For global-scale maps depicting just the continents and oceans, the LowRes database is more than sufficient, whereas the more detailed MediumRes database would incur additional compute overhead. However, the political boundaries of the MediumRes database are more up-to-date, and are thus favored if any political boundaries are to be drawn.
Click on the images below for a comparison with the previous version of NCL, and note the differences in the righmost panel. The left plot of both versions shows the default "LowRes" database. The right panel of NCL V6.3.0 still shows the "LowRes" database, while the right plot of NCL V6.4.0 automatically defaulted to "MediumRes"
| 
|
Labelbar colors will now reflect opacity used in plot
The labelbar associated with filled contour and color vector plots will now reflect any opacity applied.
If this behavior is not desired, then set the new resource lbOverrideFillOpacity to True.
Click on the images below for a comparison with the previous version
of NCL, and note the differences in the bottom labelbar.
Updated functions
- betainc / gammainc - These
functions no longer require that the input values be float or
double.
- calculate_monthly_values -
This function no longer requires that the time dimension name be
'time'. Also, (i) the algorithm no longer assumes that the values are
equally spaced in time; and (ii) the user may specify that a minimum
number of observation be used for deriving a statistic.
- cd_inv_calendar
/ ut_inv_calendar - These functions were enhanced
to allow different numeric types for the input parameters and the
return array. The return array will still default to type "double"
unless the special attribute "return_type" is set to "float", "long",
or "int". Read the function documentation for more details.
- conform / conform_dims -
These functions have been updated to more easily work on arrays with
degenerate dimensions or arrays that are already the size you want to
conform them to. This should simplify code where you may have had to
check the rank of a variable before conforming it to another variable.
- gsn_csm_xy - This function
underwent a major overhaul to allow for horizontal curves and bars to
be filled when
gsnXRefLine is set. This is the same
behavior that already existed for
gsnYRefLine. See the
bar chart page for several
horizontal bar examples.
- printMinMax - The "units"
attribute, if present, is now added to the printed output.
- regCoef / regCoef_n - These
functions now return the y-intercept.
- regline_stats - Added
several new attributes related to 95% confidence limits of the slope
and y-intercept, the mean responses, and the prediction
limits. Examples of use were added to the
regress/trend
page. See: regress_1a.ncl, regress_1b.ncl, regress_1c.ncl
and regress_3.ncl.
- skewt_func - Added
ability to change the thickness of the wind barbs.
- trend_manken - Added recognition of
the opt argument: if opt is set to True, then the
trend is not calculated.
- wrf_user_vert_interp - Added
recognition of a new opt@time attribute that allows you to
specify which time index was used to extract the variables for
interpolation.
New resources
- gsnHistogramBarColors - Set individual
colors for bars in a histogram generated by
gsn_histogram. See
examples histo_6.ncl
and histo_7.ncl.
- gsnPanelMainString - Set a main title for
paneled plots created from gsn_panel.
This resource replaces the awkwardly named "txString"
resource, which will still work for backwards compatibility.
Other resources were added to allow you to customize the panel title:
- gsnPanelMainFont - Sets
the font for gsnPanelMainString.
This resource replaces the awkwardly named "txFont"
resource, which will still work for backwards compatibility.
- gsnPanelMainFontColor - Sets
the font color for gsnPanelMainString.
This resource replaces the awkwardly named "txFontColor"
resource, which will still work for backwards compatibility.
- gsnPanelMainFontHeightF - Sets
the font height for gsnPanelMainString.
This resource replaces the awkwardly named "txFontHeightF"
resource, which will still work for backwards compatibility.
- gsnPanelPosXF / gsnPanelPosYF - Sets the X and Y positions of the main title using NDC coordinates. Replaces "txPosXF" and "txPosYF".
- gsnPanelMainFont - Sets
the font for gsnPanelMainString.
This resource replaces the awkwardly named "txFont"
resource, which will still work for backwards compatibility.
- gsnPanelFigureStringsJust - Set the
location of the figure strings in a set of paneled plots created
from gsn_panel. This resource
replaces the awkwardly named "amJust" resource, which will
still work for backwards compatibility.
- gsnLeftXRefLineColor and
gsnRightXRefLineColor - Fills
the curve to the left or right of the X reference line specified
by gsnXRefLine with the
given color. See
examples xy_vert_21.ncl
and bar_horz_4.ncl.
- gsnXRefLineColors,
gsnXRefLineDashPatterns,
gsnXRefLineThicknesses - These
resources are similar to their counterparts,
gsnYRefLineColors,
gsnYRefLineDashPatterns, and
gsnYRefLineThicknesses, and allow you
to set the colors, dash patterns, and thicknesses for X reference
lines drawn with
gsnXRefLine. See
example xy_36.ncl.
- gsnXYLeftFillColors /
gsnXYRightFillColors - These resources
allow you to set the fill colors for horizontal bar charts, a new
feature added in NCL V6.4.0. See
example xy_vert_17.ncl.
- lbBoxEndCapStyle - Controls the
style of the two outer boxes of a labelbar, which can either be
rectangular or triangular/arrow shaped. See
examples lb_16.ncl,
lb_17.ncl,
gpm_1.ncl,
and corel_3.ncl on
the labelbar examples page.
- lbFillOpacityF - Allows you to
set the fill opacity for labelbars. This is generally meant for
user-created labelbars, and not labelbars created by contour or vector
plots. See
example lb_22.ncl.
- lbOverrideFillOpacity - The
labelbar associated with filled contour plots will now reflect the
opacity of the fill colors. Set this resource to True if you do not
want this behavior. See
example overlay_12.ncl.
- xyLineOpacityF,
xyLineOpacities,
xyMarkerOpacityF,
xyMarkerOpacities - These resources
allow you to control the opacity of lines and markers in an XY plot.
See example xy_35.ncl.
New example pages
- ACCESS model
- Bootstrapping; Resampling
- Complex Demodulation
- Crop: Evapotranspiration; Penman-Monteith
- Eliassen-Palm flux (EP-flux);
Brunt-Vaisala; Eady Growth rate; Gradient Richardson number
- Extended and Complete Empirical
Mode Decomposition: EEMD and CEEMDAN
- Gradients: Meridional and Zonal
- Heat Index/Stress
- Plotting Data on Map
- Simple Extreme Value Statistics
- Task Parallelism
New color table
The new default color table for matplotlib, MPL_viridis, was added, thanks to Brian Medeiros of NCAR.

File I/O Improvements
- The "advanced" file system that supports groups and advanced data types is now the default for HDF5 and NetCDF4 data.
The old HDF5 module that uses the standard file system is now deprecated and its use is not advised. HDFEOS5 still defaults to the standard
file system (where groups names are appended to variable names to make them unique) because there are
some remaining issues with the advanced version. The standard file system is also the default for NetCDF3 and NetCDF4 Classic Model files.
While the setfileoption "FileStructure" option can still be used to explicitly switch between the "advanced" and "standard" file
systems for certain formats (such as NetCDF3), it is now mostly unnecessary and it is anticipated that this option will soon become obsolete.
- Support was added for CDF5, a NetCDF3 model variant developed at Argonne National Laboratory, that supports very large variables. Although
CDF5 has a NetCDF3-like interface, NCL needs to use the advanced file system to access data in this format, primarily because it supports additional
atomic types like unsigned and 64-bit integers.
- The syntax for working with groups and variables within groups has been regularized as follows:
- A variable in any group may be read from the top level without further qualification using the syntax:
v = f->variable_name.
If more than one variable with the same name exists in the file, the first one encountered will be returned. The search order is the same as the order returned by getfilevarnames. - A slash character ('/') is required as the first character naming a variable in a lower group:
v = f->/group_name/variable_name
This is needed to for backwards compatibility to disambiguate a reference to a variable in a file from a variable in a file divided (numerically) by a local variable (because NCL has never required spaces separating operators from the operands). The slash that follows directly after the "->" operator indicates that any other slashes prior to the next following space are separators between groups or between a group and a variable. This means that you do need a space prior to a slash meant for numerical division when a variable is specified using the initial slash character. - On the other hand, an initial slash is optional for referencing a group:
g = f=>group1/group2
works as well as
g = f=>/group1/group2
- If group or variable names contain characters, such as punctuation or white space characters, that are not allowed for NCL symbol names, the user can reference the group or variable using NCL string references or by substituting underscrore '_' characters in place of each character that is not allowed. Of course, it is possible that this substitution would lead to ambiguities. In that case, as with variables specified without fully qualifying paths, the first encountered group or variable will be returned.
- NCL printing routines for the advanced file system always print the real names of variables with the actual characters used in the file.
- A variable in any group may be read from the top level without further qualification using the syntax:
- Compound data can now be accessed either by individual component member or as a complete variable. Accessing by component relies on the dot ('.') character to
separate the compound variable name from the member name. If using string referencing because either the variable name or the member contains disallowed
characters, the complete name (everything following the "->" operator) should be quoted.
Accessing a complete compound variable returns a varible of type list to NCL. Each individual component member becomes a list element. Outer dimensions (those applying to the compound variable as a whole) and inner dimensions (those applying to individual members) are combined to form the dimensionality of each element of the list.
- Both ncl_convert2nc and ncl_filedump have been enhanced to
accept filenames with spaces as parameters on the command line.
- NCL can now read certain ECMWF GRIB1 files with records whose size is greater than 256^3,
the largest size that can be specified in the conventional manner in a GRIB1 file. This was made possible due to some code borrowed from the wgrib tool.
This code comes from ECMWF and uses an undocumented extension to allow for larger record sizes.
- The HDF5 reference type is now supported at a basic level. HDF5 references are pointers to other variables in the same file. If an HDF5 reference is assigned to an NCL
variable it is converted to the NCL string type. The string value will be the full path of the variable that is referenced.
- Support for multiple unlimited dimensions in NetCDF4 and HDF5 has been improved.
- HDF5 dimensions that are unnamed by HDF5 have a more robust naming scheme.
- The NCEP GRIB1 and GRIB2 tables have been updated fairly recently.
- NCL can now ususally figure out the format of files that have no extension. The only remaining confusion is distinguishing between NetCDF4 files and HDF5 files that are not NetCDF4.
- To enhance performance, the caching of unlimited variable values was eliminated. Testing has shown that this has more or less effect depending on the file format and the size of the unlimited dimension, but it never caused a slow-down.
File I/O bugs fixed
- Fixed a major bug in the GRIB1 code that resulted in some elements of the non-horizontal dimensions of a variable
being presented in the wrong location in NCL's representation. This occurred in certain cases where one or more
elements at the beginning of the affected dimension were missing. The code that sorts the records into their proper
position was completely rewritten to fix this issue. An intended future benefit of this rewrite is to make it
easier to add new dimensions as needed.
- Fixed a bug where you couldn't read a NetCDF-4 variable that
contains a '.' character; for example, "conc.instant_Cs137".
- Fixed a bug where HDF5 strings in nested groups were not accessible.
- Fixed a serious bug where opening an HDF5 file in "w" or "c" mode resulted in
the original file being deleted. Now opening an HDF5 file works as expected in NCL.
- Fixed a bug in which opening some HDF5 files with "new" file
features (like groups, compound data, enum, etc) would cause a
segmentation fault.
A work-around for V6.3.0 is to call the following before you open the file:
setfileoption("h5", "FileStructure", "Advanced")
or to use the "-f" option when running ncl:
ncl -f myscript.ncl
- Fixed a bug where deleting a group would delete parts of the file
variable structure.
- Fixed a bug that led to a segmentation fault when trying to read a
variable from a NetCDF4 file opened in "w" mode.
- Fixed a bug that resulted in a segmentation fault when re-writing
string attributes to a NetCDF4 file, even if the attribute values were
unmodified from their previous values in the file.
- Fixed a segmentation fault that occurred when
using fileattdef to create global attributes in a
NetCDF4 file.
- Fixed a problem that resulted in NCL reading a variable from the wrong
group. Both variables had the same name, but the group traversing code
was incorrect.
- Fixed a problem with printing an HDF variable len variable that contained
reference type variables.
- Fixed a problem where scalar variables were given an improper dimension
size and the dimension improperly labeled "unlimited" when first created in
a NetCDF4 file.
- Eliminated unnecessary warnings for the GRIB "curvilinear orthogonal grid".
- Fixed a problem with JRA GRIB1 files where the names of certain variables was
no longer correct because access to some local-to-JRA information was lost
due to a faulty piece of code.
- Fixed the HDF5 code to allow access to all the possible string types including
variable length strings, fixed-size NULL byte filled (C-style), and fixed-size space
filled (Fortran-style). This was implemented both for attributes and regular
variables.
- Fixed an issue where using the NCL dimension name operator (!) was returning the
wrong dimension name for NetCDF4 files.
- Fixed a seg fault with GRIB files that have what may or may not be a bogus negative time
period. The time period is definitely negative. Whether or not this is bogus is not yet
determined.
- Fixed a seg fault that occurred when trying to access a non-existent variable
attribute in a NetCDF4 file.
- Fixed a problem with incorrect forecast times for certain ARPEGE GRIB2 files.
- Fixed a problem using the list style delete syntax for deleting
file variables and coordinate variables.
- Added some GRIB 2 tables to allow decoding of non-standard MRMS data from NCEP.
- addfile - Fixed a bug that limited file names
to less than 256 characters.
- addfiles - Fixed a bug with arbitrary
subscripting of an aggregated dimension when the time units vary.
Note that the time coordinate units attached to the first file in the file list is always used as the common unit. If other files in the list have earlier times than the common unit, they will be converted to negative values. They will still be correct (the correct date string can be obtained using the usual routines), but if the files in the list are not in chronological order, the following warning will be emitted:
warning:Aggregated dimension coordinate values are non-monotonic; check aggregated file ordering
Also fixed a subsequent issue with the coordinate values being calculated incorrectly and an issue where the aggregated dimension has no associated coordinate array.
- fbinread / fbinwrite /
fbindirread / fbindirwrite -
Fixed a bug where these functions would fail if you tried to write
more than 2 GB to a file.
- write_table - Fixed a bug that didn't allow you
to write logicals to a file.
Functions and procedures bugs fixed
- advect_var - This function was incorrectly named in NCL
V6.3.0. The correct name
is advect_variable.
- Fixed an issue with math functions like stddev
where if a "ubyte" type was used, the _FillValue was ignored.
- area_conserve_remap - Fixed a bug where if
missing values were input for a 2D grid, then the output grid was not
returning all missing values.
- decimalPlaces - Fixed a bug
to make this function round correctly.
- dim_acumrun_n - Fixed a bug where this function
was returning float output, even if integers were input. This function
will now return the type that matches the type of the input array,
except in the case of bytes or shorts, then integers will be
returned.
- dpres_plevel - Fixed a bug for a pathological
case where if psfc and ptop are between levels, the function would
fail.
- ESMF_regrid - Fixed a bug where
this function would sometimes produce an incorrect error about not
having the correct number of triangles for the internal triangular
mesh that it generates.
- f2foshv_Wrap
/ fo2fshv_Wrap - Removed
incorrect syntax that subtracted or added one to the size of the
latitude arrays of uNew and vNew and prevented the functions from
working at all.
- gc_latlon - This function now uses a more
general algorithm to hopefully prevent NaNs from being returned
when input points are very close to each other.
- generate_sample_indices -
replaced the method used with a similar but more robust method.
- int2p, int2p_n - Fixed a bug
which occurred when the input and output pressure levels were not
monotonically decreasing. The functions now work regardless of the
input or output pressure level ordering.
- kolsm2_n - Fixed a bug in which using
multiple dimensions (for example, in the time dimension) would
cause the results to be wrong.
- pot_vort_isobaric - Andy
Show (12/15) reported that the term [ R/(s*p) ] should be [ 1/s ].
- rm_single_dims - Fixed a
bug where dimension names of non coordinate variables would get removed
from the output array.
- stat_dispersion - Fixed a
bug where setting the opt=True but not associating any
attributes resulted in a fatal error.
- table_attach_rows - Removed
debugging print statements.
- thornthwaite - This function will now exit more
gracefully if time is not a multiple of 12. It will also allow a
scalar time value.
- trend_manken - Fixed bug in which passing a
really large array (i.e. 400 MB) would cause this routine to hang
and/or produce a segmentation fault. The issue was with the internal
sorting algorithm used, which is required to calculate the trend. A
new sorting algorithm was implemented, and also the option to not
calculate the trend was added.
- triple2grid - Fixed a bug where the output
results were sometimes shifted by one pixel in both directions. The
value for "domain" now defaults to 1 instead of 0.
- wrf_map_resources - Fixed
a bug in which rotated projection parameters were not
always set correctly.
- wrf_user_getvar - Fixed
the following bugs:
- "cape_2d" and "cape_3d" - Fixed a bug in which the PSFC variable
was not being converted to hPa as required by these routines.
- "ctt" (cloud top temperature)
- This function now returns its values in degrees Celsius (it was previously returning them in degrees Kelvin). This is to stay consistent with other diagnostics that are returned in Celsius.
- Fixed a bug where the pressure values were not being converted properly.
- Fixed the interface to allow "ctt" to be calculated for multiple timesteps when used with addfiles.
- "helicity" - Fixed the interface to allow helicity to be
calculated for multiple timesteps.
- "omg" (omega) - Fixed a bug in which the calculation was incorrectly using the temperature values for the water vapor mixing ratio, making the output results nonsensical.
- "cape_2d" and "cape_3d" - Fixed a bug in which the PSFC variable
was not being converted to hPa as required by these routines.
Date conversion routines bugs fixed
- calendar_decode2 - This
function has been updated to call cd_calendar
instead of ut_calendar. This helps address some
issues found with the Udunits code, like the infamous
60 second bug mentioned
in this document. There are still occasions where the 60 second bug
may occur. If it does, try the
temporary calendar_decode2_fix
function.
- cd_convert - This function
was fixed to recognize the "calendar" attribute.
- day_of_year / days_in_month /
day_of_week / isleapyear - These
functions now correctly set the _FillValue attribute if there are
potentially missing values returned.
- time_axis_labels - Fixed a bug where this function wasn't recognizing the "calendar" attribute.
- New temporary date conversion routines introduced to address "60
second" bug
Many users reported a "60 second" bug in several of NCL's date conversion routines, in which you get a value of "n minutes, 60 seconds" instead of "n+1 minutes, 0 seconds". See details in the example scripts below.
In order to address this problem, several new date conversion routines have been temporarily introduced in NCL V6.4.0 to see if they are acceptable replacements for their original counterparts:
- ut_calendar_fix
- ut_inv_calendar_fix
- ut_string_fix
- ut_convert_fix
- calendar_decode2_fix
- time_to_newtime_fix
These functions are all based on the Calcalcs, a software package created by David W. Pierce of UCSD, who is also the author of Ncview. An important note is that this software treats year 0 and year 1 separately.
Here's a script that illustrates the "60 second" bug:
  load "$NCARG_ROOT/lib/ncarg/nclscripts/contrib/calendar_decode2.ncl"

  time = 300
  time@units = "seconds since 2013-11-01 00:00:0.0"
  utx = ut_calendar(time,-5)
  cdx = cd_calendar(time,-5)
  cd2x = calendar_decode2(time,-5)
  print("time:             " + time)
  print("units:            " + time@units)
  print("ut_calendar:      " + str_join(""+utx,","))
  print("cd_calendar:      " + str_join(""+cdx,","))
  print("calendar_decode2: "  + str_join(""+cd2x,","))

  time = 876595
  time@units = "hours since 1901-01-01 00:00:00"
  time@calendar = "gregorian"
  utx := ut_calendar(time,-5)
  cdx := cd_calendar(time,-5)
  cd2x := calendar_decode2(time,-5)
  print("time:             " + time)
  print("units:            " + time@units)
  print("ut_calendar:      " + str_join(""+utx,","))
  print("cd_calendar:      " + str_join(""+cdx,","))
  print("calendar_decode2: "  + str_join(""+cd2x,","))
The minutes/second (and sometimes hour) values are inconsistent across three similar routines. The blue text indicates the expected values, while the red text indicates the bug:time: 300 units: seconds since 2013-11-01 00:00:0.0 ut_calendar: 2013,11,1,0,5,0 cd_calendar: 2013,11,1,0,4,60 calendar_decode2: 2013,11,1,0,4,60 time: 876595 units: hours since 1901-01-01 00:00:00 ut_calendar: 2000,12,31,18,59,60 cd_calendar: 2000,12,31,19,0,0 calendar_decode2: 2000,12,31,19,59,60The results aren't necessarily wrong, but they are not consistent. In general, the preference is to never get the value 60 for seconds.Here's a short script contributed by Jared Lee, that further illustrates the inconsistency using the cd_string and ut_string functions:
  load "$NCARG_ROOT/lib/ncarg/nclscripts/contrib/cd_string.ncl"
  load "$NCARG_ROOT/lib/ncarg/nclscripts/contrib/ut_string.ncl"

  do testSec = 0, 360, 60
     testSec@units = "seconds since 1970-01-01 00:00:00"
     print("testSec (cd_string) = "+testSec+" -> "+cd_string(testSec, "%N/%D/%Y, %H:%M:%S"))
     print("testSec (ut_string) = "+testSec+" -> "+ut_string(testSec, "%N/%D/%Y, %H:%M:%S"))
  end do
The inconsistent values are noted in red:
     testSec (cd_string) =   0 -> 01/01/1970, 00:00:0
     testSec (ut_string) =   0 -> 01/01/1970, 00:00:00
     testSec (cd_string) =  60 -> 01/01/1970, 00:00:60
     testSec (ut_string) =  60 -> 01/01/1970, 00:01:00
     testSec (cd_string) = 120 -> 01/01/1970, 00:02:00
     testSec (ut_string) = 120 -> 01/01/1970, 00:02:00
     testSec (cd_string) = 180 -> 01/01/1970, 00:03:00
     testSec (ut_string) = 180 -> 01/01/1970, 00:03:00
     testSec (cd_string) = 240 -> 01/01/1970, 00:03:60
     testSec (ut_string) = 240 -> 01/01/1970, 00:04:00
     testSec (cd_string) = 300 -> 01/01/1970, 00:04:60
     testSec (ut_string) = 300 -> 01/01/1970, 00:05:00
     testSec (cd_string) = 360 -> 01/01/1970, 00:06:00
     testSec (ut_string) = 360 -> 01/01/1970, 00:06:00
In an attempt to fix this problem, we searched for other calendar software packages, and found one called "Calcalcs", created by David W. Pierce of UCSD, who is also the author of Ncview. This software fixes the "60 second" bug, but it doesn't treat year 0 and year 1 as the same.
Instead of replacing the buggy code in the cd_xxxx and ut_xxxx routines, we decided to create temporary new routines that use Calcalcs under the hood. We want users to get the chance to try them out before we make any decisions about what to do with all of the calendaring routines.
Graphics bugs fixed
- The labelbar associated with filled contour and color vector plots
will now reflect any transparency applied. See the section
on Backwards-incompatible
changes in 6.4.0 for more information.
- Improved some issues with triangular meshes, which are used under
the hood for contouring unstructured data. This included fixes for
using triangular meshes with WRF and ICON data.
- Fixed some issues where contour fill plots were missing small fill areas
around the edges of the plot. These were most likely to occur when an axis was
reversed and/or a logarithmic or irregular transformation was in effect.
- Fixed an issue that resulting in a seg fault when using the "CurlyVector" mode
for plotting vectors. This seg fault did not impact the graphics output
but was annoying and could prevent continued work in the same script or
interactive session.
- Fixed a seg fault involving CellFill contouring using the TriangularGrid method.
- Fixed a problem that led in some cases to the left half of a CylindricalEquidistant
contour plot being left blank. The issue involved the boundary at the cyclic point of
the map.
- Fixed a bug where CellFill contouring wasn't recognizing
the cnMissingValFillColor
resource. This was reported in relation to plotting ICON data.
- gsn_attach_plots - Fixed a bug
where attaching plots along the X axis, when the Y axis labels
weree of different sizes, the plots would be misaligned.
- gsn_create_text - Fixed a bug
which didn't allow for multiple text strings to be input, as
advertised.
- gsn_csm_pres_hgt_vector - Fixed
a bug where this function didn't
recognize pmLabelBarWidthF
or pmLabelBarHeightF settings for
controlling the size of the labelbar.
- gsn_csm_vector_scalar_map /
gsn_csm_vector_scalar_map /
gsn_csm_vector_scalar_map_ce /
gsn_csm_vector_scalar_map_polar -
Fixed a bug in which you'd get a warning:
warning:vcRefAnnoFontHeightF is not a valid resource in
         gsn_csm_vector_scalar_map_contour at this time
and the vector reference annotation may have been larger than expected.
- gsn_open_wks - Fixed a bug where
NCL would fail if you used really long names (> 320 characters) for
output graphics filenames.
- gsn_panel - This function
now allows you to set more resources to customize the panel labelbar,
like lbLabelAlignment.
- gsnYRefLine /
gsnAboveYRefLineColor /
gsnBelowYRefLineColor
- Fixed a bug that didn't allow you to use a mix of scalar values or arrays for
these resoures, if you had multiple curves.
- pie_chart - Fixed a bug that
caused an unnecessary fatal error:
fatal:fspan: number of elements parameter is less-than-or-equal-to one, can't continue
Miscellaneous bugs fixed
- Fixed a catastrophic failure that occurred if the "shea_util.ncl"
script was loaded multiple times from the same script.
Many users of ESMValTool reported not being able to use NCL V6.3.0 because it would seg fault. This was caused by a missing undef statement in the "shea_util.ncl" library for the "mreg_part_corr" function. This bug has been fixed and we've taken extra steps to make sure all the other loaded NCL scripts have "undef" statements before every function and procedure.
- Fixed an issue where interactive NCL would not resume after a <ctrl>-z
On Mac systems, if you ran ncl interactively and then typed <ctrl>-z, you couldn't resume ncl by typing "fg". This has been fixed.
- Fixed a seg fault that occurred when you tried to use basic NCL
syntax on plot variables.
For example:
wks = gsn_open_wks("x11","") ;; tested png and x11 both fail plots = new(5, graphic) do p=0,4 plots(p) = gsn_csm_blank_plot(wks, res) end do plots = plots(::-1) ; seg fault would occur here - Fixed an issue with NCL failing after a very great many variables had been created. The code for
growing the relevant data structure was at fault.
- Fixed an incorrect warning from the function isfilepresent.
Miscellaneous improvements
- Plotting unstructured or "random" data
When using one of the gsn_csm_xxxx_map functions to plot unstructured or "random" data represented by one-dimensional lat/lon arrays, you can now attach these arrays as special attributes called "lat1d" and "lon1d" attributes to your data array, instead of having to set the sfXArray and sfYArray resources. This is similar to how the "lat2d" and "lon2d" attributes work for curvilinear data.
For some examples, see the Plotting data on a map examples page.
- Plotting WRF data
If you plot WRF-ARW data using the gsn_csm_xxx scripts, you will no longer get these warning messages:
  warning:start_lat is not a valid resource in wrf_gsn_contour at this time
  warning:start_lon is not a valid resource in wrf_gsn_contour at this time
  warning:end_lat is not a valid resource in wrf_gsn_contour at this time
  warning:end_lon is not a valid resource in wrf_gsn_contour at this time
  warning:mpNestTime is not a valid resource in map at this time
Note: you can safely ignore these warnings with older versions of NCL.
You can now use cnFillPalette with wrf_contour without getting the following error:
warning:ContourPlotSetValues: color index (255) exceeds size of palette, defaulting to foreground color for entry (11) - wrf_user_getvar
Overhauled this code to improve the handling of multiple timesteps, either in one WRF file or across multiple files.
- Overhauled special "gsn" color resources to allow RGB/A entries
Many of the special"gsn" Color resources now allow all types of color entries, including color index values, named colors ("red"), RGB values, and RGBA values. Use of RGBA allows you to make filled areas partially transparent.
The updated resources include:
- gsnAboveYRefLineBarColors / gsnBelowYRefLineBarColors
- gsnAboveYRefLineColor / gsnBelowYRefLineColor
- gsnHistogramBarColors
- gsnXYAboveFillColors / gsnXYBelowFillColors
- gsnXYBarChartColors
- gsnXYBarChartColors2
- gsnXYFillColors
- gsnXYLeftFillColors / gsnXYRightFillColors
- gsnYRefLineColor
- gsnXRefLineColor
- gsnYRefLineColors
- Default X11 window now larger
When sending NCL graphics to an X11 window, the default size is now 1000 x 1000 (it was 512 x 512).
- Colorado counties improved
The Colorado counties in NCL's map database were updated to include Broomfield and the correct boundaries for existing counties. See example maponly_28.ncl.
- Handling of constant and near-constant value fill updated
Traditionally NCL has not been able to contour areas that have constant value when using the AreaFill method since it depended on the presence of at least one virtual contour line to decide that there was anything to draw. The problem included not only true constant value data, but also data where the only the area mapped into the viewport was constant, or where the data was not constant but fell entirely within two adjacent specified contour levels. Prior versions of NCL have included a work-around fix that often, but certainly not always, worked to allow these areas to be drawn with the proper color. This fix was activated by setting the resource cnConstFEnableFill True.
Now a new and hopefully more robust solution to this issue has been implemented. For now, cnConstFEnableFill still needs to be set True only in the case of truly constant data. The intention is that within one or two releases the default for this resource will change from False to True, so that plots of constant data are always filled.
Note that there are a few cases where fill of constant data still does not work. These are rare but mostly encountered when using a TriangularMesh grid for contouring.
See example coneff_17.ncl.
Known issues
- There's a bug
in ncl_convert2nc
that causes it to not work properly if you give it more than two
files. This bug will be fixed in the next release of NCL. If you need
the fix now, you can download this
new version of ncl_convert2nc.
- There are two bugs in the 6.4.0 version
of gsn_csm_xy associated
with adding an X or Y reference line(s):
- Drawing your curves with markers or markers and lines
(xyMarkLineMode = "markers" or
"marklines") - this causes extra markers to show up at locations where
the X or Y reference line crosses your curve(s).
[See this sample xyreflinebug.ncl script and image.]
- Drawing a different number of X and Y reference lines
via gsnYRefLine and
gsnXRefLine in one plot - this causes the
following error message:
fatal:Number of dimensions on right hand side do not match number of dimension in left hand side
fatal:["Execute.c":8640]:Execute: Error occurred at or near line 6014 in file
     /usr/local/lib/ncarg/nclscripts/csm/gsn_csm.ncl
[See this sample xyreflinesbug.ncl script and image.]
To fix both problems, download this gsn_csm_640_fix.ncl script and load it from your own script after any other load commands.
- If you are running a script that panels XY plots and getting this error:
fatal:Variable (mono_fill_scl) is undefined
fatal:["Execute.c":8640]:Execute: Error occurred at or near line 6100 \
   in file $NCARG_ROOT/lib/ncarg/nclscripts/csm/gsn_code.ncl
then the issue is that you are setting gsnPanelLabelBar to True, which is not recognized for XY plots. To fix, simply comment this resource setting or remove it.
- Drawing your curves with markers or markers and lines
(xyMarkLineMode = "markers" or
"marklines") - this causes extra markers to show up at locations where
the X or Y reference line crosses your curve(s).
Version 6.3.0
March 18, 2015
- New functions
- Updated functions
- Potential backwards-incompatible changes
- Improvements
- New color table
- Bugs fixed
- Known bugs
New functions
- advect_var - Advect a
variable horizontally: U*(dQ/dlon) + V*(dQ/dlat). This function
was inadvertently advertised as advect_variable. The 6.3.1
release will support advect_variable name as an alias.
- bw_bandpass_filter - Applies a butterworth bandpass
filter optimized for narrow bandwidths to time series.
- count_unique_values - Counts the number of
unique values in the given array.
- determinant - Calculates the determinant of a
square real matrix.
- ezfftf_n - Performs a Fourier analysis on a
real periodic sequence on the given dimension.
This is identical to ezfftf, except it allows you to specify the dimension of which to do the analysis on.
- ezfftb_n - Performs a Fourier synthesis from
real and imaginary coefficients on the given dimension.
This is identical to ezfftb, except it allows you to specify the dimension of which to do the synthesis on.
- draw_color_palette - Draws the given colors or
color map as a series of filled boxes.
- eofunc_north - Use North et
al (MWR, 1982) equation 24 to evaluate eigenvalue separation.
- fftshift - Rearranges an array in a manner
similar to
Matlab's fftshift
function.
- generate_sample_indices -
Generate indices (subscripts) for resampling: with and without
replacement.
- get_unique_values - Returns the unique values
of the given array.
- New "gsm_csm_streamline_scalar_xxxx" routines were added
(thanks to Alan Brammer of UAlbany for the contribution)- gsn_csm_streamline_scalar
- gsn_csm_streamline_scalar_map
- gsn_csm_streamline_scalar_map_ce
- gsn_csm_streamline_scalar_map_polar
- kmeans_as136 -
Perform k-means clustering via the Hartigan and Wong AS-136 algorithm.
- ListIndexFromName - Returns the index of a
variable in a list given its name.
- pot_temp - Computes
potential temperatures.
- pot_vort_hybrid - Computes
potential vorticity on hybrid levels and a global grid.
- pot_vort_isobaric - Computes
potential vorticity on isobaric levels and a global grid.
- str_match_ic_regex - Matches the given
string against a list of strings using regular expression syntax (case
insensitve).
- str_match_ind_regex - Matches the given
string against a list of strings using regular expression syntax (case
sensitve) and returns index values.
- str_match_ind_ic_regex - Matches the given
string against a list of strings using regular expression syntax (case
insensitve) and returns index values.
- str_match_regex - Matches the given string
against a list of strings using regular expression syntax (case
sensitve).
- static_stability -
Computes static stability.
- thornthwaite - Estimates the potential
evapotranspiration (PET) via the Thornthwaite method.
- trend_manken - Mann-Kendall non-parametric
test for monotonic trend plus the Theil-Sen robust estimate of linear
trend.
- weibull - Derives the shape and scale
parameters for the Weibull distribution via maximum likelihood
estimates.
- wrf_user_vert_interp -
Vertically interpolates ARW WRF variables given the type of surface
and a set of new levels.
Updated functions
- dim_spi_n - Added second method for
calculating SPI, by applying a type III Pearson distribution.
- gsn_panel - Updated to recognize
streamline plots, so you can panel multi-color streamline plots with a
common labelbar.
- wrf_user_getvar - a
new "cloud top temperature" diagonistic was added ("ctt").
Potential backwards-incompatible changes
- Change to gsnAddCyclic behavior -
When plotting lat/lon data, a longitude cyclic point will not be added
if you have a longitude coordinate array whose range is greater than
360. Previously, you would get a warning and potentially incorrect
results:
gsn_add_cyclic: Warning: The range of your longitude coordinate array is at least 360. You may want to set gsnAddCyclic to False to avoid a warning message from the spline function. - The behavior of polylines and polygons drawn over maps was
modified slightly in order to avoid ambiguity concerning cyclic
longitude values. Now map polylines and polygons always use the
shortest path around the globe between any two points. (This is a
possible backwards incompatibility for anyone who formerly drew a
continuous circle around the globe using only 2 points (0 and 360).
Now you must use 4 points to accomplish the same thing, e.g.: (0 120
240 0).
Improvements
File I/O improvements
- HDF5 reader - a number of improvements have been made to NCL's
HDF5 reader to better handle:
- dimension names
- coordinate variables (if any)
- the _FillValue attribute (which sometimes comes in as a string called "MissingCode")
- Added a new setfileoption option called
"KeepOpen" for fbinrecread to improve the
efficiency of reading records in sequential order. This option is
logically-valued and available for the "bin" format only. When
finished reading the file the user must
call fbinrecread once with "KeepOpen" set False in
order to close the file.
- Updated the existing ECMWF GRIB 1 tables and added 6 new ones:
213,214,215,217,218,219,220, and 221. (these are not yet documented in
our docs). Also updated the NCEP GRIB1 tables and the NCEP GRIB2 code
tables.
- NCL now looks all the way through a file if necessary to find a
valid GRIB record.
- Fixed several memory management issues both for GRIB 1 and GRIB 2.
- File list variable assignment from addfiles is
now more tolerant of cases where one or more of the input files do not
contain the variable specified. It no longer crashes, and instead gives
an error like:
  A valid instance of variable HGT_P0_L100_GLL0 was not
   found in one or more elements of the file list.
If no files contain an instance of the variable, a fatal error is returned; otherwise it's a warning.
- readAsciiTable has been
made 'thread-safe' with the addition of code suggested by Kyle
S. Griffin (University of Wisconsin - Madison). Daniel Leuenberger
(Federal Office of Meteorology and Climatology MeteoSwiss) contributed
to the discussion.
Computational function improvements
- MJO
CLIVAR: Diagnostic mjoclivar_14.ncl
- Will automatically determine the appropriate sign of the EOFs
using an approach suggested by (Eun-Pa Lim, Centre for Australian
Weather and Climate Research [CAWCR]). This was added on 20 October
2014.
- Calculates the percent variance for each component in the multivariate EOF. The code segment was provided by Marcus N. Morgan (Florida Institute of Technology). This was added on 4 March 2015.
- Will automatically determine the appropriate sign of the EOFs
using an approach suggested by (Eun-Pa Lim, Centre for Australian
Weather and Climate Research [CAWCR]). This was added on 20 October
2014.
Graphical improvements
- You can now set trLineInterpolation
False for map plots in order to draw straight-edged polylines or
polygons. This means there now are three options:
- res@trLineInterpolation = True
(the default)
Lines will be interpreted in the lat/lon coordinate space.
- res@mpGreatCircleLinesOn = True and
res@trLineInterpolation = True
Lines will follow a great circle path.
- res@trLineInterpolation = False
Lines between points will appear straight in the projected space.
- res@trLineInterpolation = True
(the default)
- Large triangular meshes (greater than approximately 40,000,000
triangles) no longer fail due to limits implicit in the Shewchuck
Triangle code. Now when meshes exceeding this limit are encounterd,
the mesh is decomposed into 2 or more tiles which are triangulated
separately. Along with this were some major performance enhancements.
- Support for OpenMP raster graphics has been improved, such that
this capability is at better than beta level reliability. Note that
support for OpenMP relies on the same tiling mechanism used to handle
large meshes. OpenMP now can be used with any map projection, and the
artifacts, including visible lines between the tiles, have been
eliminated. See the entry in
the 6.2.0 release notes for
notes on how to use the OpenMP capability.
Miscellaneous improvements
- Any numeric type can now be used for coordinate subscripting;
subscripts no longer need to be the same type as the coordinate variable.
New color table
A small color table was added with two whites in the middle: BlAqGrWh2YeOrReVi22.
Bugs fixed
- MJO CLIVAR: Diagnostic mjoclivar_16.ncl
phase composites were off by half a cycle. This has been corrected.
This is immediately available for download as of 20 October 2014.
- bin_avg / bin_sum - fixed a
bug where the binning was done incorrectly if the observation
locations were outside the region spanned by the user provided
grid. These functions weren't explicitly checking for this situation.
- delete - fixed a problem with deleting
coordinate arrays in a list-type argument.
- dewtemp_trh - fixed a bug where if rh
was < 0.0, then a NaN (not-a-number) was returned. The function
now returns a missing value.
- dim_avg_wgt_n
/ dim_sum_wgt_n - fixed a bug where the return
value had no dimensionality (0 bytes) if "x" was a 1D array.
- dim_sum_wgt / dim_sum_wgt_n
- fixed a bug where if "opt" was 0 and there were missing values in
the input array, then a non-missing value was being returned.
According to the documentation, a missing value should have been
returned instead.
- ESMF_regrid - fixed a bug where if the
"neareststod" or "nearestdtos" interpolation methods were used, the
"remap" attribute attached to the regridded variable still said
"bilinear".
The "remap" attribute now uses the "ESMF_regrid_method" attribute attached to the weights file, and hence will be more verbose than it previously was.
Old:
  remap : remapped via ESMF_regrid_with_weights: patch
  remap : remapped via ESMF_regrid_with_weights: conserve
New:
  remap : remapped via ESMF_regrid_with_weights: Higher-order Patch
  remap : remapped via ESMF_regrid_with_weights: First-order Conservative
- gsn_merge_colormaps - this
function gives you a warning if you try to merge two colormaps.
  Warning: namedcolor2rgb: 'gsdtol' is not a valid named color.
  Will return missing values for this color.
Despite this warning, the function still works as advertised. This warning has been removed in V6.3.0.
- stat_dispersion - The
second returned element returned was the sample variance and not the
sample standard deviation as is documented. In 6.3.0, the sample
standard deviation will be returned.
- svd_lapack - Fixed a memory leak. Results were not affected.
- ListPop - fixed a bug when pop an unnamed
variable (or value) from a list.
- Fixed a problem with CellFill plotting when using
the mpFreeAspect parameter. Cells
that were specially drawn to fill in the edges of the plot were not
appearing in the correct location. Now it works as expected and most
of the special handling was able to be removed.
- Fixed a problem with HDFEOS5 attributes where they were all being
processed as string types whether or not they really were.
- Fixed a problem where non-geographic 2D plots were not being drawn
correctly. The "Spherical" transformation was incorrectly being used
for all types of 2D coordinate overlays, when the more general
"Curvilinear" transformation should have been employed.
- Fixed a problem with tickmark formatting where numbers that should
have become zero, given the number of significant digits, were instead
set to small decimal values with lots of zeros,
Known bugs
- If you try to execute NCL on a system where there are no user home
directories, then you may run into an issue where it's looking for a
"~/.hluresfile" file.
As a work-around, a system administrator can create a blank file called "hluresfile", put it wherever he/she wants (for example, $NCARG_ROOT/lib/ncarg), and then have every user set the NCARG_USRRESFILE environment variable to point this dummy file:
export NCARG_USRRESFILE=$NCARG_ROOT/lib/ncarg/hluresfile
- cd_calendar - there is a potential rounding bug
in this routine if you have a units of "minutes since" or "seconds
since". It sometimes causes the minutes/seconds to be returned as
something like "0/60" (0 minutes/60 seconds) rather than "1/0" (1
minute/0 seconds). We have an email in to the developers of this
code, but until we get a fix, you can
use ut_calendar as a work-around, if you are using
a "standard" calendar.
- kolsm2_n - Fixed bug in which using multiple
dimensions (for example, in the time dimension) would cause the
results to be wrong. Please visit the documentation for this function
for more details and a work-around. This has been fixed for NCL
Version 6.3.1.
- For HDF5 files with variables within "groups", the use of addfiles with ListSetType (f, "join") does not work. The default mode where ListSetType (f, "cat") does work.
Version 6.2.1
September 2, 2014
Backwards-incompatible changes
- isfilepresent - This function has been updated
to behave as originally intended: as companion test for checking if a
file exists before trying to open it with addfile.
To check for the existence of any file, regardless of what kind of file it is, use the new fileexists function.
- circular_1.rgb
/ circular_2.rgb
- The RGB tables have been altered to provide more color
differentiation in the 'green' colors. For example, in circular_1.rgb:
          ncolors=12
          # R    G    B
            255    0    0     red
            255  125    0     orange
            255  255    0     yellow
            125  255    0     spring green
              0  255    0     green                ==> 102  204    0  ; new color
              0  255  125     turquoise            ==> 102  255  178  ; new color
              0  255  255     cyan
              0  125  255     ocean
              0    0  255     blue
            125    0  255     violet
            255    0  255     magenta
            255    0  125     raspberry
New functions
- dim_acumrun_n - Calculates individual
accumulated sums of sequences ('runs') of a specified length.
- escorc_n - Computes sample cross-correlations
at lag 0 only, across the given dimensions.
- fileexists - Checks for existence of any UNIX file.
- pdfxy_conform - An interface to pdfxy that allows the input arrays to be different sizes.
- regCoef_n - Calculates the linear regression
coefficient between two variables on the given dimensions.
Updated functions
- ESMF_regrid
/ ESMF_regrid_gen_weights
Options added:
- "NetCDF4" - If set to True, then the intermediate
source/destination description files and the weights file will be
written as NetCDF-4 files (instead of NetCDF-3).
- "NoPETLog" - If set to True, then the
"PET0.RegridWeightGen.Log" file will not be generated.]
- "Check" - If set to True, then extra analytic output will be
computed and printed, including the mean relative error between the
destination and analytic field, and the relative error between the
mass of the source and destination fields in the conservative case.
- "NetCDF4" - If set to True, then the intermediate
source/destination description files and the weights file will be
written as NetCDF-4 files (instead of NetCDF-3).
- gsn_contour_shade - this function
was updated to allow RGB or RGBA values to be used for the gsnShadeLow,
gsnShadeMid, or gsnShadeHigh resources.
- isfilepresent - see note above in
the backwards-incompatible
changes section.
- smthClmDayTLL
and smthClmDayTLLL - Made these
functions less restrictive; they now work on daily SST data which have
_FillValue over land.
- taper / taper_n - added
an option to allow the series to be tapered to 0.0. These functions
currently only taper to the series mean.
Bugs fixed
- Fixed a serious bug where assigning a variable as an attribute of
another variable caused the original variable's _FillValue to be
modified.
Here's a sample script that demonstrates the problem in V6.2.0:
x = new (2, float) print("any(ismissing(x)) should be True") print(" actual value is " + any(ismissing(x))) ;---Assign "x" as an attribute of "y" y = True y@x = x print("any(ismissing(x)) should be True") print(" actual value is " + any(ismissing(x))) ; will be False in V6.2.0 - fspan - fixed a bug where if you inputted 1 for
the third argument (the number of points to return), this function
was returning a single value equal to 0. This function now prints
an error for anything less than 2 points.
- gsn_contour_shade - this
function was fixed so it doesn't fail if "gsnShadeMid" is set, but
only one contour level is found between the low and high values input.
- mixhum_ptrh - a bug was fixed in which negative
"iswhit" values were not being properly recognized.
- month_to_annual_weighted -
fixed error related to the calendar attribute. It referred to
"yyyymmdd" when it should have referred to "yyyymm".
- pdfxy - Fixed 'y' bounding box boundary error discovered by Maria Gehne (NOAA/CIRES). Specifically:
Changed binyBound(nbinsy) = binxBound(nbinsy) + epsy*binyBound(nbinsy) To binyBound(nbinsy) = binyBound(nbinsy) + epsy*binyBound(nbinsy) - yyyymmddhh_to_yyyyfrac -
fixed error related to the calendar attribute. It referred to
"yyyymmdd" when it should have referred to "yyyymmddhh".
- uv2dv_cfd - a bug (brought to out attention by Wei-Jen Tseng) was fixed
when extrapolating values to the lower boundary.
Changed x(ml,nl) = (2.d0*x(ml,nl-2)-x(ml,nl-2)+2.d0*x(ml-1,nl)-x(ml-2,nl))*0.5d0 To x(ml,nl) = (2.d0*x(ml,nl-1)-x(ml,nl-2)+2.d0*x(ml-1,nl)-x(ml-2,nl))*0.5d0 - A bug was fixed when trying to write a single string variable to a
NetCDF-4 file.
- wallClockElapseTime - minor
fix to have "date" returned in the correct format expected.
- The GRIB2 reader was updated to recognize the level information for
records with Product Definition Template (PDT) numbers greater than
14. The PDT number is the first value in the quadruple value of the
GRIB2 variable attribute
"parameter_template_discipline_category_number". The result of this
fix is that a level dimension may be present where previously none
appeared because the various level records were seen as
duplicates. Also the name of the variable will be different to account for
the level type. For example, where a variable in an affected file
prior to the fix had the name, 'CAT_P15_GLL0_max' and 2 dimensions
(lat_0, lon_0), it now has the name 'CAT_P15_L100_GLL0_avg' and 3
dimensions (lv_ISBL0, lat_0, lon_0).
- The GRIB2 reader's handling of forecast time units of a month or more was
improved to more accuractely compute the forecast time dimension values. In certain
cases, this fixes a problem that led to fewer elements along the
forecast time dimension than there should have been.
- A bug fixed to allow NCL recognizing string coordinate variable.
Version 6.2.0
April 2, 2014
- Potential backwards-incompatible changes
- Significant improvements and bug fixes to NetCDF, HDF, and GRIB readers
- Contouring improvements
- Significant improvements to the speed of drawing shapefile lines or polygons
- Improvements and bug fixes to ESMF regridding routines
- Improvement to "thin line" graphical issue
- New functions
- New graphical resources
- New graphical output format
- New color tables
- Library for generating KML output from NCL
- Updated functions
- Bugs fixed
- Change in HDF4 build instructions
Potential backwards-incompatible changes
- Significant change to raster contouring
There are two important things to know about with regard to raster contouring:
- Raster contouring now supports transparency. This means that
missing value areas will now be transparent rather than filled in the
background color.
If you are drawing raster contours over maps and have missing values in your data, you may now see gray-filled missing value areas instead of white-filled areas. This is not a bug. :-)
This is because any gray-filled land that was underneath the missing value areas will now be visible. If this is undesired, set:
res@cnMissingValFillColor = "white"
Click on the following images for a "before" and "after" example of how this might look:
Version 6.1.2 Version 6.2.0 
- If you are sending your graphics to a PostScript file and seeing
horizontal rows of cells that seem wrong, then this is likely a bug in
the tool you're using to display the PS file.
Graphics display tools like gv, gs, evince, and ImageMagick's display depend on ghostscript; older versions of ghostscript have a bug that is sometimes triggered by raster graphics containing transparent cells output to PostScript. This bug was fixed sometime between versions 8.70 and 9.06 of ghostscript. Updating your version of ghostscript should fix this issue.
- Raster contouring now supports transparency. This means that
missing value areas will now be transparent rather than filled in the
background color.
- Printing double-precision values
You will see more precision when printing doubles with functions like print. This could cause a problem if you are using print or other printing functions to write to ASCII files, where you are expecting a certain precision.
For example the following 2-line code:
  d = -62.02990341186519d
  print("d = " + d)
will produce the following output:
Version 6.2.0:
d = -62.02990341186519dVersion 6.1.2 and older:
d = -62.0299 - Automatic loading of scripts
You no longer need to include these load commands at the top of your NCL script:
  load "$NCARG_ROOT/lib/ncarg/nclscripts/csm/gsn_code.ncl"
  load "$NCARG_ROOT/lib/ncarg/nclscripts/csm/gsn_csm.ncl"
  load "$NCARG_ROOT/lib/ncarg/nclscripts/csm/contributed.ncl"
Your scripts will still work if you load these scripts, so you may not want to remove them if you need older versions of NCL to still work.
There's a bug where if you try to load these scripts after the "begin" command:
begin
load "$NCARG_ROOT/lib/ncarg/nclscripts/csm/contributed.ncl"
end
We recommend in general that you load these scripts before the "begin" command.
- Changes to str_match behavior
The str_match family of functions:
now only match literal occurrences of the sub-string expression argument and no longer recognize regular expression syntax. This is how these functions have always been documented. Recognition of regular expressions required the user to escape special characters such as '*', '[', and '?' with a '\' character. This behavior was confusing to many users and was more complicated than initially intended for these functions. In the future, we hope to introduce other functions for matching using regular expressions.
- Changes to map drawing behavior
Previously, drawing a polyline around the equator, for example, could be specified using 2 element arrays in X (0.0, 360.0) and Y (0.0, 0.0). Now, however, in order to eliminate a number of ambiguous situations and to make user code simpler in most cases, a new behavior has been introduced: the line between 2 points on the globe always follows the shortest path. In the example above, the new behavior leads to a 0-length line. Now the recommended approach for drawing a line around the equator is to use four points, such that the distance from one to the next is always less than 180 degrees. For example you could use longitudes (0.0, 120.0, 240.0, 360.0).
It is possible to use only three points with longitude (0.0, 180.0, 360.0), owing to the rule for distances that are exactly 180 degrees apart: in this case, with valid longitudes values ranging from -540 to +540, the line extends from the lower longitude in the direction of increasing longitude values.
This new behavior should considerably simplify the code required to ensure that lines crossing the prime meridian follow the desired trajectory. It applies as well to polygons.

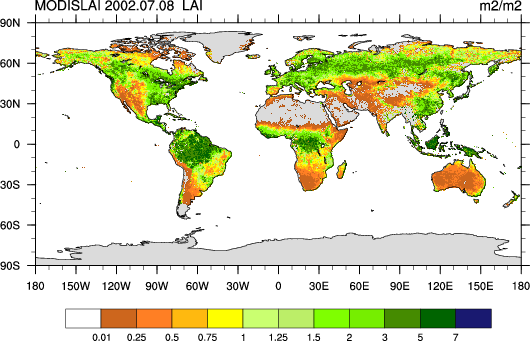
Improvements to NetCDF, HDF, and GRIB readers
- Numerous improvements and bug fixes have been made to the NetCDF-4
file I/O:
- Fixed issues with writing NetCDF4Classic files.
- Fixed issues with reading multiple NetCDF4 files.
- Fixed issues handling groups with special characters.
- addfiles now works on NetCDF4 files.
- Variables read off HDF-EOS2 files will now have all the metadata
included, without having to first read the file as an HDF file,
and then as an HDF-EOS file.
- GRIB improvements:
- Implemented support for reading GRIB2 files that are greater than 2GB in size. (Support for reading files larger than 2GB has
been available for GRIB1 files for a number of years.)
- If a center id is not recognized, NCL still gives a warning but
the center attribute will be set to "unknown", rather than eliminating
the attribute.
- The sub_center attribute was incorrectly giving the name of NCEP
sub-centers for centers other than NCEP. One non-NCEP subcenter is
explcitly recognized: the Max Plank Institute for Meterology. When
there is no information to identify a subcenter, the id number
(converted to a string) is given as the sub_center value, unless it is
0 or 255, which means there is no sub_center, in which case the
sub_center attribute is not generated.
- NCL was crashing if a text version of a parameter table was
specified using the NCL_GRIB_PTABLE_PATH, but the file contained no
header line (4 colon-separated numbers starting with -1).
This has been fixed, and now a warning about an invalid ptable file is issued.
- NCL now gives NCEP table 2 values for parameters above 127 in
cases where it does not recognize a valid parameter table / center
combination. A warning is still issued for these parameters.
- Some updates to the NCEP sub-center description strings, based on
the current docs at the NCEP GRIB site.
- An attribute called "generating_process_type" is now conditionally added to distinguish
variables in GRIB2 files with otherwise identical metadata. In this situation the variable names are only
distinguished with the addition of a suffix '_n', where 'n' is an integer. This was necessary to
properly decode certain NCEP RTMA (Real-Time Mesoscale Analysis) products.
- Fix for problem of improperly separating variables in certain ECMWF ERA files based on faulty comparison of
their Grid Description Sections.
- Fix for problem of excessive memory growth when using addfiles to read many GRIB files.
- Added a new naming convention and a new set of attributes to handle GRIB1 variables with "time period indicators" greater than 50. These indicate
various types of statistical processing. Low numbered values of this indicator continue to be represented with string suffixes such as "_avg" and "acc",
but the higher numbered values have more verbose descriptions. They are distinguished with a new suffix '_Sn', where n is the 2 or 3 digit number of the
time period indicator. Attributes have been added to describe the statistical process, including "statistical_process_descriptor", "statistical_process_duration",
and "N". "N" indicates the number of inputs to the statistical process used, and may be an array if the N varies, for example in monthly averages due to the
different number of days in each month.
- Implemented support for JRA55 (Japanese 55-year reanalysis project). This required supporting alternate definitions for certain level types and statistical processes
where the JRA55 has local definitions that are different the NCEP definitions.
- Added support for GRIB1 parameter tables from the Max Planck Institute for Meterology: tables 128, 180, 181, 199.
- Fixed a problem that occurred when the first record of a variable is missing.
- Implemented support for reading GRIB2 files that are greater than 2GB in size. (Support for reading files larger than 2GB has
been available for GRIB1 files for a number of years.)
Contouring improvements
- See the above section on a significant change to raster contouring.
- There are significant improvements to the speed of raster contouring.
- There is alpha-level support for using OpenMP to generated raster graphics using multiple threads. Currently availablity is limited to graphics generated by using 1D values for the resources
sfDataArray, sfXArray, and sfYArray and not setting
sfXCellBounds, sfYCellBounds, or sfElementNodes.
Set the environment variable "OMP_NUM_THREADS" to a number greater than one to activate this capability.
Currently using more than 9 or so threads sometimes causes artifacts to appear in the plot. Also using map projections other than cylindrical equidistant may result in lines
appearing at the edge of the blocks assigned to each thread.
- The CellFill contouring method can now render data on unstructured grids, including triangular grids, quadrilateral grids such as HOMME,
and geodesic grids with 5, 6, or more sided cells. The outlines of each cell
can be rendered by setting the resource cnCellFillEdgeColor to a non-transparent color.
The user must specify the cell vertices using the resources sfXCellBounds and sfYCellBounds.
Also to avoid errors, the resources sfXArray and sfYArray must be specified.
However, this requirement will be eliminated in the future.
- In most cases, users can now have constant or near-constant fields rendered as a filled area,
rather than having the contoured area remain blank. In order to activate this behavior, set the newly implemented resource,
cnConstFEnableFill, to True. By default, the constant field informational text box will still appear;
turn it off by setting cnConstFLabelOn to False. In the future, cnConstFEnableFill will likely default to True,
with cnConstFLabelOn defaulting to False unless contour line drawing is enabled.
- Better error reporting in situations where out-of-range (lat-lon) coordinate values cannot be handled. The error message suggests a possible fix for the problem: switching to use of the triangular mesh algorithm for
plotting.
Significant improvements to the speed of drawing shapefile polylines or polygons
The gsn_add_shapefile_polylines and gsn_add_shapefile_polygons functions were significantly sped up via the use of a new resource called gsSegments. Previously, an object was created for every segment added, which could cause thousands of objects to be created. Now, only one object is created.
We saw speed ups of 80 times faster in the case of drawing the France "Fra_adm5.shp" shapefile from gadm.org/country which has 37,188 polyline segments.
Note, too, that the use of these two functions is not really needed, since attaching shapefile polylines and polygons is now simplified. The following two segments of code are identical, assuming "plot" is some map plot that you want to attach shapefile polylines or polygons to:
Method 1:
  f = addfile("file.shp","r")
  lnres             = True
  lnres@gsLineColor = "NavyBlue"
  lnres@gsSegments  = f->segments(:,0)
  poly = gsn_add_polyline(wks, plot, f->x, f->y, lnres)
  draw(plot)
  frame(wks)
Method 2:
  lnres             = True
  lnres@gsLineColor = "NavyBlue"
  polyid = gsn_add_shapefile_polylines(wks,plot,"file.shp",lnres)
  draw(plot)
  frame(wks)
Improvements to ESMF regridding routines
- Two new interpolation methods have been added: "neareststod" and "nearestdtos".
- When regridding to or from
an unstructured grid, a
triangular mesh is generated internally by NCL. This can be a slow and
memory intensive operation, so a new option was added to allow the
user to input their own triangular mesh via SrcTriangularMesh
or DstTriangularMesh.
- Large file (opt@LargeFile=True) support is now turned on by default.
- ESMF_regrid /
ESMF_regrid_gen_weights -
A bug was fixed in which the "pole" option was only being recognized
if you set it as "pole" and not "Pole".
Improvement to "thin line" graphical issue
On rare occasions, plots from postscript, pdf, or SVG workstations may exhibit faint, light-colored gaps between adjacent filled regions. The effect is most noticeable when the regions are of the same color, and share a long, straight boundary. This artifact is believed to be caused by a bug in the underlying cairographics library. The problem has been reported to them.
We've improved the appearance of the plots by implementing a temporary internal work-around for NCL V6.2.0. See the two sets of images below for comparison (click on either thumbnail to see the problem more clearly.)
The first set of images is a modified version of the "ng4ex" example "cn05n". The second set of images were generated by this map_thin_line.ncl script.
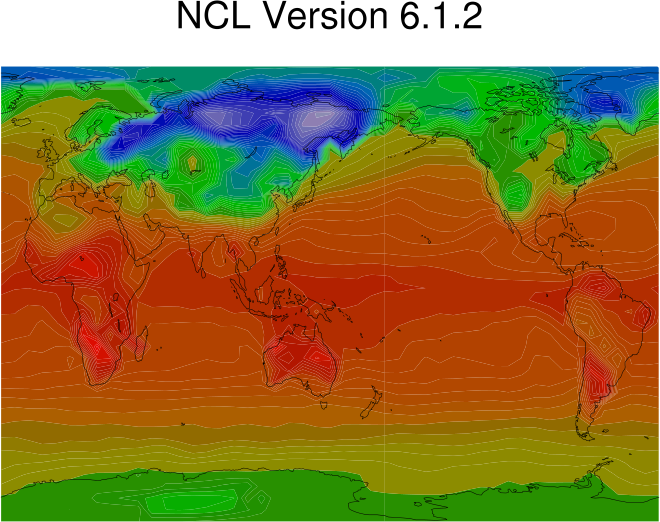
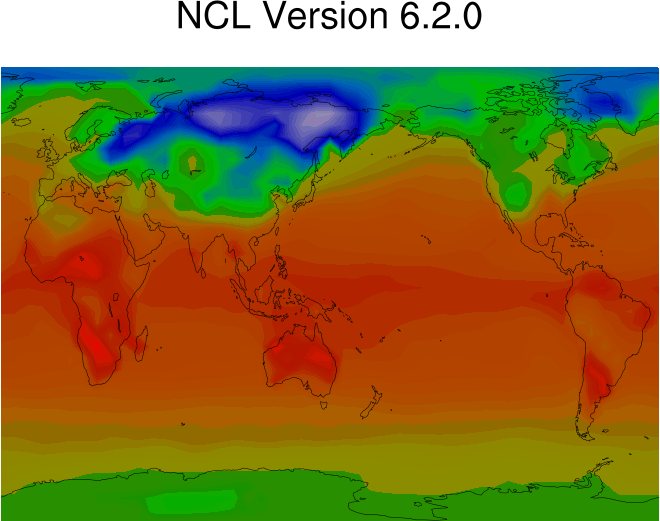
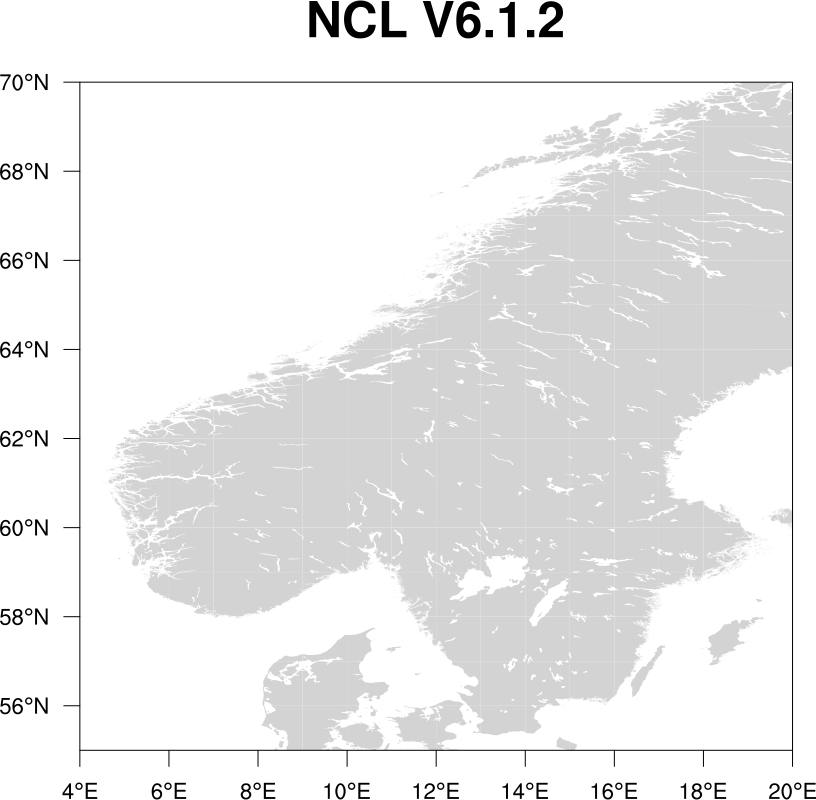
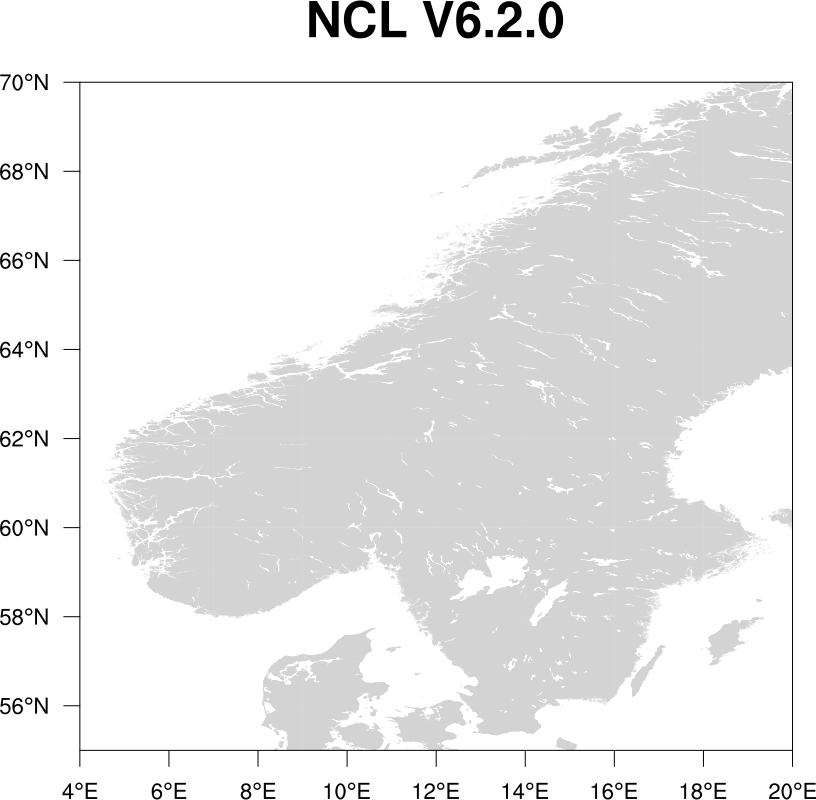
New Functions
- area_poly_sphere - Finds the area enclosed by
an arbitrary polygon on the sphere.
- calculate_monthly_values -
Calculate monthly values [avg, sum, min, max] from high frequency
temporal values.
- kolsm2_n - Test if two samples are compatible
with coming from the same distribution using the Kolmogorov-Smirnov
two sample test.
- lspoly_n - This function is the same
as lspoly, except it allows you to provide a
dimension on which to calculate a set of coefficients for a weighted
least squares polynomial fit to the given
data. lspoly always operates on the rightmost
dimension.
See the "bugs fixed" section below about a bug fix to lspoly.
- omega_to_w - Convert omega
vertical velocity (Pa/s) to (m/s).
- print_clock - Prints the
given string along with a current timestamp.
- reg_multlin_stats -
Performs multiple linear regression analysis including confidence
estimates and creates an ANOVA table. This is a driver which invokes the builtin
reg_multlin function. It is the preferred function
for performing multiple linear regression.
- regline_stats -
Performs simple linear regression analysis including confidence
estimates and creates an ANOVA table. It is the preferred function
for performing simple linear regression.
- w_to_omega - Convert w
vertical velocity (m/s) to (Pa/s).
- New WRF functions:
- wrf_omega - Calculates approximate omega, based
on vertical velocity, water vapor mixing ratio, temperature, and
pressure.
- wrf_virtual_temp - Calculates virtual
temperature, given temperature and mixing ratio.
- wrf_wetbulb - Calculates wet bulb temperature,
given pressure, temperature, and water vapor mixing ratio.
- wrf_omega - Calculates approximate omega, based
on vertical velocity, water vapor mixing ratio, temperature, and
pressure.
- New color-related functions:
- color_index_to_rgba - Converts one or more absolute
color index values into its equivalent RGBA quadruplet. This is useful for
discovering the RGBA values encoded into the high-numbered integers that
may be returned from performing a getvalues call for a
color-related resource such as cnFillColors. Note this function
does not currently work for color indexes less than 256 that are dependent on the
setting of wkColorMap.
- get_color_index - Chooses a color index for a
scalar value, given a color map and a range of values.
- get_color_rgba - Chooses an RGB triplet or RGBA
quadruplet for a scalar value, given a color map and a range of
values.
- namedcolor2rgba - Returns the
RGBA quadruplets of the given list of named colors.
- rgba_to_color_index - Converts one or more RGBA quadruplets
into its equivalent absolute color index.
- span_color_indexes - Given the number of
desired color values, return an array of indexes that nicely span the
given color map.
- span_color_rgba - Given the number of desired
color values, return an array of RGB triplets or RGBA quadruplets that
nicely span the given color map.
- color_index_to_rgba - Converts one or more absolute
color index values into its equivalent RGBA quadruplet. This is useful for
discovering the RGBA values encoded into the high-numbered integers that
may be returned from performing a getvalues call for a
color-related resource such as cnFillColors. Note this function
does not currently work for color indexes less than 256 that are dependent on the
setting of wkColorMap.
New graphical resources
- cnConstFEnableFill - Setting
this to True will force constant contour fields, or fields that fall
between two contour levels, to be filled in the appropriate color
or shaded pattern.
- gsnCenterStringFuncCode,
gsnLeftStringFuncCode,
gsnRightStringFuncCode,
gsnStringFuncCode - resources for
setting the function code character for the three subtitles at the top
of a plot.
- gsnXYBarChartFillDotSizeF - increases the
dot size in stipple-filled bar charts.
- gsnXYBarChartFillLineThicknessF -
increases the thickness of lines in a
pattern-filled bar chart.
- gsnXYBarChartFillScaleF - changes the
fill scale for pattern-filled bar
charts.
- gsnXYBarChartFillOpacityF - sets the
opacity for solid-filled bar
charts.
- gsnXYFillOpacities - sets an array of
opacities for solid-filled bar
charts which corresponds with
the gsnXYFillColors array.
- gsColors - This resource
allows you to set an array of fill or line colors for
polygons or line segments being attached to a plot via
the new gsSegments resource.
- gsSegments - This resource
allows you specify the start and end of line or polygon segments via
one large array. Using this resource can significantly speed up code
(we saw one script run 80 times faster) that is adding thousands of
segments to a plot. It is only available with polyline and polygon
drawing codes like gsn_add_polyline
and
gsn_add_polygon.
- mpPolyMode - This new resource
takes three possible values: "StandardPoly", "FastPoly", and
"AutoPoly". It should be used to set what method to use when
adding polygons to a map plot.
The default is "AutoPoly", meaning that the drawing code decides which type of polygon to draw based on the great circle distance of each component line segment, and on the polygon's graphic style attributes. If the great circle distance of any component line segment is greater than 10 degress or if any fill pattern other than solid is in effect, the "standard" method that was used in NCL versions 6.1.2 and earlier is used. Otherwise a faster method introduced in version 6.2.0 is used. The faster method may sometimes fail for polygons that have complicated crossing with the visible edges of curvilinear map projections.
- lbBoxSeparatorLinesOn - Setting this resource False allows you to have a perimeter line drawn around the "bar" of the LabelBar without having lines separating each component box within the bar.
New graphical output format
The "SVG" format is now supported in NCL. It can be used with gsn_open_wks in the same way as other formats like "png" and "pdf":
wks = gsn_open_wks("svg","example") ; Will create "example.svg"
New color tables
Over 120 new color tables were added to NCL. You can view and download these color tables now via the color table gallery. Special thanks to Nicolas Barrier of Laboratoire de Physique des Océans, Melissa Bukovsky of NCAR, and Carl Schreck of Cooperative Institute for Climate and Satellites - North Carolina for contributing these tables, which came from ColorBrewer, GMT, GrADS, matplotlib, and Ncview.
Library for generating KML output from NCL
NCL_GETools is a library for generating KML output with NCL. It was developed by Mohammad Abouali during the summer 2013 SIParCS internship program. The library is being made available on a preliminary basis to gauge user interest and to gather further use-cases and requirements.
Updated functions
- All 'date' related functions in contributed.ncl have been
updated to recognize the calendar attribute.
- ESMF_regrid /
unstructured_to_ESMF - See
ESMF Regridding improvements above.
- gsn_add_shapefile_polylines /
gsn_add_shapefile_polygons - See the
discussion in the "Significant
improvements to the speed of drawing shapefile lines or polygons"
section.
- gsn_csm_pres_hgt_vector - The
vcMapDirection resource now
defaults to False for this function. It remains set to True for
all other gsn_xxx_vector routines for now.
- print - you will see more precision when
printing doubles. For example, "-62.02990341186519" instead of
"62.0299".
- wrf_user_getvar - Three
new diagonistics were added:
- "tw" - wet bulb temperature
- "omg" - omega
- "vt" - virtual temperature
Bugs fixed
- A bug was fixed where byte value were being printed in hexadecimal format
instead of decimal format, when using print.
- addfiles: if the aggregated time coordinate has different units in the individual aggregated files, the values are now adjusted to conform to the units of the first file in the aggregation.
- ESMF_regrid /
ESMF_regrid_gen_weights - - See
ESMF Regridding improvements above.
- ezfftf / ezfftb - A bug was
fixed for the case where the number of points is odd.
- covcorm - A bug was fixed in which "iopt"
behaved the opposite of how it was described in the documentation:
- iopt=(/0,1/) behaves as if you had set iopt=(/1,0/)
- iopt=(/1,0/) behaves as if you had set iopt=(/0,1/)
- iopt=(/0,0/) or (/1,1/) works as described
- gsn_contour_shade - A bug was
fixed that didn't allow you to use
the gsnShadeHigh, gsnShadeMid, and
gsnShadeLow resources together.
- lspoly - This function was failing in certain
cases where the input data were "scaled" down. We decided to replace
this routine with a SLATEC
version. It takes the same arguments, but uses a different
algorithm under the hood. You can get the "old" (pre NCL V6.2.0)
version of lspoly by using "lspoly_old", but we don't recommend it for
regular use.
- pdfxy - Fixed a bug in which
values that exactly matched the rightmost edge of the rightmost
bin were not getting counted. There should be minimal effect on user
results.
- poisson_grid_fill - Fixed a bug that when the
data are cyclic, the leftmost boundary index was off-by-one. The bug
will have little or no impact on most users.
- read_colormap_file - This function
now works on any NCL color map (previously, it only worked
on *.rgb color maps in $NCARG_ROOT/lib/ncarg/colormaps).
- relhum - A bug was fixed in which all variables
had to have the _FillValue attribute if any one of the input variables
had an _FillValue attribute. Note that there is a potential incompatible
change with this fix. The return missing value is now whatever the
default missing value is for the type being returned, and *not*
the _FillValue associated with the input variable 't',
as it was in the past.
- stat_dispersion - Fixed a
bug that caused this function to fail when large arrays contained lots
or all missing values.
- str_split_csv - A bug was fixed in which if
you had a mix of commas and quotes, the fields were not
parsed properly.
- wrf_map_overlays - A bug was
fixed to correctly plot rotated lat-lon grids.
Change in HDF4 build instructions
If you are planning to build NCL V6.2.0 from source code, then take note that there's a change in where it expects to find the HDF4 include files.
Previously, you had to install them to an "hdf" subdirectory via a special "--includedir" option on the "configure" line. This is no longer required. This means if you are linking against previously-compiled versions of HDF4, you may need to move the include files out of "/xxxx/include/hdf" to "/xxxx/include".
Version 6.1.1 / Version 6.1.2
February 4, 2013 / February 7, 2013
Note: almost immediately after V6.1.1 was released, a few users reported a bug that warranted a V6.1.2 release immediately. For more information, see the discussion below on the wsMaximizeSize resource.
Since V6.1.1 had a number of new features, we will include the "what's new" for V6.1.1. V6.1.2 is a bug fix release only and doesn't contain any new features.
- New reassignment operator
- New functions
- New color tables
- Better support for NetCDF-4 files
- File I/O improvements
- Bugs fixed
- Known issues with version 6.1.1 and 6.1.2
New reassignment operator
There's a new operator, ":=", that allows you to reassign variables
without having to delete them first.
For example:
   x = fspan(-10.5,20.8,0.1)    ; array of floats
;  x = "This is a string"       ; this won't work
   x := "This is a string"      ; single string
This operator works for attributes as well, but not for coordinate arrays.
New functions
- covcorm_xy - Calculates a covariance or
correlation matrix given two separate arrays.
- dgeevx_lapack - Given a square (N,N) real
non-symmetric matrix, compute the eigenvalues and, optionally, the left
and/or right eigenvectors via the LAPACK subroutine
dgeevx.
- get_isolines - Retrieves the points that define
a contour line.
- totype - Converts values of any snumeric data
type or string to values of the given type.
New color tables
Joe Grim of NCAR/RAL contributed three new color tables to help colleagues who have difficulty discerning colors.
You can download these tables now and use them. Click on the "download now" link of the desired table, and then go to the "Move file to appropriate directory" section of the "create your own color table" page for information on adding this new table to your current version of NCL.
| cb_9step (download now) | cb_rainbow (download now) | cb_rainbow_inv (download now) |

| 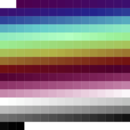
| 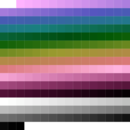
|
Better support for NetCDF-4 files
Support for NetCDF-4 files is in beta-testing in
V6.1.1.
We encourage people to test it out and give us
feedback on our ncl-talk email
list.
A number of improvements were made to NCL's "advanced file structure" that was added in V6.1.0 to address new data features in NetCDF-4, like groups, compound data types, variable length arrays, and multiple unlimited dimensions. There are some examples of these new features on the "Write to NetCDF" section of the examples page.
File input/output improvements
- Improved the handling of record marker sizes when reading/writing
Fortran binary files. You can now specify the record marker size by
setting the "RecordMarkerSize" parameter in a call
to setfileoption
- Added support for GRIB1 GDS grid 205, described as "Arakawa Non-E
Staggered rotated Latitude/Longitude Grid".
File input/output bugs fixed
- Several NetCDF bugs were fixed (in reference to NetCDF-4 files,
and not NetCDF "classic" files, which have worked as they always
have):
- Writing an undefined variable directly to a file.
- Writing a scalar to a file.
- Printing a variable's attribute when it is double.
- Adding global attributes to an existing file.
- If two files are opened, where the first one is NetCDF3 and second
one is NetCDF4, then there was a problem operating on the first file.
- dtrend_quadratic_msg_n - The "remove_mean"
parameter was behaving the opposite of what the documentation
states. This has been fixed.
- reshape / reshape_ind -
The first argument was unnecessarily being restricted to "numeric".
It now works with strings.
- rgrid2rcm_Wrap - Fixed two
bugs: (a) the argument sequence was incorrect, and (b) a named
dimension was corrected.
- str_split_by_length - Fixed bug with
where a string terminator wasn't properly added, if the
string didn't split into nice even chunks.
Graphical bugs fixed
- Fixed a contouring bug for unstructured data that sometimes caused
the message "fatal:ContourPlotDraw: CTTMTL/ICAEDG - LOGIC ERROR" to
appear.
- Fixed a bug where the lgItemOrder resource didn't
work correctly with gsn_legend_ndc.
- Fixed a bug where
the cnLowLabelBackgroundColor
resource was affected by the setting of
the cnHighLabelBackgroundColor
resource.
Known issues with version 6.1.1
- There's a bug in this version of NCL that can cause contour
plotting scripts to fail with the message:
fatal:_NhlUseWorkspace: Allocation of workspace would exceed maximum total size
fatal:ContourPlotDraw: error reserving label area map workspace
fatal:ContourPlotDraw: Error reserving workspace
fatal:ContourPlotDraw: draw error
warning:WorkstationDeactivate: workstation not active or not opened
This occurs when you have a wsMaximizeSize setting in your .hluresfile, and the value is something "small" like 32556688. If you remove this setting, or bump it up to a larger number like 100000000, then contouring should work again.
This bug was fixed in V6.1.2. We recommend you download that version.
- There is a bug in Apple's new XQuartz windowing system that causes
NCL's cairo X11 window to not display properly on Mac systems running
MacOS 10.8 or later, or on Macs that have been upgraded to use XQuartz
2.7.x as the default X11 window system.
Note: as of November 10, 2013, this bug has been fixed by XQuartz. You need to download and install version 2.7.5 from http://xquartz.macosforge.org/. Be sure to kill any old XQuartz servers that are still running.
If you can't upgrade your XQuartz for some reason, then a work-around is to use "ncl.xq.fix". You must use this executable in place of "ncl":
ncl.xq.fix myscript.ncl
If this seems to fix the problem, then you can make this your default "ncl":mv $NCARG_ROOT/bin/ncl $NCARG_ROOT/bin/ncl.bkp mv $NCARG_ROOT/bin/ncl.xq.fix $NCARG_ROOT/bin/ncl
- If you have an NCL script that calls ImageMagick's "convert" utility
to convert from a PS/PDF file to another format, then you need to make
sure you delete the workstation before you call convert:
   delete(wks)
   system( "convert -trim file.ps file.gif")
This ensures that the "file.ps" file is properly closed before you convert it. In versions 6.0.0 and earlier, this wasn't required, but it was always recommended. It is now required for V6.1.x.
- PS files are quite a bit larger than they were in V6.0.0 and
earlier. PDF files are smaller.
Version 6.1.0
October 28, 2012
- New color display model
- Changes to graphical defaults
- Changes to compiling NCAR Graphics and HLU codes
- Trouble-shooting potential differences in graphics
- New regridding capabilities via ESMF software
- New functions
- New resources
- Reading new NetCDF4 features
- New color tables
- Updated functions
- Southern hemisphere font symbols added
- Changes and additions to GRIB1/GRIB2 reader
- Improvements and bug fixes to ncl_convert2nc and ncl_filedump
- Bugs fixed
- Known issues with version 6.1.0
New color display model
With the 6.1.0 release, cairo is the default software used for our graphical display model. This will allow for:
- The use of 32-bit colors (R,G,B,alpha)
- The ability to have transparent colors
- The use of named colors without first adding them to the existing color map
- The use of more than 256 colors per image
These features will only work with "ps", "pdf", "png", and "x11" output. The "ncgm" output format is still limited to 8-bit color.
Visit the new color capabilities examples page for details.
This upgrade might result in some plots having looking different. Please see the section on potential backwards-incompatibilites for more information.
If you think you've run across a real problem with this upgrade, please see our "Reporting NCL Bugs" page.
Changes to graphical defaults
With the introduction of the new color display model, we decided to change some long-standing graphical defaults NCL. While these changes may cause some backwards-incompatibility in the look of your graphics, we think these changes are for the better. See this side-by-side comparison:
[Click on images for a larger version.]
| NCL V6.0.0 | NCL V6.1.0 |
|---|---|
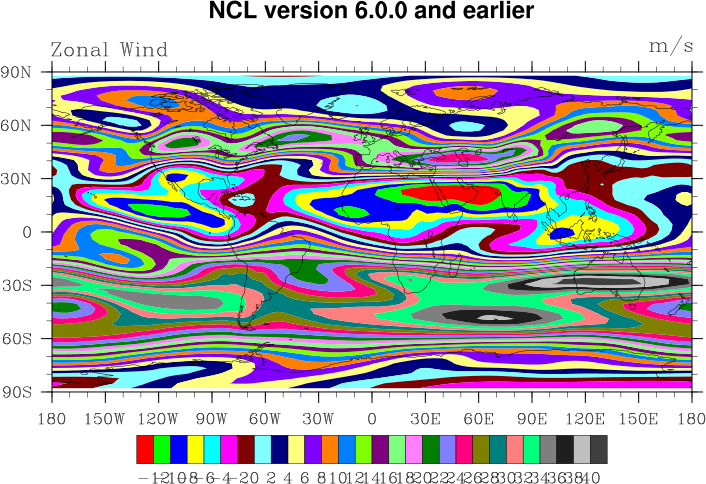
| 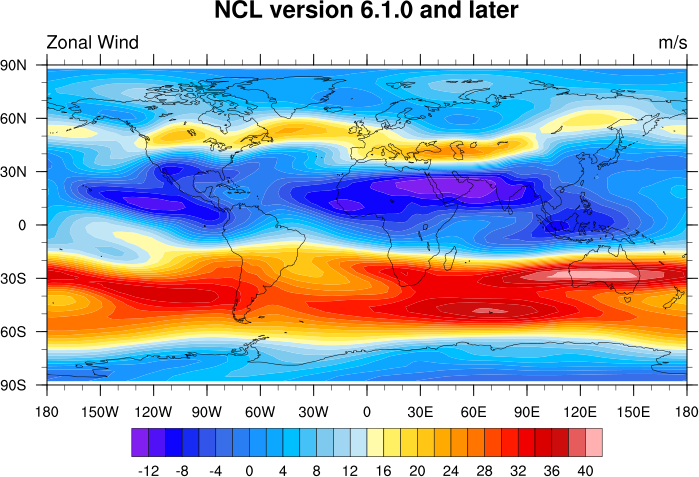
|
Here are the changes you need to be aware of:
- Default color table is a new one with 256 colors.
The default color table has been changed from the default one called "default" to a new color table called "ncl_default".
NCL V6.0.0 NCL V6.1.0 

- Default font is now helvetica.
The default font is now "helvetica" instead of "times-roman".
- Default function code is now "~".
The old default function code was a colon ":" which is a common character to use in titles.
- Color map will automatically be spanned for color contours,
vectors, and streamlines.
This is effectively the same as setting gsnSpreadColors to True. However, this resource has been superceded by new resources cnSpanFillPalette, vcSpanLevelPalette, and stSpanLevelPalette, which all default to True.
gsnSpreadColors will still work, but it will only have an effect if gsnSpreadColorStart and/or gsnSpreadColorEnd are set to something other than their default values of 2 and -1.
- Labelbar labels will automatically be strided if they
overlap.
Basically, lbLabelAutoStride now defaults to True.
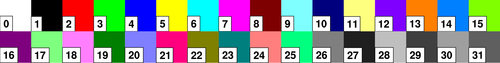
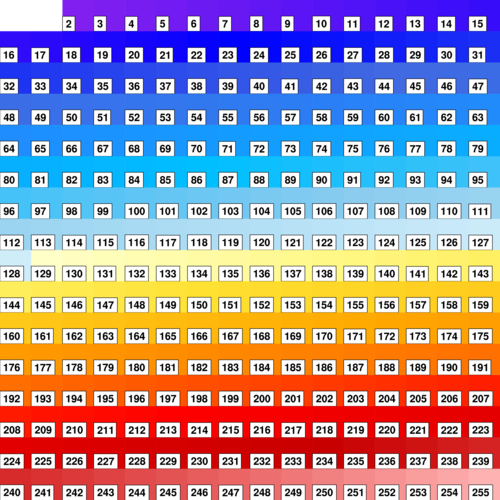
Changes to compiling NCAR Graphics and HLU codes
If you are compiling NCAR Graphics or HLU programs using this new version, you are now required to link several new libraries. This is due to the new cairo graphics that are now being used for graphical display.
If you use any of the ncargf77, ncargcc, nhlf77, or nhlcc scripts to compile your code, you will notice that they now link one or more of the additional libraries:
-lcairo -lfontconfig -lpixman-1 -lfreetype -lexpat -lbzYou will need to have these libraries installed on your system, and they may already be there. If not, you can easily install them on a Linux system using something like yum or apt-get, or YaST, and on a Mac system using MacPorts.
The package(s) to install are "libcairo-devel", "libpixman-devel", "libfontconfig-devel", etc. It is very likely that once you install "libcairo-devel", the other packages will get installed automatically, so check for this before you install all the packages.
Trouble-shooting potential differences in graphics
Here are some possible situations where you'll notice a different in your graphics:
- You are suddenly seeing gray-filled land in your map plots.
This is because the gsn_csm_xxx_map functions all fill the land in gray by default. In older (pre V6.1.0) versions of NCL, you had to have gray in your color map in order to see gray-filled land. This is no longer the case.
If you don't want any map land fill, set:
res@mpFillOn = False
- The colors in your plot (especially a filled contour or vector
plot) are different.
This could be due to one of two issues:
- If you are not
calling gsn_define_colormap to
change the color map, then the issue is likely that the new default
color map is being used. To fix this, you can load the original
default color map with:
gsn_define_colormap(wks,"default")
- If you are setting your own color map, and you are creating
a filled vector or contour plot, then the change may be due to the
fact that your full colormap is getting spanned. This is because of
the new
resources cnSpanFillPalette
and vcSpanLevelPalette, which
default to True. Try setting the appropriate resource to False:
  res@cnSpanFillPalette = False
  res@vcSpanLevelPalette = False
- If you are not
calling gsn_define_colormap to
change the color map, then the issue is likely that the new default
color map is being used. To fix this, you can load the original
default color map with:
- You are getting helvetica font instead of times-roman font
If you really want times-roman font, then create a file called ".hluresfile" in your home directory and add this line to it:
*Font : times-roman
You can see a sample file here. - The labelbar labels look different.
This is likely due to lbLabelAutoStride now defaulting to True. If you don't like the result, set this resource to False.
res@lbLabelAutoStride = False
- Skew-T plots have different colors.
This is actually due to a bug fix. The Skew-T code was using named colors like "PalgeGreen" and "Tan" to draw some features. In older versions of NCL, if you didn't have these colors in your color map, then the closest match was used. In 6.1.0 and later, named colors will now get used, regardless if they are in your color map.
New regridding capabilities via ESMF software
We have incorporated the Earth System Modeling Framework (ESMF) regridding software into NCL. This software allows you to regrid rectilinear, curvilinear, and unstructured data, using three different interpolation methods.
Visit the ESMF regridding examples page for details.
New functions
- cd_convert - Converts a
time variable from one set of units to another.
This function is identical to
ut_convert, except it
uses cd_calendar
and cd_inv_calendar internally. (Original routine
contributed by Carl Schreck.)
- cd_string - Converts time
values into nicely formatted strings. This function is identical to
ut_string, except it
uses cd_calendar internally. (Original routine
contributed by Carl Schreck and Arindam Chakraborty.)
- depth_to_pres - Convert ocean depth to pressure.
- dim_min_n_Wrap /
dim_max_n_Wrap - Computes the
minimum/maximum of a variable's given dimensions at all other
dimensions and retains metadata. The dim_min_n
/ dim_max_n functions have existed since version
5.1.1.
- dim_gamfit_n - Fits data to the two parameter
gamma distribution.
- dim_numrun_n - Counts the number of "runs"
(sequences) within a series containing zeros and ones.
- dim_spi_n - Calculate the standardized
precipitation index (SPI).
- dpres_plevel_Wrap
- Calculates the pressure layer thicknesses of a constant pressure
level coordinate system, and retains metadata. This is identical
to dpres_plevel, except for the metadata retention.
- dtrend_quadratic_msg_n - Estimates and removes
the least squares quadratic trend of the given dimension from all grid
points. Missing values are allowed. Note: in V6.1.0
there was a bug in which remove_mean was behaving the
opposite of its intended behavior. This will be fixed in
V6.1.1.
- ESMF functions:
- curvilinear_to_SCRIP - Writes the description of a curvilinear grid to a SCRIP file.
- latlon_to_SCRIP - Writes the description of a lat/lon grid to a SCRIP file.
- rectilinear_to_SCRIP - Writes the description of a rectilinear grid to a SCRIP file.
- unstructured_to_ESMF - Writes the description of an unstructured grid to an ESMF file.
- ESMF_regrid - Regrids data from one grid to another, using ESMF software.
- ESMF_regrid_gen_weights - Writes a weight file using the offline ESMF weight generator.
- ESMF_regrid_with_weights - Using the provided weight file, regrids data from one grid to another.
- gamma - Evaluates the complete gamma function.
- get_cpu_time - Returns the CPU time used by NCL.
- Functions to use with "groups": filegrpdef,
getfilegrpnames
- gsn_add_shapefile_polygons -
Attaches shapefile polygon data to the given plot using randomly
filled polygons.
- gsn_add_shapefile_polylines -
Attaches shapefile polyline or polygon data to the given plot using polylines.
- gsn_add_shapefile_polymarkers -
Attaches shapefile point data to the given plot using markers.
- gsn_coordinates
- draws or attaches the data coordinate locations on the given plot as
grid lines or markers.
- Functions to use with "List" type: ListCount,
ListIndex, ListPop,
ListPush, NewList
- mixed_layer_depth - calculates a quantity
derived from the Potential Density of significance.
- potmp_insitu_ocn - Calculate seawater potential
temperature at an arbitrary reference pressure given insitu
temperature, salinity and depth.
- print_table / write_table -
Writes all elements in a List to a file or stdout.
- read_colormap_file - Reads an
NCL system colormap file or a user-defined colormap.
- reshape - Reshapes a multi-dimensional array to
another multi-dimensional array.
- reshape_ind - Places values from a smaller
one-dimensional array to a larger one-dimensional array, and reshapes
it.
- rm_single_dims - Removes
singleton (degenerate) dimensions from an array while preserving meta
data.
- sparse_matrix_mult - Multiples a sparse matrix
with a dense matrix.
- spcorr_n - Computes Spearman rank order
correlation coefficient across the given dimension.
- str_split_csv - Splits strings into an array of
strings using the given delimiter (usually a comma ',').
- wgt_area_smooth - performs a 5-point 2D
area-weighted smoother.
- wind_component - Calculate zonal
and meridional wind components from wind speed and wind direction.
- wind_direction - Calculate
meteorological wind direction from zonal and meridional wind components.
- wrf_map_resources - sets
map plotting resources based on an input WRF-ARW file.
New resources
This set of resources were added allowing you to have transparency in some graphical components:
- cnFillOpacityF - sets the opacity of all colors in a contour plot
- gsFillOpacityF - sets opacity for color-filled polygons
- gsLineOpacityF - sets opacity for boundaries of polygons, polylines, etc.
- gsMarkerOpacityF - sets opacity for marker-based graphics
- stLineOpacityF - sets the opacity of all streamlines in a streamline plot
- txFontOpacityF - sets opacity for textual graphics
- vcGlyphOpacityF - sets the opacity of all vector glyphs in a vector plot
This set of resources allows you to specify color palettes and
behavior for each plot type.
They are are meant to replace the behavior
of gsnSpreadColors:
- cnFillPalette / cnSpanFillPalette
- vcLevelPalette / vcSpanLevelPalette
- stLevelPalette / stSpanLevelPalette
New resources added in 6.1.0:
- mpCountyLineColor, mpCountyLineDashPattern, mpCountyLineDashSegLenF, mpCountyLineThicknessF - new resources that allow you to control the look of U.S. county lines.
Reading new NetCDF4 features
- NCL uses a different file structure to represent NetCDF4 files at
the low-level. When NCL detects a NetCDF4 file, this new file
structure is activited automatically.
- Starting from 6.1.0, NCL can handle NetCDF4 groups and other data
types, such as string, vlen, enum, opaque, and compound.
- Example of manipulating a NetCDF4 group:
nc4_group.ncl
- Example of reading NetCDF4 strings:
nc4_read_string.ncl
- Example of reading NetCDF4 enum:
nc4_read_enum.ncl
- Example of reading NetCDF4 opaque:
nc4_read_opaque.ncl
- Example of reading NetCDF4 vlen:
nc4_read_vlen.ncl
- Example of reading NetCDF4 compound:
nc4_read_compound.ncl
New color tables
Matthew Long of NCAR/ASP contributed three new "cmp" color tables, and several other tables have been added by the NCL team.
You can download these tables now and use them. Click on the "download now" link of the desired table, and then go to the "Move file to appropriate directory" section of the "create your own color table" page for information on adding this new table to your current version of NCL.
| amwg256 (download now) | cmp_b2r (download now) | cmp_flux (download now) | cmp_haxby nice for topography (download now) |

| 
| 
| 
|
| GHRSST_anomaly nice for topography (download now) | ncl_default (new default for NCL) (download now) | seaice_1 (download now) | seaice_2 (download now) |

| 
| 
| 
|
| matlab_hot (download now) | matlab_hsv (download now) | matlab_jet (download now) | matlab_lines (download now) |
| 
| 
| 
|
Updated functions
- cd_calendar - option=4 will now work with the
various calendars that this function recgonizes.
- day_of_year, days_in_month,
isleapyear, monthday
- these functions have been upgraded to recognize various calendars,
and missing values.
- All gsn_xxxx_streamline
routines - some of these functions weren't creating a labelbar
if stMonoLineColor was set to
False. gsnSpreadColors is now recognized,
although it's somewhat moot because of the new
stSpanLevelPalette resource.
- cd_calendar / cd_inv_calendar -
added recognition of the "none" calendar.
- day_of_week, day_of_year, days_in_month,
isleapyear, monthday, jul2greg, greg2jul - these were updated to recognize missing values.
- fspan - updated to do calculations in double
precision, giving it better precision.
- regCoef - now returns the y-intercepts.
- short2flt - now works with
ushort.
- time_axis_labels - Updated
to internally use cd_calendar instead
of ut_calendar.
- wgt_area_smooth
- A second "opt" argument was added to this function to make it more
general. We generally will not modify a function's argument list after
the function has been released, but since this was only released as
part of a beta version, we made an exception here.
- wrf_cape_2d / wrf_cape_3d /
rip_cape_2d
/ rip_cape_3d
these functions used to return -0.1 for "out-of-range" values, but no
missing value ("_FillValue" attribute) was set. In V6.1.0, this value
was replaced with a missing value, and a "_FillValue" attribute is
also set. The value of the
missing value depends on the type of the return array (float or
double).
- wrf_user_getvar - added
"sreh", which calculates helicity.
Southern hemisphere font symbols added
We added southern hemisphere versions of our tropical storm and hurricane symbols. Thanks to Joan Fernon for bringing this to our attention.
See letter "k" in font tables 35 and 135, and letter "s" in font tables 37 and 137.
You can use these new fonts now with any version of NCL. You may need to get a system adminstrator to execute some of these steps:
- Save the files font35.fc and
font37.fc.
- Generate binary versions of these files with:
  fontc font35.fc font35
  fontc font37.fc font37
Font tables 135 and 137 don't need to be generated. They get their information from these two files. - Make copies of your old font35 and font37 files, just in case:
cp $NCARG_ROOT/lib/ncarg/fontcaps/font35 $NCARG_ROOT/lib/ncarg/fontcaps/font35.bkup
cp $NCARG_ROOT/lib/ncarg/fontcaps/font37 $NCARG_ROOT/lib/ncarg/fontcaps/font37.bkup
- Move the files font35 and font37 to $NCARG_ROOT/lib/ncarg/fontcaps:
mv font35 font37 $NCARG_ROOT/lib/ncarg/fontcaps/font35 $NCARG_ROOT/lib/ncarg/fontcaps/.
- To test, run this FontTables.ncl script. This will create four X11 windows that you need to click on to advance to the next one. You should see the new S.H. symbol in all of these.
Changes to GRIB1/GRIB2 reader
- Added support for complex packing in GRIB1. (It's already
available for GRIB2 files.)
- GRIB1 changes
Time range indicator 10, which indicates that time parameter P1 occupies 2 bytes, is now treated the same as time range indicator 0 for the purposes of generating the forecast time dimension. This means that GRIB1 variable names that used to have '_10' appended no longer will. And, in a very small number of cases, two forecast time dimensions may be concatenated into a single dimension that is the union of the two.
- New GRIB2 tables added
Details to be added soon.
Improvements and bug fixes to ncl_convert2nc and ncl_filedump
- ncl_convert2nc:
- wasn't working if the file was not in the current directory
- wasn't working if the file didn't have a file extension (i.e. ".grb")
- fixed bug with converting single string variables to netcdf character variables
- wasn't always creating unique names for the temporary NCL script it creates
- will now determine the name for an unlimited time-related dimension when given the option -u without a name parameter
- ncl_filedump
- now works with OPeNDAP files
Bugs fixed
File input/output bugs
- GRIB
- Fixed problem reading GRIB2 files larger than 2 GB.
- Fixed confusion over whether to start from "La1" or "La2" in a GRIB1 or GRIB2 file.
- Fixed a bug when you tried to open a GRIB file that didn't have a ".grb" extension.
- Fixed a GRIB2 bug where if a statistically processed variable had too many time periods (necessitating division into multiple variables) it was resulting in an overrun of a while loop and a core dump.
- NetCDF4
- Removed the limit of being able to write only 2048 variables to a NetCDF file.
- Fixed a bug with reading NetCDF4 aggregate coordinate information.
- Fixed a bug with using getvardims with a NetCDF 4 file.
- Fixed a bug with writing string attributes to a NetCDF 4 file.
- Fixed a bug in trying to read hundreds of NetCDF4 files.
- HDF5
- Fixed a bug with trying to convert an HDF file with no scientific datasets.
- Fixed a bug in setfileoption in which it wouldn't work for HDF5 files if the first argument was a format string (like "h5"), rather than a file type variable.
- HDF-EOS
- Fixed bug with writing NULL-valued attributes to an HDF-EOS2 file. They will now be assigned a missing value.
- Fixed bug in reading ZA data in an HDF-EOS5 file.
- Fixed a bug with strings not being read correctly in an HDF-EOS5 file.
- Miscellaneous
- Fixed a memory problem when deleting a global attribute from a file.
- Fixed a problem with reading files in "cat" mode where one of the variables doesn't have "true" coordinate arrays.
- Fixed a problem with accessing a variable when specifying a single file in a join type aggregation.
- Fix for problems reading files with single dimensions that exceed 2^31.
- asciiread - this function will now read the last line of a file that doesn't have an "end-of-line" character after it.
- Fixed a bug with attaching attribute information to coordinate variables.
Graphical bugs
- Fixed a problem in the contouring code that was causing some areas to be left blank if drawing a raster plot using a triangular mesh.
- Fixed a contour bug that caused a plot to be blank on one size of grid boundary.
- Fixed an X11 window bug that caused a segmentation fault if you didn't have authorization to display X applications.
- gsn_csm_pres_hgt_streamline - fixed a bug in which the pressure values were not converted correctly for the u/v values, causing the streamlines not to show up.
- maximize_output - fixed a bug where it didn't resize properly for "ps" and "pdf" output.
- Fixed a bug in which colors in the labelbar and contour plot were sometimes not matching up. This involved changing the default value of cnFixFillBleed to True.
- skewT_BackGround - this function wasn't displaying the proper colors for the skew-T background if you didn't already have them in your color map, because it was using named colors. Now that named colors don't have to be explicitly added to a color map, you will get the correct ones requested by the skew-T code ("PaleGreen" background, "tan" lines, etc).
- Fixed a problem with drawing dense curly vectors, that would sometimes cause a little "x" to appear at the end of a vector.
- Fixed a bug where the "degree" symbol in map tickmark labels would be hollow for subsequent frames.
- gsn_csm_contour_map (and other gsn_csm_xxx_map functions) - fixed a bug where the longitude labels were not correct if mpCenterLonF wasn't set, and the longitude values were > 180.
- Fixed a bug where the X11 window wouldn't display properly on MacOS 10.8 systems running the new XQuartz server.
- idt - fixed a failure under MacOS 10.7.
- NhlNewDashPattern and NhlNewMarker - we believe we've fixed the infamous bug in which these two functions would fail sporadically on Linux systems.
Analysis function bugs
- cd_calendar - was returning strange values if a bad "unit" was given. It now returns all missing values.
- dim_num_n - fixed a bug in the prototyping of this function.
- dpres_hybrid_ccm - fixed a memory issue that sometimes caused a segmentation fault.
- min and max - now returns the missing value of the input if input is all missing, rather than the missing value of the type of the input.
- reg_multlin - fixed a memory leak.
- str_match - didn't allow you to input an empty string as a delimiter.
- triple2grid - sometimes had a problem if "opt" was set to False.
- WRFUserARW.ncl - fixed a bug in calculating the cone factor.
- gc_tarea / gc_qarea - these functions will now return a missing value if invalid lat/lon coordinates are given.
- str_capital - wasn't correctly capitalizing strings in all cases. Also fixed a bug where it was modifying its input string.
ESMF regridding bugs
- Fixed a bug where if the "conserve" method was being used, the grid corners were not checked for out-of-range values. It is still highly recommended to input your own grid corners, rather than letting NCL guess at them.
- Fixed bug with the "CopyVarCoords" attribute. Not all coordinate variables were being copied over.
"List" bugs
- NewList - wasn't letting you create a "cat" list directly.
- Fixed a bug making a copy of a List variable.
- Fixed a bug where you couldn't delete attributes in a List.
Miscellaneous bugs
- systemfunc - now returns a string missing value if there is no valid return information.
- Fixed bug with assigning logicals when a variable appeared on both sides of the "=" sign.
Known issues with version 6.1.0
Some of these issues have been fixed in V6.1.1.
- There are some problems users have found when writing NetCDF4 files.
- Writing a (undefined) variable directly to file
- Writing a scalar to a file
- Printing a variable's attribute when it is double
- Adding global attributes to an existing file
- If two files are opened, where the first one is NetCDF3, and
second one is NetCDF4, then there is problem to operate on the first
file.
One way to work around this problem is to run ncl with "-f" option, e.g. run "ncl -f your-script".
- There's a bug in the $NCARG/ni/src/ncl/yMakefile file that will
only cause a problem if you try to build NCL with GDAL support turned
off. To fix this, download
this yMakefile.ncl.fix
file, rename it to "yMakefile", and put it in the $NCARG/ni/src/ncl
directory before you start the build.
This will be fixed in V6.1.1.
- There is a bug in Apple's new XQuartz windowing system that causes
NCL's cairo X11 window to not work properly on Mac systems running
MacOS 10.8 or later, or on Macs that have been upgraded to use Xquartz
2.7.x as the default X11 window system.
If you believe you've run into this bug with our precompiled binary, then you can try "ncl.xq.fix" to see if this fixes the issue. Just use this executable in place of "ncl":
ncl.xq.fix myscript.ncl
If this seems to fix the problem, then you can make this your default "ncl":mv $NCARG_ROOT/bin/ncl $NCARG_ROOT/bin/ncl.bug mv $NCARG_ROOT/bin/ncl.xq.fix $NCARG_ROOT/bin/ncl
- If you have an NCL script that calls ImageMagick's "convert" utility
to convert from a PS/PDF file to another format, then you need to make
sure you delete the workstation before you call convert:
   delete(wks)
   system( "convert -trim file.ps file.gif")
This ensures that the "file.ps" file is properly closed before you convert it. In versions 6.0.0 and earlier, this wasn't required, but it was always recommended. It is now required for V6.1.0.
- PS files are quite a bit larger than they were in V6.0.0 and
earlier. PDF files are smaller.
- dtrend_quadratic_msg_n - the "remove_mean"
input parameter is behaving the opposite of what the
documentation states. This will be fixed in V6.1.1.
- The lgItemOrder resource doesn't
work correctly with gsn_legend_ndc.
- There is a bug in HDF-EOS5, which cause NCL segmentation fault.
The problem is that HDF-EOS5 can not read attribute if it has more than
one element, such as this file: OMI-Aura_L3-OMLER_2005m01-2009m12_v003-2010m0503t063707.he5.
The work around is try to read it as HDF5 file.
Version 6.1.0-beta
May 28, 2012
This was a test release for the official 6.1.0 release.
Version 6.0.0
30 May 2011
- Variables greater than or equal to 2 gigabytes (GB) in size are now allowed
- Important note about *.so files generated by WRAPIT
- Change to default missing values
- Possible "gotchas" in default missing value change
- Change to byte and character types, new unsigned byte type added
- New functions
- Updated functions
- Deleting multiple variables
- Keywords added
- New color tables
- New graphical resources
- Change to naming of PNG files
- Bugs fixed
Variables greater than or equal to 2 gigabytes (GB) in size are allowed
Prior to version 6.x, NCL variables could not be greater than or equal to 2 GB in size. This restriction has been removed on 64-bit systems (the restriction remains for 32-bit systems).
Also with this upgrade, dimension sizes will be of type "long" on 64-bit systems if any dimension size is >= 2 GB.
Important note about *.so files generated by WRAPIT
In this release, you will need to regenerate any *.so files generated by older versions of WRAPIT, as these old files will not be compatible with the new NCL software.
If you try to use the old files with the new NCL, you will get a fatal message that looks like this:
fatal:Number of elements of dimension (0) of argument (0) is (1) in
      function (stuff), expected (4582672464) elements
Change to default missing values
The default missing values for all numeric variable types has been changed. For full information on this, see the "data types" section in the NCL Reference Manual.
This is in line with the default missing values for NetCDF, and some of the old default values were too small to be safely out of the range of potential calculations.
Here's a table of the old and new missing values:
| Variable type | Old missing value | New missing value |
|---|---|---|
| byte* | 0xff | -127 |
| ubyte | -- | 255 |
| short | -99 | -32767 |
| ushort | 0 | 65535 |
| integer | -999 | -2147483647 |
| uint | 0 | 4294967295 |
| long | -9999 | -2147483647 |
| ulong | 0 | 4294967295 |
| int64 | -99999999 | -9223372036854775806 |
| uint64 | 0 | 18446744073709551614 |
| float | -999 | 9.96921e+36 |
| double | -9999 | 9.969209968386869e+36 |
| character* | 0 | 0x00 |
* The missing values for bytes and characters are rather different. This is because an NCL byte is now a signed byte (it was unsigned before), and an NCL character is now an unsigned byte (it was signed before). This change keeps us in line with the definition of a NetCDF byte and character.
Possible "gotchas" in default missing value change
The default missing value change could cause some backwards incompatibility in your NCL scripts. Here are some "gotchas" to look for and correct:
- Do not use hard-coded values to check if your data contains
any missing values.
For example, if you have a float variable "x" that was assigned a default missing value of -999 via some other calculation, *and* you have code like this:
    if(x(i).eq.-999)) then
      ...do something...
then your code may no longer work in V6.0.0. You should instead use functions like ismissing to check for missing values:
if(ismissing(x(i))) then ...do something... - Be careful with checking for missing data by assuming it is
less than zero.
If you have data that is supposed to always be positive, and you check for missing values by assuming the default value is less than zero, then this may no longer work in V6.0.0. For example, the default missing values for floats and doubles were negative in V5.x, and are now positive in V6.x.
- Be careful with sorting data that may contain default
missing values.
Functions like qsort and dim_pqsort sort missing values like regular values. In V6.x, the default float and double missing values are now positive, so they will be sorted differently than in V5.x where they were negative.
- Set the "_FillValue" attribute if you are reading ASCII data.
If you are reading data from an ASCII file that potentially contains missing values, and if these missing values are equal to the *old* default values, then you may need to set the _FillValue attribute explicitly after reading the data in.
Functions like asciiread and readAsciiTable automatically assign a _FillValue attribute based on the type of the variable you're reading in. If you are assuming that the default missing value is -999 for floats, say, then your code will not work properly.
For example, if you have an ASCII file with float values, and you have "-999" in the file to represent missing values, then you will need to explicitly set the _FillValue attribute to -999 after you read it in, because now the default missing value for a float will be "9.96921e+36":
   data = asciiread("file.txt",-1,"float")
   data@_FillValue = -999
We have provided two ways to get at the old default missing values if you are not ready to change your code. The first way is via a procedure call:
set_default_fillvalue("all","ncl_v5")
The second way is via a command line option when you run NCL.
Change to byte and character types
In NCL versions 5.x and earlier, an NCL byte was unsigned, and an NCL character was signed. To make things more consistent, and to stay in line with bytes and characters in NetCDF, these two types have switched meaning: an NCL byte is now signed and an NCL character is unsigned.
We've introduced a new type---"ubyte" (unsigned byte)---if you need the functionality of the old-style NCL byte.
For more information about NCL data types, see the "data types" section in the NCL Reference Manual.
New functions
- cd_calendar (V6.0.0) - converts a mixed
Julian/Gregorian date to a UT-referenced date. This is a replacement
for ut_calendar
- cd_inv_calendar (V6.0.0) - converts a
UT-referenced date to a mixed Julian/Gregorian date. This is a
replacement for ut_inv_calendar
- gsn_csm_blank_plot (V6.0.0-beta)
- creates a "blank" plot with tickmarks pointing outward.
- isubyte (V6.0.0-beta) - returns True if the
input is an unsigned byte.
- isunsigned (V6.0.0-beta) - returns True if the
input is any of the unsigned types (ubyte, ushort, uint, ulong,
uint64).
- default_fillvalue (V6.0.0-beta) - returns the
default missing value for the given variable type.
- namedcolor2rgb (V6.0.0-beta) -
Returns the RGB triplets of the given list of named colors.
- remap_elements (V6.0.0) -
Remaps values on one grid to a rectilinear latitude-longitude grid.
- set_default_fillvalue (V6.0.0-beta) - allows you
to change the default missing value for a particular variable type, or
change all the default missing values to the same values that were
used in NCL version 5.x.
- show_ascii (V6.0.0) - prints the ASCII table to
the screen.
- span_named_colors (V6.0.0-beta) -
Creates an RGB array that is a span between given list of named
colors.
- str_match_ic (V6.0.0) - returns a
list of strings that contain the given substring (case
insensitive).
- str_match_ind (V6.0.0) - returns the indexes
into a list of strings that contain the given substring (case
sensitive).
- str_match_ind_ic (V6.0.0) - returns the indexes
into a list of strings that contain the given substring (case
insensitive).
- str_split_by_length (V6.0.0-beta) - splits
strings given a scalar length or array of lengths.
- toubyte (V6.0.0-beta) - converts input to an
unsigned byte.
Updated functions
- Numerous functions have been upgraded to allow dimension sizes and
index values to be integers or longs. On a 64-bit system, dimension
sizes of type long allows you to have variables >= 2 GB.
Here is a list of functions that have been upgraded to allow for long input and/or output. Not all updated functions are listed here; just the most widely-used ones:
- conform_dims (V6.0.0-beta) - the first argument
can be a long.
- dim_gbits, getbitsone
(V6.0.0-beta) - now accepts int8, uint8, and ushort input.
- dimsizes (V6.0.0-beta) - longs will be returned
if you're on a 64-bit machine and the product of your dimension sizes
is >= 2 GB.
- fspan (V6.0.0-beta) - the third argument can be
a long.
- ind, minind,
maxind (V6.0.0-beta) - these functions will return
longs if you're on a 64-bit system and any of the index values are >=
2 GB.
- ind_resolve (V6.0.0-beta) - longs will be
returned if any of the index values are >= 2 GB. Also, the input can
now be integer or long.
- ispan (V6.0.0-beta) - any of the input can be of
type int, long, or int64. Also, the return type can be int, long, or
int64, depending on the input types.
- new (V6.0.0-beta) - the input dimension sizes
can be longs.
- num (V6.0.0-beta) - a long will be returned if
you're on a 64-bit system and the count is >= 2 GB.
- onedtond (V6.0.0-beta) - the second
argument can be longs.
- sizeof (V6.0.0-beta) - the size returned will be
a long if you're on a 64-bit machine and the size is >= 2 GB.
- conform_dims (V6.0.0-beta) - the first argument
can be a long.
- rcm2points /
rcm2points_Wrap (V6.0.0) - the
simple search algorithm used by these functions is not capable of
handling all cases. The result is that, sometimes, there are
non-interpolated points in the initial interpolation pass. Beginning
with V6.0.0: any interior points not interpolated in the initial
interpolation pass will be filled by searching all points and using an
inverse distance squared algorithm.
- rcm2rgrid /
rcm2rgrid_Wrap (V6.0.0) - the
simple search algorithm used by these functions is not capable of
handling all cases. The result is that, sometimes, there are small
gaps in the interpolated grids. Beginning with V6.0.0: any interior
points not interpolated in the initial interpolation pass will be
filled using linear interpolation. In some cases, edge points may not
be filled.
- wrf_interp_3d_z,
wrf_user_intrp3d (V6.0.0-beta) -
the missing value was changed from -999999 to the new default missing
value for a float/double (9.96921e+36).
- wrf_user_list_times,
wrf_user_getvar,
wrf_user_ij_to_ll,
wrf_user_ll_to_ij (V6.0.0) - these
functions have been updated to allow the first argument to be either a
file opened with addfile, or a list of files opened
with addfiles.
Deleting multiple variables
In alpha test mode: you can now use delete to delete multiple variables of mixed types and sizes. Use the special syntax "[/" and "/]" around the variables you want to delete:
  lat  = fspan(-90,90,64)
  lon  = fspan(-180,180,128)
  data = random_uniform(-10,10,(/10,20,30/))
  varnames = (/"T","P","U","V"/)    ; 1D string array
  . . .
  delete([/data,varnames,lat,lon/])

  print(lon(0))    ; This will produce an error that "lon" is undefined
Keywords added
- enumeric
- group
- int64
- snumeric
- ubyte
- uint
- uint64
- ulong
- ushort
- Missing
New color tables
Emilie Vanvyve of NCAR/RAL contributed eight new color tables. You can download these tables now and use them. Click on the "download now" link of the desired table, and then go to the "Move file to appropriate directory" section of the "create your own color table" page for information on adding this new table to your current version of NCL.
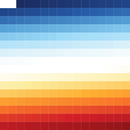
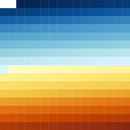

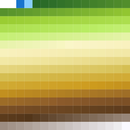


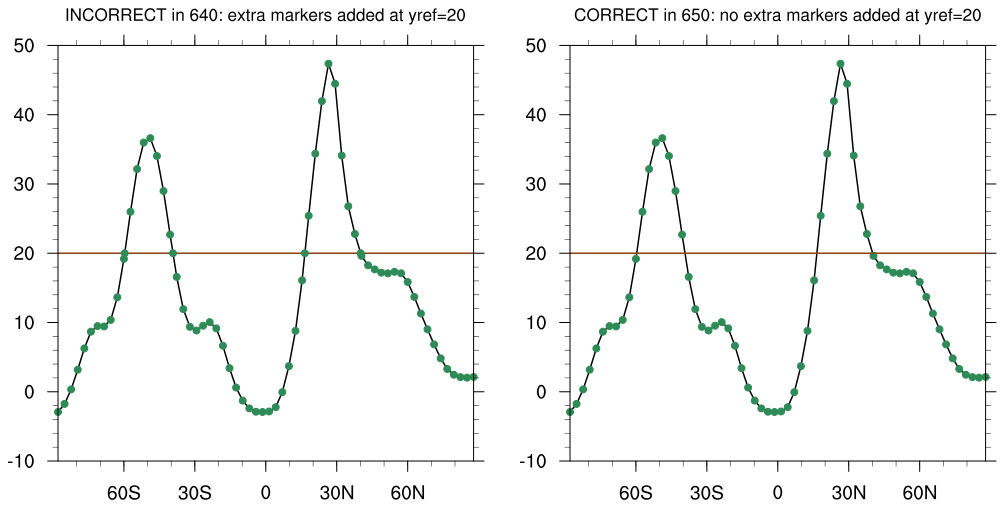
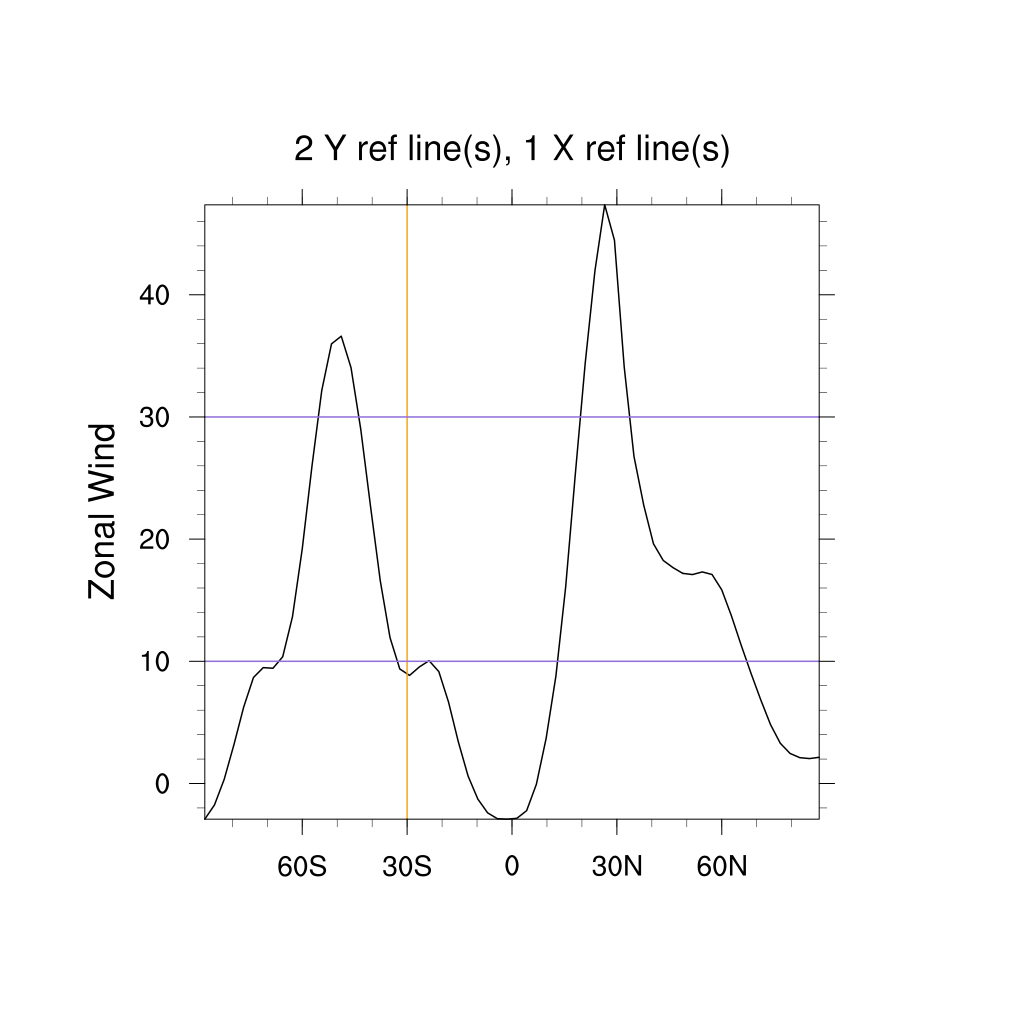
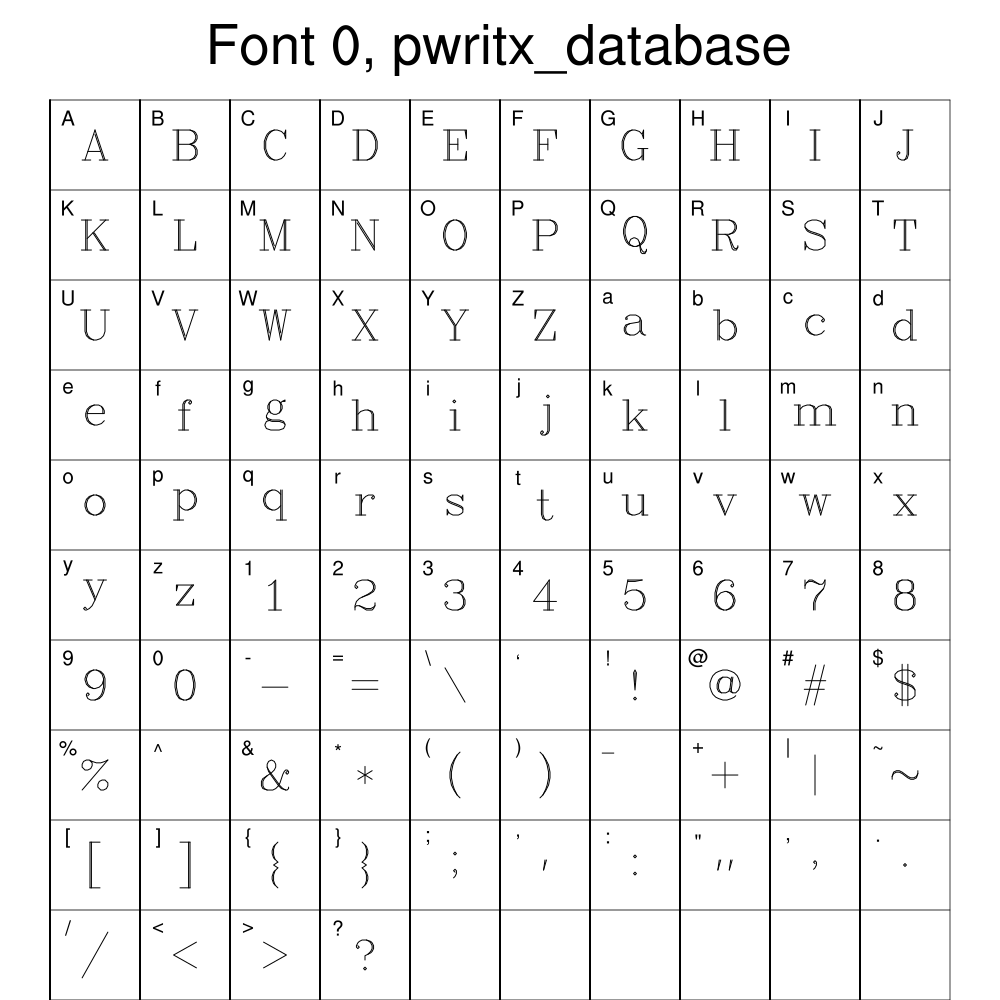
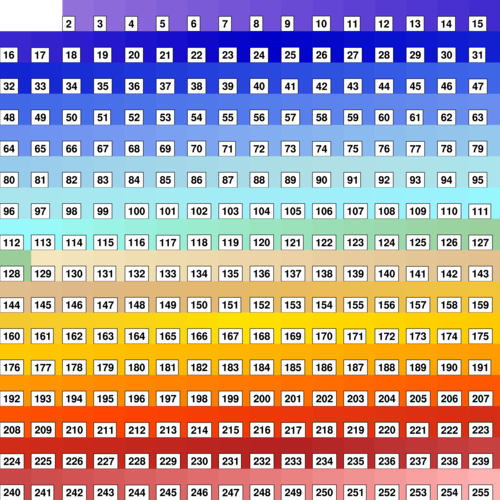
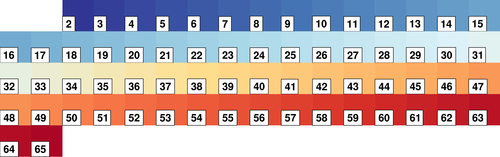
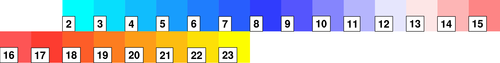
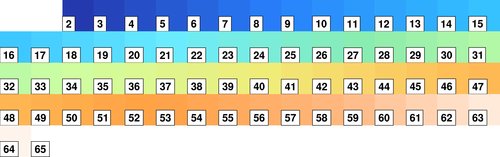
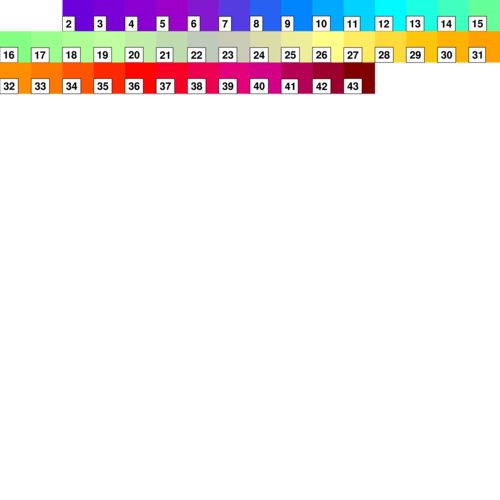
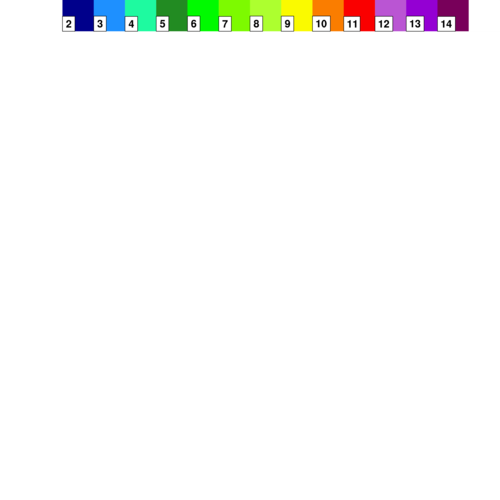
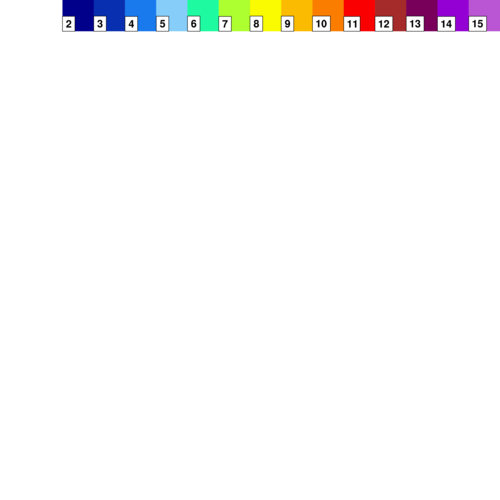
There are now 101 color tables available.
New graphical resources
- cnGridBoundFillColor
- This resource sets the color to use for filling areas outside the boundaries of the data grid, but within the viewport and the projectable areas of the underlying map, if any.
- cnGridBoundFillPattern
- This resource sets the fill pattern index used to fill areas outside the boundaries of the data grid, but within the viewport and the projectable areas of the underlying map, if any.
- cnGridBoundFillScaleF
- This resource controls the scaling of the pattern used for areas outside the boundaries of the data grid, but within the viewport and the projectable areas of the underlying map, if any.
- cnOutOfRangeFillColor
- This resource sets the color to use for filling areas within the viewport but outside the projectable area of the underlying map, if any.
- cnOutOfRangeFillPattern
- This resource sets the fill pattern index used to fill areas within the viewport but outside the projectable area of the underlying map, if any.
- cnOutOfRangeFillScaleF
- This resource controls the scaling of the pattern used for areas within the viewport but outside the projectable area of the underlying map, if any.
Also, the default values of
cnMissingValFillColor
and cnMissingValFillPattern have
changed: cnMissingValFillColor
formerly defaulted to Background
and cnMissingValFillPattern
defaulted to HollowFill. Now the defaults have
respectively changed to Transparent
and SolidFill. Since the effect is the same in either
case, this change is not anticipated to affect very many existing
scripts. The change was made to simplify the interactions between
these resources and the above newly added resources. One advantage of
this change is that, assuming contour fill is enabled, you can get
visible fill of the missing value areas by modifying only one resource
instead of two.
Change to naming of PNG files
The PNG file format does not support multiple images per file. In NCL 5.2.x and earlier, multiple plots written to a PNG workstation resulted correspondingly in multiple files, named with a 6-digit sequence number appended to the user-specified filename (file.000001.png, file.000002.png, etc). In cases where only one plot is generated, this behavior was unnecessary and deemed undesirable by a number of users.
With NCL 6.0.0, no sequence number is appended when only a single plot is generated (file.png). As before, when multiple plots are written, sequence numbers are appended to all filenames, including the first for consistency.
Bugs fixed
- (In version 6.0.0-beta only) If you use a "/" in conjunction with
reading a variable off a file:
  a   = addfile("atmos.nc","r")
  lev = a->lev/100
You will get an unexpected syntax error:
fatal:Either file (a) isn't defined or variable (lev/100) is not a
variable in the file
This is an error due to the implementation of reading "groups" in HDF5, which can be accessed with a "/". NCL thinks you are trying to access a group called "lev/100", rather than trying to divide the "lev" values by 100.
- In the process of testing NCL 6.0.0, we ran a number of memory
debugging codes (valgrind,
purify)
and fixed many memory leaks.
- Fixed a bug in which the NCL polygon code was not being handled
correctly on spherical surfaces, potentially causing the fill to
"bleed".
- Fixed a bug with the "record"/"stop" commands that caused them to
abort and produce a bunch of errors on a Linux system.
- Fixed a bug
with ncl_filedump not
working on 2D character arrays or improperly deleting a local variable
if a string variable was being processd.
- Fixed some GRIB bugs:
- GRIB user-defined parameter table wasn't read correctly when there was an entry for parameter 0.
- GRIB grid 242 didn't have the correct values for Dx and Dy.
- Fixed a bug with drawing triangular mesh contours to the full
viewport.
- Fixed a bus error caused by initializing an NCL variable with an
invalid value.
- Fixed a bug with logical values not being converted to strings
correctly if set to the default missing value.
- Fixed a bug in which if NCL_DEF_SCRIPTS_DIR environment variable
was set, NCL scripts were not loaded in a predictable order. Scripts
are now loaded in ascii case-sensitive order (numbers before letters,
upper case before lower case). Files that do not end with '.ncl' are
simply ignored.
- asciiread - fixed inconsistent behavior where
this function was setting a missing value if the dimensions were
explictly set, and not if the dimensions were specified with
"-1". Note that now that the default missing values have been changed,
you will see the new default missing values returned for this
function.
- genNormalDist - this
function was calculating PI incorrectly.
- getfiledimsizes - this function was
incorrectly returning longs if the individual dimension sizes
were less than 2 GB.
- gsn_csm_pres_hgt_vector - the vector
array needs to have pressure values in "mb", so added a check for this.
- obj_anal_ic - this routine had a bug if
the input arrays had different missing values.
- rcm2points_Wrap /
rcm2points_Wrap - details soon
- rcm2rgrid_Wrap - fixed a
serious bug in which the lat/lon input and output arrays were swapped.
rcm2rgrid did not have this bug.
- str_match - this function was
case insensitive and it should have been
case sensitive. Use the new str_match_ic
if you need case-insensitivity matching.
- str_split - this function was freeing non-allocated memory.
- ut_calendar
/ ut_inv_calendar - there are a number of bugs in
these functions, due to the underlying code in UDUNITS2 not being
supported anymore. Use the new functions
cd_calendar / cd_inv_calendar instead.
What's new/updated since 6.0.0-beta
New functions:
Updated functions:
- rcm2rgrid
- rcm2rgrid_Wrap
- rcm2points
- rcm2points_Wrap
- wrf_user_getvar
- wrf_user_ij_to_ll
- wrf_user_list_times
- wrf_user_ll_to_ij
New resources:
- cnGridBoundFillColor
- cnGridBoundFillPattern
- cnGridBoundFillScaleF
- cnOutOfRangeFillColor
- cnOutOfRangeFillPattern
- cnOutOfRangeFillScaleF
Improved functionality:
- The order in which scripts contained in the NCL_DEF_SCRIPTS_DIR directory are loaded is no longer undefined. Now, based on their names, the scripts are loaded in ascii case-sensitive order (numbers before letters, upper case before lower case). Files in the directory that do not have a ".ncl" suffix are now simply ignored, rather than causing a fatal error. A warning is generated if there are no valid scripts in the directory, and a script that fails to load properly causes a fatal error.
Version 6.0.0-beta
2 March 2011
This was a test release for the official 6.0.0 release
Version 5.2.1
26 July 2010
- New functions
- Updated functions
- Updates to GRIB1/GRIB2 reader
- New resources
- Infamous ARSCAM/ARPRAM bug fixed
- Other bugs fixed
- wrf_updraft_helicity - Calculates updraft
helicity from WRF model output.
- Added support for reading (NCEP) Climate Forecast System
Reanalysis (CFSR): 1979-2010 files. These GRIB2 files have a non-standard method for
specifying statistical-process variables.
- Updated ability to read WAFS upper-air forecasts in GRIB2 code form
A new attribute "type_of_spatial_processing" was added to statistical spatial variables that use GRIB2 template 4.15. Also added statistical variable type suffixes to the variable names (_avg, _max) in order to distinguish otherwise identical variable names.
- Fixed a problem reading Canadian Meteorology Centre's GEM data
in GRIB1 format.
Implemented a fix for GRIB1 files (intended to have global longitudinal extent) where lo1 and lo2 are equal (e.g. both are set to 180 -- rather than what has alwas been expected---lo1 = -180 and lo2 = 180).
- gsnXYBarChartOutlineThicknessF,
gsnXYBarChartFillLineThicknessF,
gsnXYBarChartFillScaleF,
gsnXYBarChartFillDotSizeFThese resources allow you further control over how bars are filled in when gsnXYBarChart is set to True.
- rcm2points
A new option was added (opt=2) that uses a bilinear interpolation scheme rather than the (default) inverse distance squared.
- wrf_uvmet
This function was updated to recognize missing values and deal with them accordingly.
Infamous ARSCAM/ARPRAM bug fixed
The infamous error:
    fatal:ContourPlotDraw: ARSCAM/ARPRAM - ALGORITHM FAILURE
    fatal:ContourPlotDraw: draw error
which caused some plots to not be drawn has been fixed.
- A bug was fixed that restricted the length of a graphical output
string to 254 characters.
- Fixed an "assignment mismatch" bug with trying to replace a
coordinate array with an array of a different type inside a procedure.
- gsn_csm_vector_scalar_map_polar
Fixed a bug in which if you tried to panel plots created by this function, no common labelbar would appear.
- month_to_annual
A bug was fixed in which this function would return an unexpected "dimension sizes" error.
- pdfx, pdfxy
At the suggestion of a user, the way the bin sizes were calculated was changed.
- readAsciiTable
Fixed a bug in which if the first value of "opt" is 0, the second value is ignored.
- ut_calendar / ut_inv_calendar
There was a problem with these functions if you had set the UDUNITS_PATH environment variable to an older UDUNITS-1 path. You would get an error that looks like this:
  warning:ut_calendar: Invalid specification string. Missing values will
  be returned.
This problem should be fixed now, and you shouldn't need to set UDUNITS2_XML_PATH (this was the work-around for V5.2.0).
- uv2dv_cfd, uv2vr_cfd
A bug was fixed in which the _FillValue was not being set if the input "u" didn't have a _FillValue. These now always returns a _FillValue attribute.
- wgt_vol_ave
A bug was fixed in which "NaN" (not a number) values were incorrectly returned if a subset of the data was all missing. It now returns missing values.
- wrf_slp / wrf_user_getvar
Fixed a memory leak when multiple "slp" were read off a file.
- Fixed a problem in V5.2.0 with reading an OMI Aura HDFEOS5 file.
Version 5.2.0
14 April 2010
- NCL hosted on new ESG website
- New graphical output formats (including PNG)
- HDF-EOS5 reader
- New variable types
- New functions
- New user-contributed functions
- New resources
- Updated functions
- Updates and changes to GRIB1/GRIB2 reader
- Lazy evaluation implemented for logical arrays
- New color tables
- OPeNDAP-enabled binaries now available for all systems
- Bugs fixed
The NCL 5.2.0 binaries are being released on a new ESG system, which was officially released for production on May 5, 2010. The URL is the same as before:
http://www.earthsystemgrid.org
We've added some new graphical output formats (workstation types). These are based upon an experimental graphics driver, and are considered beta-level capabilities:
- "png" or "newpng" for PNG output
- "newps" for PostScript
- "newpdf" for PDF
These formats can be used with gsn_open_wks:
   wks = gsn_open_wks("png","test")      ; Will create "test.000001.png"
   wks = gsn_open_wks("newpdf","test")   ; Will create "test.pdf"
   wks = gsn_open_wks("newps","test")    ; Will create "test.ps"
The "newpdf" workstation generally produces smaller output files than the original "pdf" type. Unfortunately, the "newps" output does not produce smaller PostScript files.
The "newps" and "newpdf" formats will remain in test mode for awhile, and may eventually replace the original "ps" and "pdf" formats. The original formats may be kept for backwards compatibility.
The old "png" format, which was never officially advertised, has been replaced by the new graphics driver; "png" is now synonymous with "newpng".
NCL can now read HDF-EOS5 files via the addfile or addfiles functions. You can also use the tools ncl_filedump and ncl_convert2nc to dump the contents of the file to the screen, or convert it to NetCDF.
- int64
- uint64
- ulong
- uint
- ushort
- New conversion routines - tobyte,
tochar, todouble,
tofloat, toint,
toint64, tointeger,
tolong, toshort,
tosigned, tostring,
touint, touint64,
toulong, tounsigned,
toushort
- New variable query functions - isenumeric,
isint64, issnumeric,
isuint, isuint64,
isulong, isushort
- area_conserve_remap, area_conserve_remap_Wrap - Performs areal
conservative remapping on rectilinear grids.
- merge_levels_sfc -
Merges a multiple level variable with the corresponding surface variable.
- moc_globe_atl - Facilitates calculating the
meridional overturning circulation for the globe and Atlantic.
- NhlGetClassResources - Returns a list of
resources associated with the given class name and an optional filter
string.
- obj_anal_ic / obj_anal_ic_Wrap - Iterative improvement
objective analysis.
- pie_chart - Draws a basic pie chart.
See sample.
- str_match - Returns a list of strings that match the
given expression in an array of strings.
- str_split - Splits a string into an array of
strings given a delimiter.
- time_to_newtime -
Change a "udunits" recognized time unit to a new (different) "udunits" recognized time unit.
- vinth2p_nodes - Interpolates CESM hybrid coordinates to pressure coordinates on an unstructured grid.
- vinth2p_ecmwf_nodes - Interpolates CESM hybrid coordinates to pressure coordinates on an unstructured grid using ECMWF extrapolation.
- wrf_helicity - Calculates storm relative
helicity from WRF model output.
- center_finite_diff_n,
dtrend_n,
dtrend_msg_n,
int2p_n,
int2p_n_Wrap,
linint1_n,
linint1_n_Wrap,
linmsg_n,
runave_n
runave_n_Wrap,
taper_n,
wgt_runave_n,
wgt_runave_n_Wrap
This suite of functions is an improvement to the existing versions of these functions which operate only on the rightmost dimension. These functions allow you to specifiy which dimension to operate on, so you don't have to reorder the input array(s) first.
New user-contributed functions
A number of users have been sending us some nice NCL scripts, so we've decided to create a new directory for these.
- calendar_decode2 -
Translates numeric time coordinates to calendar times (contributed by Dave Allured)
- kf_filter - Extracts
equatorial waves by filtering in the Wheeler-Kiladis
wavenumber-frequency domain.
- run_cor - Calculates
a running correlation (contributed by Sabeerli)
- time_axis_labels - Sets
resources necessary to draw nice tickmark labels using a format of
date/time on an axis (contributed by Arindam Chakraborty)
- ut_string - Converts time
values into nicely formatted strings (contributed by Carl
Schreck/Arindam Chakraborty)
- wkPaperSize, wkPaperHeightF, wkPaperHeightF - these resources
allow you to set the paper size for PostScript and PDF output when you
open a workstation. You can set the size using a standard name like
"A4", or by setting the width and height in inches.
- gsnXYRightFillColors, gsnXYLeftFillColors - these resources can be used to fill between X curves in an XY plot generated by gsn_csm_xy. See example 24 on the XY applications page.
-
clmDayTLL,
clmMonTLL,
clmMonTLLL,
stdMonTLL,
stdMonTLLL,
month_to_annual,
month_to_annual_weighted.
These were updated to use dim_avg_n and/or dim_stddev_n.
- gsn_add_polygon,
gsn_add_polyline,
gsn_add_polymarker
These functions have been updated to recognize the special tfPolyDrawOrder resource.
- gsn_open_wks
This function has been updated to recognize the new output types: "png", "newps", and "newpdf". For more information, see the "New graphical output formats" section.
- int2p_Wrap
The argument prototype xo[*]:numeric is no longer applicable. The function allows the xo to be multidimensional.
- PopLatLon, PopLatLonV
These functions have been updated to recognize the high resolution "tx0.1v2" mappings.
- relhum
The function has been updated to allow relative humidities > 100% (super saturation). Previously, these were set to 100%.
- ut_calendar and ut_inv_calendar
These functions are now linked against the UDUNITS-2 library. This means the code has a new dependency on some UDUNITS-2 XML files that come installed with this version of NCL.
Unfortunately we've discovered a bug in V5.2.0 where if you have the UDUNITS_PATH environment variable set, and it's pointing to an older UDUNITS-1 path, then these functions will fail with a message like:
  warning:ut_calendar: Invalid specification string. Missing values will
  be returned.
There are two possible work-arounds:
- Set the environment variable UDUNITS2_XML_PATH to point to
$NCARG_ROOT/lib/ncarg/udunits/udunits2.xml:
   setenv UDUNITS2_XML_PATH $NCARG_ROOT/lib/ncarg/udunits/udunits2.xml

or

   export UDUNITS2_XML_PATH=$NCARG_ROOT/lib/ncarg/udunits/udunits2.xml
- Unset the UDUNITS_PATH environment variable before you run NCL.
- Set the environment variable UDUNITS2_XML_PATH to point to
$NCARG_ROOT/lib/ncarg/udunits/udunits2.xml:
- WindRoseBasic,
WindRoseColor,
WindRoseThickLine.
These were updated to allow the wspd and wdir to be multi-dimensional.
Updates and changes to GRIB1/GRIB2 reader
GRIB2 code table updates
BACKWARDS INCOMPATIBILITY ALERT
The GRIB2 code tables have been extensively revised to bring them up-to-date with the currently documented state of the parameter tables primarily as defined by NCEP in links from the parameter category page at http://www.nco.ncep.noaa.gov/pmb/docs/grib2/grib2_table4-1.shtml. ECMWF tables, as documented at http://www.ecmwf.int/publications/manuals/d/gribapi/fm92/grib2/show/parameter/, were also consulted with the goal of harmonizing the parameter lists and descriptions as much as possible. The number of defined parameter has almost doubled, increasing from 371 to 701. This should eliminate most of the warnings about unrecognized parameters. Unfortunately, this process has led to some unavoidable backwards incompatibilities, primarily due to changes in the short names that form the base name for NCL variables that represent the aggregated GRIB records.
When GRIB2 was first introduced the NCEP documentation did not include abbreviations (short names) for many parameters. Since NCL's variable naming scheme requires a short name, NCL developers invented them where needed. Now, however, NCEP has created their own abbreviations for every parameter. Naturally enough, these names do not all coincide with the short names chosen by the NCL developers. To prevent confusion and to promote future interoperability, the NCL development team has decided that the importance of using essentially the same parameter names as NCEP outweighs the immediate cost of a certain amount of backwards incompatibility. As a gauge of the scope of the problem, 92 short names (approximately 25% of the parameter total prior to this release) have had short name changes. However, this statistic may exaggerate the scope of the problem, because many or most of these changes apply to new and therefore probably relatively obscure parameters.
In order to mitigate this problem for users who may not immediately
be able to update their codes to reflect the new variable names, the
previous version of the code tables is being included with the
distribution in a parallel directory tree. Users can switch from the
default set of code tables located
at $NCARG_ROOT/lib/ncarg/grib2_codetables by setting the
environment variable NIO_GRIB2_CODETABLES to point to
$NCARG_ROOT/lib/ncarg/grib2_codetables.previous. For
reference a list of the short name changes and additions is
available here.
There have also been some changes to the parameter description string that serves as the value of the long_name attribute. Basically the capitalization as been regularized by making all words except the initial word lower case. The only exception to this rule is for acronyms that are traditionally all upper-case.
Note that the GRIB2 codetables are text files that can easily be
edited. Therefore users who do not like any aspect of the presentation
of the parameters can create their own copy of the directory tree and
modify it to suit their needs. By pointing
Partial support for complex packing in GRIB1 files
Support was added for row by row complex packing without secondary bit maps in GRIB1 files.
Support for GRIB2 spatial statistical data
Added support for product template 4.15 which defines statistical processes over
a spatial region.
Partial support for GRIB2 grid type 204 (curvilinear orthogonal grids)
This grid type is supported without coordinate data. Notably, however, the example file
contains its own coordinate data as variables in their own right.
Lazy evaluation implemented for logical arrays
BACKWARDS INCOMPATIBILITY ALERT
The and ( See logical expressions and
lazy evaluation in NCL for more information.
These color tables were graciously contributed by MeteoSwiss.
For a list of all the available color tables, see the
color table gallery.
OPeNDAP-enabled binaries now available for all systems
NetCDF Version 4.1.x now comes with OPeNDAP support built into it,
which makes building an OPeNDAP-enabled version of NCL much easier. As
a result, we provide OPeNDAP-enabled binaries for all systems we
support.
There may be some dependencies on shared libraries like "libcurl",
"libcrypto.so", "libidn.so", and "libssl.so". These may already be on
your system.
If you run into a problem with shared libraries when running "ncl",
then either download a non-OPeNDAP enabled binary, or see these Linux or Cygwin notes.
Big endian machines include IBM/AIX/Power, Mac PowerPC, and
Sun/Solaris systems.
To write a NetCDF-4 classic file, you must have put the following line
in your NCL script, before any addfile(s) call:
Otherwise, by default, you will be writing a NetCDF 3 file, and you
shouldn't have any problems.
This function was not copying variable attributes as advertised.
Here an NCL script that illustrates
the problem.
Added a statment that fixes a possible numerical rounding issue.
Dr. Arne Melson [Norwegian Meteorological Institute,
R & D - Oceanography ] noted that the results were applicable
for computing surface potential density only, i.e., where depth=0.
A modification has since been applied [version 5.2.0] to accurately
compute all density surfaces (depth >= 0).
Corrected an interface error.
Fixed an issue that occured when the attribute [resource] ThermoInfo was set to False.
Support for shapefiles and other geospatial data formats
addfile, ncl_filedump and ncl_convert2nc will
support the reading of several geospatial vector-data formats, such as shapefiles (.shp),
MapInfo interchange files (.mif),
Generic Mapping Tools ascii files (.gmt),
and pre-2006 edition
TIGER/Line files (.rt1).
This will be a test version, so use at your own risk. See the shapefiles applications page
for some examples.
Change to the procedure for updating GRIB 1 parameter tables
NCL uses abbreviated short names usually found in GRIB 1 parameter tables to form the
initial component of NCL file variable names. However, centers such as ECMWF
sometimes provide tables that have are have no short names
for some or all the parameters in the table. Formerly, the NCL
developers made up suitable short names, but this practice has been discontinued.
Now, as NCL adds a file, when no abbreviation is found for a parameter the
variable will be assigned the name "VAR_"
New and updated ECMWF GRIB 1 parameter tables
The following new ECMWF parameter tables were added:
Adding a subscript makes it work correctly:
A bug was discovered that affects the top two interpolated levels only.
The underlying vinth2p, vinth2p_ecmwf,
vintp2p_ecmwf codes were taken directly
from the original CCM Processor
(http://www.cgd.ucar.edu/cms/processor/subject/vertical.interp.html).
These subroutines have been used possibly since the late 1980s.
Recently, Mark Branson (Colorado State University), was examining
interpolated values at the uppermost interpolated levels. He
discovered a bug.
An example will be used to illustrate the bug:
Consider temperatures [TM (K)] at the following model hybrid levels
[PM (hPa)]:
"shea_util.ncl" has new dependency
If you are loading the "shea_util.ncl" script, then you will need to
load "contributed.ncl" before "shea_util.ncl":
"shea_util" now depends on some functions in "contributed.ncl".
For Linux and MacOS systems, the default fortran compiler
used has been changed from "g77" to "gfortran". If you
need to use the "g77" compiler, then use the new "-g77"
option:
New map databases have been added to NCL that provide improved map
outlines, and new map outlines like the provinces of China, and the states
of Brazil, India, and Australia. Some of the Antarctica ice shelves
have also been added.
Three new map projections have been provided as well: Hammer, Aitoff, and
Winkel tripel.
A new-and-improved
Mollweide projection has been added that
replaces the original Mollweide projection. The old Mollweide,
like a true Mollweide, has an elliptical perimeter twice as wide as
it is high (though with different dimensions) and its parallels are
straight and horizontal, as in a true Mollweide, but the shapes of the
land masses are noticeably different.
You can get the original Mollweide projection back by setting
the mpProjection resource to
"PseudoMollweide".
For some example scripts of these new features, see examples 16
through 19
at /Applications/maponly.shtml.
Note: get_script_name was originally an
unadvertised function in the shea_util.ncl script, and
behaved slightly different in that it returned only the prefix of the
NCL script name. To get the behavior similar to this old version of
the function, use the new get_script_prefix_name
function, which doesn't require any script to be loaded in order to
use it.
This function has been around awhile, but not documented.
New and updated WRF-NCL functions
Special thanks to Cindy Bruyere of NCAR/MMM for her development of
the WRF-NCL visualization scripts, and to her and Soyoung Ha, also of
NCAR/MMM, for the addition, overhaul, and extensive testing of the
WRF-NCL analysis scripts.
This ut_calendar function was also updated to add a
new option for returning the dates as arrays of integers rather than
floats.
The file list variable type, which references multiple files as the return value of the
addfiles function, has new functionality. Conforming variables aggregated
over the file set now are returned with attribute and coordinate variable metadata.
Additionally, the leftmost aggregated dimension can now be subscripted correctly using
integer, coordinate, or vector subscripting. However, there is currently one caveat for vector subscripts
on the leftmost dimension: the array of vector subscripts must be non-decreasing. There can
be repeated indexes but no index in the array can be less than a previous index. Hopefully, this restriction
will be removed in a future release.
This new functionality replaces the need for
using addfiles_GetVar to
retrieve variables from a span of files. It will also run faster and be
more flexible.
This resource will not be useful if your plots are very different in size.
Updated resources
The logic was wrong and it was copying the variable even when
the fill values were the same.
This is our first official open source release for NCL.
This release also includes full source code and binaries for NCAR Graphics, so you no longer
have to install the two packages separately.
New tool for checking validity of SCRIP input grid files
A new tool called "scrip_check_input"
tests whether the coordinates of all cells in a SCRIP input grid
file are entered in counterclockwise order and also tests whether the
cell centers are in the interior or on the boundary of the cells.
Added a suite of routines
to aid in visualizing ARW WRF model data.
For some systems (*), you can now specify a "Format" of
"NetCDF4Classic" in the setfileoption procedure to
create a file using the NetCDF 4 classic model format. The classic
model constrains the interface to the constructs provided by NetCDF 3
and earlier. However, the underlying file format, like that of all
NetCDF 4 files, is HDF 5. Files written in this format can take
advantage of the built-in file compression available in HDF 5. Use the
"CompressionLevel" option to enable compression. Also the HDF 5 format
removes virtually all restrictions on file and individual variable
size. NCL version 4.3.1 provides beta-level support for this format
because NetCDF 4 and the release of HDF 5 that it depends on are both
still in the beta-testing phase of development. It should probably not
be used for mission-critical file creation.
This option is not required for reading NetCDF 4 classic files. If
your version of NCL supports NetCDF 4 (*), then it will be able to automatically
detect whether you have a NetCDF 3 or 4 file.
(*) Some systems
(like any 64-bit system) do not have support for NetCDF 4 because the
NetCDF 4 software has not yet been ported and/or tested on those
systems. You can quickly tell if your version of NCL has NetCDF 4
support by running ncl interactively and typing one line:
A suite of 3D visualization
routines based on the low-level TDPACK package were added. There are
too many to list here, but you can see them by visiting the graphics
routines page, and looking at the functions that start with
"td".
In previous versions, when you wrote data to a netCDF file, the netCDF
file was opened and closed before and after every write. You could
turn this off by using setfileoption to set the
"SuppressClose" option to True. This is now the default, which should
improve performance.
In previous versions, also, the "DefineMode" option was set to False
by default, which meant that each write operation was performed
atomically. It now defaults to True, which can improve performance
dramatically if care is taken to define all dimensions, attributes,
and variables and assign attribute values before writing actual data
to the file.
If you set this resource to a string and rerun the plotting script you
are having problems with, then it will write the data being plotting
and the plot resources and their values to a new netCDF file. It will
also create a new NCL script that reads in this new netCDF file and
sets all the same plot options, so that your plot can be recreated
identically. This prevents users from having to send us their full
scripts and data. The new files will be called xxx.nc,
xxx.ncl, and
xxx.res, where xxx is what the resource
is set to.
To use this resource before version 4.3.1 is available, download gsn_code.ncl.debug and gsn_csm.ncl.debug,
put them in $NCARG_ROOT/lib/ncarg/nclscripts/csm (or wherever you want),
and then load these scripts instead of the original ones:
This is being fixed by overriding the MissingToFillValue setting and
refusing to create the virtual _FillValue. The following warning is
issued for each such variable:
This version of NCL includes a new GRIB2 reader. GRIB2 files are
supported by addfile, addfiles,
ncl_filedump, and ncl_convert2nc.
Detailed information is available in the "Information
on supported data formats" section of the
NCL Reference Manual.
Prior to version 4.3.0, NCL used an array of strings to represent
the coordinate values of an initial time dimension. This
representation proved to be problematic, both because it did not
conform to standard CF and COARDS conventions, and because it was
difficult to use in a context where numerical properties such as
monotonicity were usually expected.
To change the type back to "string", you can set the
"InitialTimeCoordinateType" option in the
setfileoption procedure:
To change the type back to "linear", you can set the
"ThinnedGridInterpolation" option in the
setfileoption procedure:
For example, in the line below:
In release a034, the string "No_FillValue" was introduced for use
within the new statement. Use of "No_FillValue"
as the third argument of new would result
in no _FillValue being assigned to "q".
A side effect of this new behavior is that the following will result
in a fatal error:
It should be noted that getFillValue was only intended to be used
within the new statement.
http://www.nco.ncep.noaa.gov/pmb/docs/on388/table4.html
If in parsing a record that belongs to a particular variable it
encounters a time unit indicator different from the established
indicator, it compares them and chooses the one with the shortest
duration to be the common unit. Then it sets the time period for each
record based on converting it into the common units. For periods of a
month or greater, this is currently not entirely accurate, because it
is based on a year of 365.25 days and the average number of hours in a
month. However, because no files of this type have yet been
encountered (and may never be), it does not seem worthwhile to develop
anything more accurate at this point. The code does print warnings
(probably too many) if this situation is encountered.
This has been fixed in this release, and you won't get any error
message.
Command line arguments and options
The next version of NCL will have a long-requested enhancement added,
and that is the ability to include options and arguments on the NCL
command line. For more information and some examples, see the
"Command line arguments and
options" section in the NCL
Reference Manual.
This function is similar to gsn_csm_xy2 except it allows three vertical
scales for three different quantities.
New functionality
However, if you want to overlay
multiple contour and/or vector plots on a map, you need to be able to
create them using gsn_csm_vector and
gsn_csm_contour so you can
then use them in an overlay call.
So, the "lat2d" and "lon2d" special attributes are now recognized
by these kind of gsn_csm routines.
Important bug fixes
The new eofunc included in a033
uses a completely different program to calculate EOFs.
This "off by 48 hours" has been fixed for a033.
The a032 temporary work-around was as follows:
for times after 1900-01-01 00:00, 48 hours had to be
added to the values returned by NCL.
The second "fix" to the GRIB reader was not so much a fix as a removal
of a hard-coded upper limit for the size of lat/lon arrays for thinned
grids.
New and updated functionality
In recent years, many new non-uniform grids have become popular and
these are being processed by new algorithms to reduce them to triangle
meshes and to contour directly on these triangles, rather than
interpolating to a uniform grid and contouring.
For more information, see the short document
on non-uniform grids that NCL can contour, and the following
example sections: SEAM (HOMME)
grids, Geodesic
grids, and Adaptive grids.
File suffixes recognized by these two functions are now case
insensitive. For example, ".nc" and ".NC" are both recognized as
representing netCDF files.
NCL now has OPeNDAP
(formerly known as "DODS") capabilities built into it, but only for systems that OPeNDAP is supported on
(Linux, Solaris, AIX). What this means is that you can use functions
like addfile and isfilepresent
to access netCDF datasets served by an OPenDAP server.
Here's an example and also a way to test if your version of NCL is
OPeNDAP-enabled:
Respectively, these resources allow you to specify the line
thickness of the zero contour, specify a scale factor to apply to the
current line thicknesses, and specify a dash pattern for negative
contours. For some examples, see the contour effects
examples.
The eofunc* suite of three functions
(eofunc, eofunc_ts,
eofunc_varimax) implements a more efficient method
for computing EOFs. The previous suite of EOF functions will be
available but should be replaced by the eofunc* functions.
Returns the NCL version as a string.
The input X, Y, and text arrays are no longer restricted to be
1-dimensional. If they are multi-dimensional, they must be the same
dimensions as each other. Any one of them can be a scalar.
The font for the longitude labels and gsnRightString, gsnLeftString, and gsnCenterString were all defaulting to
"helvetica-bold," which is inconsistent with the rest of the gsn_csm
plotting scripts, whose labels default to "helvetica".
These fonts were changed to be just "helvetica", which
means you may notice a difference when generating polar plots with
this version of NCL.
To keep the polar longitude labels and/or three top subtitles set to
"helvetica-bold", you need to set:
These functions are similar to gsn_csm_xy, only they allow you to have a
different axis system on one or both of the top X and bottom right
axis.
Several unrecognized centers are used for these files. The
work-around code is activated when an unrecognized center is
encountered.
User-defined parameter tables are still needed and NCL does not
attempt to supply a name for the center.
These new variables, which are of type "double", contain the same
information as the current initial_time(n) variables which are of type
"string". The two new variables are:
Returns a grid that contains a land sea mask given any
(e.g. gaussian, fixed offset, curvilinear) latitude and longitude
array. The result can then be applied to any array on the same grid
using mask.
Integrates a sequence of equally spaced points using Simpson's
Rule.
Integrates a sequence of unequally spaced points using Simpson's
three-point formula.
Places randomly-spaced data onto the nearest locations of a grid
with two-dimensional latitude and longitude arrays.
Creates a Vis5D+ formatted file.
Writes compressed gridded data to a Vis5D+ formatted file.
Writes a single gridded variable to a Vis5D+ formatted file.
Sets the lowest vertical offset, per grid level, for each gridded
variable in a Vis5D+ formatted file.
Sets a name for physical units associated with a variable in a
Vis5D+ formatted file.
Closes a Vis5D+ formatted file.
Uses the wind barb functions from the Wmap package to draw wind
barbs over maps.
If you are creating a zonal means plots using the gsnZonalMean resource, then you now have access
to three new resources:
A bug was fixed in asciiread which
caused it to read in lone periods (".") as float values equal to "0".
For example, if you had the string "The data file is called file.cdf",
it would treat the period in "file.cdf" as the value 0.
If you subscripted an array using coordinate subscripting, and
gave it a "finish" subscript and not a "start" subscript, then you may
have gotten one extra coordinate value. For example, the simple script
below demonstrates this:
If you tried to use coordinate subscripting without actually
using a subscript value, as in:
NCL is now tolerant of netCDF files where a multi-dimensional
variable has the same name as a dimension (in other words, something
that NCL saw as a coordinate variable, and wanted it to be
one-dimensional). NCL no longer assumes that a variable with the same
name as a dimension is a coordinate variable unless the variable has a
single dimension.
There was a problem with coordinate array subselection using
double coordinate values: the coordinate values were only being
compared to float precision.
This fix allows the following code to execute correctly:
When you set the special resource gsnMaximize to True, this maximizes the size of
the plot(s) in the current frame. For PostScript or PDF output, the
maximization is done by computing something called device coordinates
that tells PS/PDF how the output is supposed to appear on the page.
Previously, if these device coordinates were not reset or recalculated
after the frame was advanced, then subsequent plots may not have been
drawn correctly in the frame.
This bug was fixed by having the device coordinates set back to their
original values, but only if the frame is advanced by the plotting
routine (that is, if you set gsnFrame to
False, then the device coordinates are not set back to their original
values).
You can reset the device coordinates yourself by calling the procedure:
New and updated functionality
You also now have better control over the density of contour line
labels using the new resource cnLineLabelDensityF. This resource allows
a simple (though inexact) method for controlling the number of line
labels on a ContourPlot for both the "Randomized" and "Computed" line
label placement modes. It has no effect for the "Constant" mode, which
depends on cnLineDashSegLenF to
determine the spacing.
If cnLineLabelDensityF is set to
its default value of 0.0, it has no effect, and the line label spacing
can be controlled using the cnConpackParams resource as always. If
cnLineLabelDensityF is set to 1.0, then the default settings of the
appropriate Conpack parameters apply, overriding any that are set by
cnConpackParams. As cnLineLabelDensityF is set to values greater than
1.0, the number of labels increases, while setting it to positive
values less than 1.0 causes the number of labels to decrease.
This version was released shortly after the previous version to fix
some bugs that were found in the dashline and stippling code. Also,
some people were running into problems with cyclic data. If you have
problems with this version, please send email to Mary Haley.
New documentation
For an example, click on the script stipple.ncl, or see its output
(frame 1, frame 2, and frame 3).
For more information, please see the "supported data formats
information" section in the NCL Reference Manual.
The ability to load GRIB parameters from a file has been added.
This can be done by setting the environment variable
NCL_GRIB_PTABLE_PATH to a file or directory path. Parameter tables
read from a file have precedence over built-in tables that would
otherwise apply to the same dataset. An interface for adjusting this
precedence at run-time is on the enhancement request list.
Many new built-in parameter tables were added, including all tables
supported by wgrib,
three FSL tables, and a Navy Fleet Numerical Meteorology and
Oceanography Center table.
Support was added for thinned "quasi-regular" grids.
The way NCL names certain GRIB variables has been changed. This may
result in variable names that are incompatible with previous names. In
particular, variables involving average, accumulation, and difference
over specific periods of time. For example, the variable
PRATE_GDS4_SFC_ave will now be PRATE_GDS4_SFC_ave6h. This was
required because some GRIB files have averages for several differing
periods on the same file.
A problem was fixed for parameters less than 128 in ECMWF files.
Otherwise, you can create a PDFWorkstation much
like you do a PSWorkstation.
Where possible, contiguous data are now copied used single invocations
of memcpy, thus speeding up the intialization of various kinds of
array assignments, including:
This means that any NCL scripts that are setting the lat2d/lon2d
attributes and expecting the cyclic point to be added, you will need
to add a line setting gsnAddCyclic to
True:
New and updated functions, and bug fixes
For
an example, click on the script histogram.ncl, or see its output
(frame 1, frame 2, frame 3, frame 4, and frame 5).
A vector bug was discovered in version 4.2.0.a025 that's serious
enough to warrant releasing a bug fix right away (hence this
version). This bug caused coordinate arrays to be ignored when vector
plots were being overlaid on a map plot, and thus the vectors were not
appearing in the right location.
New capabilities in NCL
The above example also showcases the new discrete rasterization
capability. If the lat/lon coordinate arrays have one more element
along both dimensions than the data array, then in raster mode, this
will cause the raster fill to treat the coordinate arrays as cell
boundaries.
You can see some more examples in the pop applications page.
New and updated functions
See example 5 in the histogram application pages.
To generate map tickmarks automatically (if you are not using gsn_csm
functions), set the pmTickMarkDisplayMode resource to
"Always" when you are setting the map resources.
For an example, click on the script maptm.ncl, or see its output.
For information on how to download and install the RANGS/GSHHS,
please click here.
Once you have the database installed, you can see an example by
clicking on the script coast_2.ncl, or
viewing its
output.
New and updated functions
Click on bar.ncl to see a
script example, and bar1.gif/bar2.gif to see example graphics.
Functions/procedures added or updated
Functions/procedures added or updated
Functions/procedures added or updated
Functions/procedures added or updated
Specifically:
Functions/procedures added or updated
Functions/procedures added or updated
Functions/procedures added or updated
Functions/procedures added or updated
Email list
We created an email list called "ncl-talk" for NCL users to exchange
ideas and information. To learn more about this email list, see the
archived messages, or to subscribe, go to email lists.
Functions/procedures added or updated
Climate divisions were added to the map database. To see an NCL
example that draws all of the climate divisions in the United States,
see the script climate.ncl and its output
(frame 1 and frame 2).
Functions/procedures added or updated
Functions/procedures added or updated
Functions/procedures added or updated
Functions/procedures added or updated
Functions/procedures added or updated
To load anyone of these color maps, you can use any one of the
following code snippets. The color map "rainbow" is being used in
these examples:
Using GSUN calls:
NIO_GRIB2_CODETABLES to this copy of the code tables NCL
will immediately incorporate the modifications into its presentation of GRIB2
data.
VAR_x_x_x_... (for GRIB2 data),
where the 3 'x's stands for discipline, category, and parameter number. This
is also true for GRIB1 data, except that the form is VAR_x_...,
where 'x' is simply the parameter number.
.and.) and or (.or.) operators now perform lazy evaluation
in an array context. If the left hand side logical expression is a scalar, there is no change in behavior. If
the left hand logical expression is an array, lazy evaluation is now performed on an element by element basis.
This gives a different result than previous versions of NCL for any elements that match the following two cases:
Prior versions returned Missing for both these cases. As of the current version, the first case returns True
and the second case returns False. However, unlike with lazy evaluation when the left hand side is scalar,
both the left hand side and right hand side expressions are evaluated individually prior to applying either logical operator.
This means that this form of lazy evaluation cannot be used to avoid error conditions that might occur from evaluation of the
right hand side expression.
True .or. MissingFalse .and. Missing
[Click on
image for larger version.]
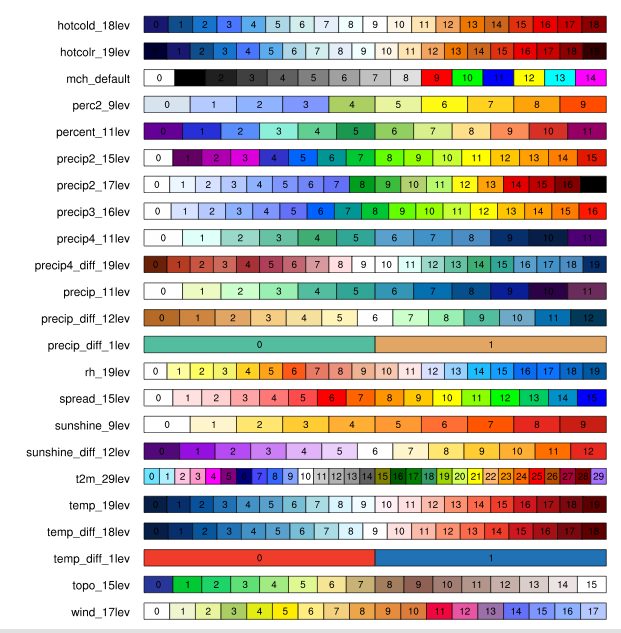
setfileoption("nc", "Format", "NetCDF4Classic")
Version 5.1.1
June 16, 2009
New functions
The following tables were updated:
These bugs have been fixed in V5.1.1.
  f    = addfiles("file*07*.nc","r")
  xnew = f[:]->x(::5,:,:)
  fnames = (/ "file01.nc", "file02.nc" /)
  fp = addfiles(fnames, "r")
  days = fp[:]->days
  print(days)
  days = days / sum(days)
  print(days)
days(:) = days(:) / sum(days)
          PM      TM        <=== Raw Data
        3.64    226.77
        7.59    225.53
       14.36    224.89
       24.61    221.39
       38.27    213.97
      [snip]
Let's say that interpolation to the following pressure levels
(PI) is desired:
PI = (/ 5, 7, 10, 20, 30, 50, ...... /)
The following shows the values interpolated by the
vinth2p and vinth2p_ecmwf
functions before (v5.1.0) and after (v5.1.1) the bug fix:
        PI    v5.1.0    v5.1.1    diff
         5    225.78    226.34   0.564
         7    225.59    225.72   0.129
        10    225.30    225.30   0.000 No differences
        20    222.96    222.96   0.000
    [snip]
The differences could be 'small' or 'large'. It depends upon the
vertical distribution of the variable.
load "$NCARG_ROOT/lib/ncarg/nclscripts/csm/contributed.ncl"
load "$NCARG_ROOT/lib/ncarg/nclscripts/csm/shea_util.ncl"
WRAPIT -g77 your_file.f
Version 5.1.0
4 March 2009
The following tables were extensively updated:
TimePeriodSuffix
True, meaning that the suffix appears. Use setfileoption to
set it False, which causes the time period suffix to be removed from all statistically-processed variables in NCL's representation of the file.
The part of the suffix that indicates the type of statistical processing (e.g. '_acc', meaning accumulation) remains.
Be aware that setting this option False can in some cases cause name collisions between variables that should be considered distinct.
In this case, variable names after the first instance have an incrementing numerical suffix, beginning with '_1', appended to disambiguate the names.
 long_var  = 32l
 short_var = 5h
 byte_var  = 2b
Old way:
 long_var = new(1,long)
 long_var = 32

 short_var = inttoshort(5)

 byte_var = inttobyte(2)
TimePeriodSuffix
TimePeriodSuffix described above is supported in the NCL tools
ncl_convert2nc and
ncl_filedump as option [-tps]
The
default value is True -- setting this option causes the time period suffix
to be removed, as noted above.
ncclose: ncid 0: NetCDF: Not a valid ID
If a local file is opened for writing this error could result in loss of data in the file. The workaround for
earlier versions of NCL is either to ensure that all NCL file variables are deleted before
exiting, or, to use setfileoption to set both the options DefineMode
and SuppressClose to False.
Version 5.0.0
6 November 2007
New functionality
New resources
Performance enhancements
Version 4.3.1
10 August 2007
ARW WRF functions
wrf_contour - Creates a contour
plot from ARW WRF model output.
wrf_map - Creates a map
background for ARW WRF model data.
wrf_map_overlay - Overlays
different plot id's over a map background.
wrf_map_zoom - Zooms into a
portion of the ARW WRF model domain, and creates a map background.
wrf_overlay - Overlays multiple
plots, created from other ARW WRF plot functions.
wrf_user_getvar - Extracts data
from ARW WRF model output, and does basic diagnostics calculations.
wrf_user_intrp3d - Interpolates
ARW WRF model data vertically or horizontally.
wrf_latlon_to_ij (built-in function) - updated to
return missing values if any of the input lat/lon values are
out-of-range.
wrf_user_list_times - Extracts
the list of available times in the ARW WRF model output.
wrf_vector - Creates a vector
plot from ARW WRF model output.
setfileoption("nc","format","netcdf4classic")
If you get a warning message:
warning:FileSetFileOption: invalid value supplied for option format
then your version of NCL does not have NetCDF 4 support. If your
version does have NetCDF 4 support, then you can further
control the level of compression with:
setfileoption("nc","compressionlevel",5)
The third argument can be any value from 1 to 9, where 9 is the highest
level of compression. See the setfileoption documentation
for more information.
Low-level three-dimensional visualization routines
gc_clkwise - tests clockwise/counterclockwise
ordering of points on spherical polygon.
gc_dangle - finds the directed angle between two
great circles having a specified intersection point.
gc_inout - determines if a specified point is
inside or outside of a spherical polygon.
gc_onarc - determines if a point on the globe lies
on a specified great circle arc.
gc_pnt2gc - finds the angular distance from a point
to a great circle.
gc_qarea - finds the area of a quadrilateral patch
on the unit sphere.
gc_tarea - finds the area of a triangular patch on
the unit sphere.
New resources
Bugs fixed
  load "$NCARG_ROOT/lib/ncarg/nclscripts/csm/gsn_code.ncl.debug"
  load "$NCARG_ROOT/lib/ncarg/nclscripts/csm/gsn_csm.ncl.debug"
Rerun your script with res@gsnDebugWriteFileInfo set to whatever
string you like, and then you can give us the resultant new
netCDF and NCL script.
    warning:NetOpenFile: MissingToFillValue option set True, but missing_value
    attribute and data variable (x) types differ: not adding virtual _FillValue
    attribute
Version 4.3.0
1 May 2007
New GRIB2 reader
New features available for both GRIB 1 and 2
Important changes to the GRIB1 reader interface - PLEASE READ
setfileoption ("grb","InitialTimeCoordinateType","string")
setfileoption ("grb","ThinnedGridInterpolation","linear")
"Linear" is still the default for bitmask arrays.
Possible incompatible change to getFillValue function
Prior to version 4.3.0, getFillValue would return the default
_FillValue if a variable did not have _FillValue associated with
it.
q = new( 10, typeof(w), getFillValue(w))
if "w" is of type "float" and if "w" did not have a _FillValue, then
getFillValue would return the
_FillValue for a variable of type "float". Hence,
q@_FillValue = -999. In some cases this result was not
desired.
q@_FillValue = getFillValue(w)
if the variable has no _FillValue associated with it. The reason
is the the string "No_FillValue" can not be assigned to "q"
unless q is of type string.
Other changes to the GRIB1 reader
New functions
New functionality
<ARRAY> as long as the array has 10 or fewer elements.
New resources
New color tables
Important bug fixes
fatal:syntax error: <identifier> IS A FUNCTION NOT A PROCEDURE
This has been fixed so you should now get the name of the function, as
well as the line number it occurred on. For example:
ncl 0> abs(-1)
fatal:syntax error: abs is a function not a procedure; return value must be referenced
fatal:error at line 0
ncl 1>
if (flags(x)) then
was not working as efficiently as this code:
if (flags(x).eq.True) then
$NCARG_ROOT/lib/ncarg/nclscripts/csm/contributed.ncl
and changing the line:
nrow_s = systemfunc("'wc' -l" + fNam +" | awk '{print $1}'" )
to have a space after the "-l":
nrow_s = systemfunc("'wc' -l " + fNam +" | awk '{print $1}'" )
Version 4.2.0.a034
26 September 2006
New applications
New functions
New functionality
New resources
Important bug fixes
fatal:syntax error: line -1 before or near
Version 4.2.0.a033
23 January 2006
New functions
  x = new(1,float)
  print("x = " + x)
would produce:
(0) -999
With the next release of NCL, you will get:
(0) x = -999
begin
 do i = 0,200
  print((/i/))
  x1D = new((/4000000/),integer)
  x1D = 1
  qsort(x1D)
  delete(x1D)
 end do
end
Version 4.2.0.a032
6 December 2004
Important bug fixes
begin
;
; The URL is so long, break it into two pieces.
;
  url      = "http://www.cdc.noaa.gov/cgi-bin/nph-nc/Datasets/"
  filename = "ncep.reanalysis.dailyavgs/pressure/air.1948.nc"

  exists = isfilepresent(url+filename)
  if(.not.exists) then
    print("OPeNDAP test unsuccessful.")
    print("Either the file doesn't exist, or NCL does not have")
    print("OPeNDAP capabilities on this system")
  else
    f = addfile(url + filename,"r")
;
; "variables" should be equal to
; (/"air","time","lon","lat","level"/)
;
    variables = getfilevarnames(f)
  end if

end
  res@gsnPolarLabelFont = "helvetica-bold"
  res@gsnStringFont     = "helvetica-bold"
132: Extreme forecast index
162: Usage: ECMWF re-analysis, ERA40
200: Usage: Differences between first guess and analysis
If you are wondering what a zonal mean plot is, see example 7 in
the list of color
examples.
begin
  level = (/1.5,2.5,3.5,4.5,5.5/)

  lev   = (/level/)
  lev!0 = "lev"
  lev&lev = level

  lev1 = lev({:3})
  lev2 = lev({0:3})

  print(lev1)
  print(lev2)
end
The two arrays lev1 and lev2 should be identical and
equal to (/1.5,2.5/). Before this bug fix, lev1 was
incorrectly getting the values (/1.5,2.5,3.5/).
buf2 = buf({lev|:},{lon|:},{lat|30:50})
it would sometimes cause a core dump.
  coord = (/1234.5678901230d,1234.5678901231d,1234.5678901232d,\
            1234.5678901233d /)

  h   = (/ 4,5,6,7 /)
  h!0 = "coord"
  h&coord = coord
  printVarSummary(h)
  print(h&coord)

  v1 = 1234.56789012305d
  v2 = 1234.56789012311d
  v  = h({v1:v2})
  print(v)

  v  = h({1234.56789012305d:1234.56789012319d})
  print(v)
reset_device_coordinates(wks)
This procedure should only be called after the frame is advance, and
before any drawing has occurred on the new frame.
float Longwave_flux_minimum_value__316 ( day, region )
valid_range :
Version 4.2.0.a031
2 January 2004
Important bug fixes
Version 4.2.0.a030
1 July 2003
Version 4.2.0.a029
1 July 2003
New and updated functionality
Important bug fixes
    d = 1d
    d = 1D
    d = 1D0
    d = 1d+0
    d = 1d-0
warning:TransInitialize: Zero Y coordinate span: defaulting:[errno=1104]
and the axis representing the constant data would default to a minimum
of 0 and a maximum of 1. This has been fixed so that the minimum and
maximum are calculated based on the value of the constant data.
http://www.nco.ncep.noaa.gov/pmb/docs/on388/
with the exception that model index 84 was changed from "MESO ETA
Model (currently 12 km)" to simply "MESO ETA Model", because we
believe the same index has been used historically for a number of
different model resolutions. Model indexes 83 and 85 are changed from
"No longer used" to what they were previously: "ETA Model - 80 km
version" and "ETA Model - 30 km version", on the assumption that any
GRIB file with these model indexes would be an old one.
Version 4.2.0.a028
31 March 2003
Important bug fixes
    netcdf test {
    dimensions:
            ncl_scalar = 1 ;
    variables:
            int c(ncl_scalar) ;
    data:

     c = 5 ;
    }
Now, you can write scalars to an HDF or netCDF file using one of two
methods:
You are no longer allowed to define the dimension "ncl_scalar" using
filedimdef. If you do, a warning level message is
returned:
    f = addfile("test.nc","c")
    filevardef(f,"c","integer","ncl_scalar")
    c    = 5
    f->c = c
    f    = addfile("test.nc","c")
    c    = 5
    c!0  = "ncl_scalar"
    f->c = c
Using one of the above methods results in a file as follows:
    netcdf test {
    variables:
            int c ;
    data:

     c = 5 ;
    }
    c    = 5.123
    c@long_name = "sample constant"
    c@units     = "m"

    f = addfile("test.nc","c")
    filevardef(f,"c", typeof(c), "ncl_scalar")
    filevarattdef(f,"c", c)
    f->c = (/ c /)                    ; Use '(/' and '/)' to avoid
                                      ; copying of attributes.
Using the above method results in a file as follows:
    netcdf test {
    variables:
            float c ;
                    c:units = "m" ;
                    c:long_name = "sample constant" ;
    }
    FileAddDim:"ncl_scalar" is a reserved file dimension name in NCL;
    it cannot be defined by the user
Note that there is no restriction on using the name "ncl_scalar" as a
dimension name for ordinary variables: only for defining it as a file
dimension.
The optimization is only possible when certain conditions are met:
New and updated functions
res@gsnAddCyclic = True
Version 4.2.0.a027
30 December 2002
Version 4.2.0.a026
24 September 2002
Version 4.2.0.a025
16 September 2002
discrete rasterization capability
ncl xy.ncl
or:
ncl < xy.ncl
Version 4.2.0.a024
13 May 2002
New and updated functions
Version 4.2.0.a023
14 February 2002
Version 4.2.0.a022
28 November 2001
linint1
Updated to allow the input or output X coordinates to be
increasing OR decreasing.
Version 4.2.0.a021
24 September 2001
Version 4.2.0.a020
24 July 2001
gsnSpreadColorEnd
  fatal:ContourPlotDraw: ARSCAM/ARPRAM - ALGORITHM FAILURE
  fatal:ContourPlotDraw: draw error
  fatal:ContourPlotDraw: draw error
  fatal:PlotManagerDraw: error in plot draw
  fatal:_NhlPlotManagerDraw: Draw error
to appear, and the plot wouldn't get drawn.
Version 4.2.0.a019
12 June 2001
Version 4.2.0.a018
14 May 2001
Version 4.2.0.a017
2 April 2001
Version 4.2.0.a016
16 March 2001
Version 4.2.0.a015
14 February 2001
Version 4.2.0.a014
2 January 2001
Version 4.2.0.a013
8 November 2000
Version 4.2.0.a012
30 October 2000
gsn_add_polyline
gsn_add_polymarker
Version 4.2.0.a011
28 August 2000
Version 4.2.0.a010
31 July 2000
Version 4.2.0.a009
12 June 2000
(user can specify percent of non-missing data required)
xnew = new( dimsizes(x), typeof(x) )
(exact same routine as "regcoef", only you don't need to
allocate
space for output variables)
Version 4.2.0.a008
18 January 2000
Version 4.2.0.a007
6 December 1999
Version 4.2.0.a006
2 November 1999
Version 4.2.0.a005
29 September 1999
More predefined color maps were added in version 4.2.0.a005. To get a
list of all the available predefined color maps in ncl, type:
print(NhlPalGetDefined)
from the NCL command line. See the color
table gallery for a table of the available color maps.
  wks = gsn_open_wks("x11","test")
  gsn_define_colormap(wks,"rainbow")
or
  type = "x11"
  type@wkColorMap = "rainbow"
  wks = gsn_open_wks(type,"test")
Using straight NCL code:
  wks = create "workstation" xWorkstationClass
    "wkColorMap" : "rainbow"
  end create
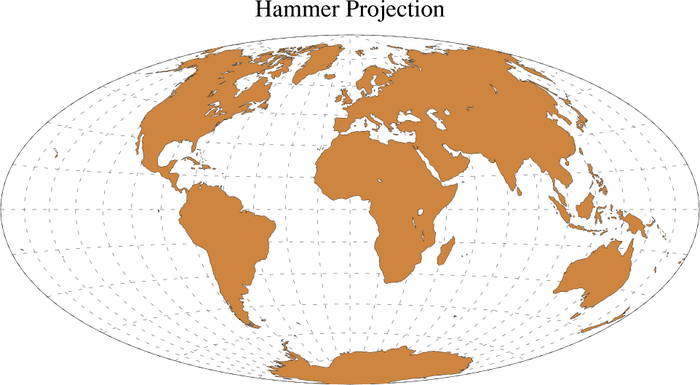
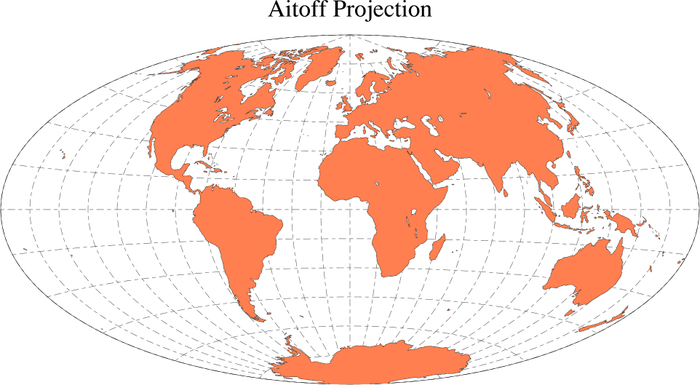
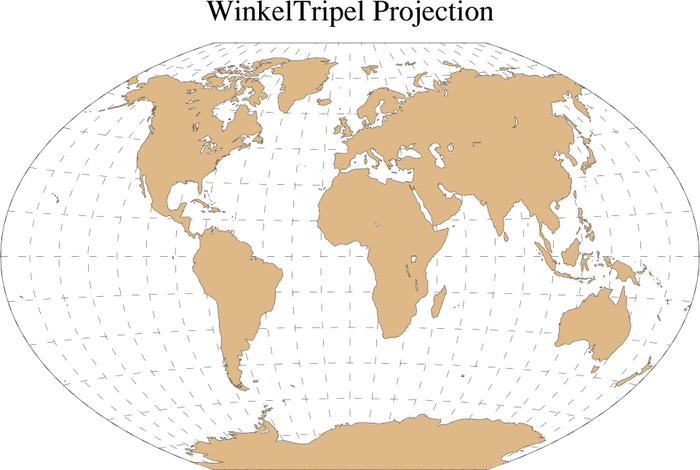
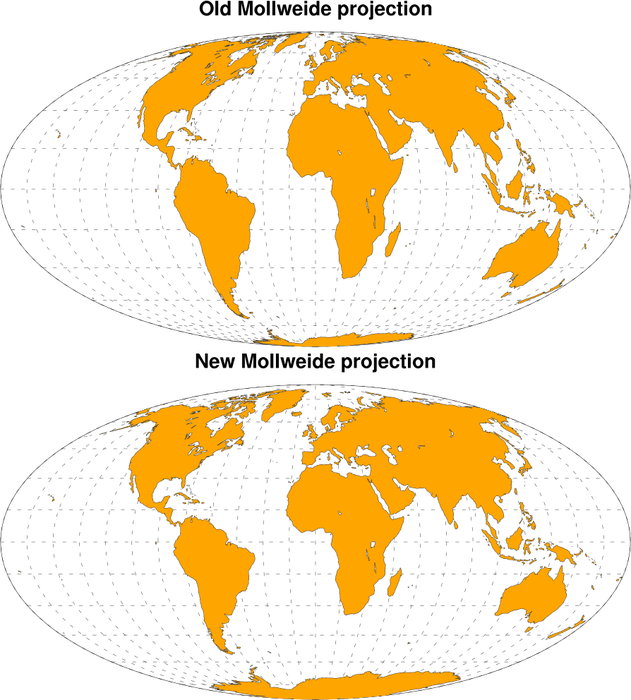
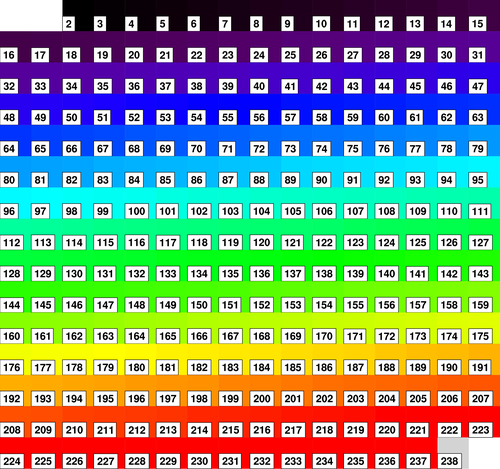