NCL Visualization Gallery
This gallery is a sample of some of the visualizations you can create with NCL. For a full list of NCL examples, please see the category list of application examples.Click on the image for a larger view. Click on the text for more examples.
Bar Charts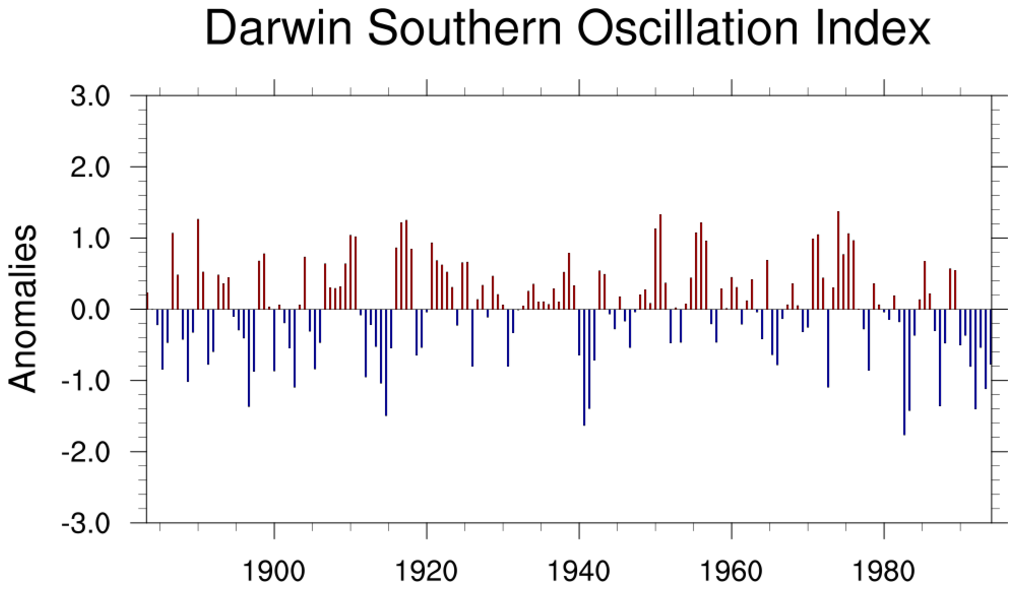
|
Vectors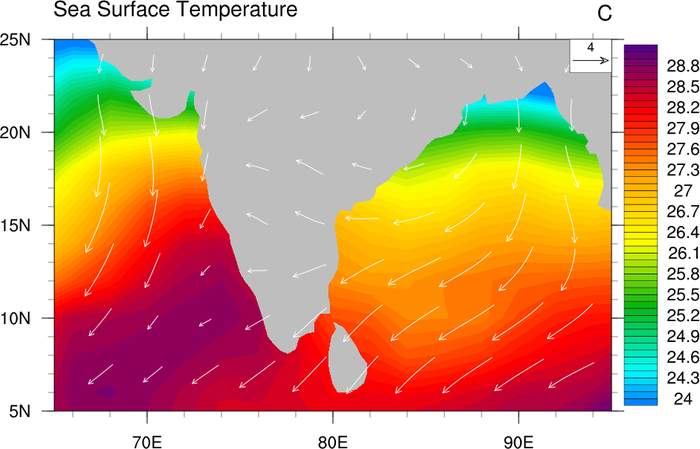
|
Streamlines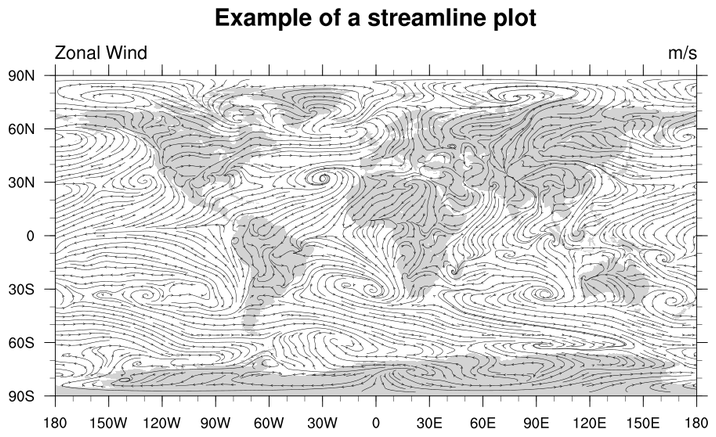
|
Press/Height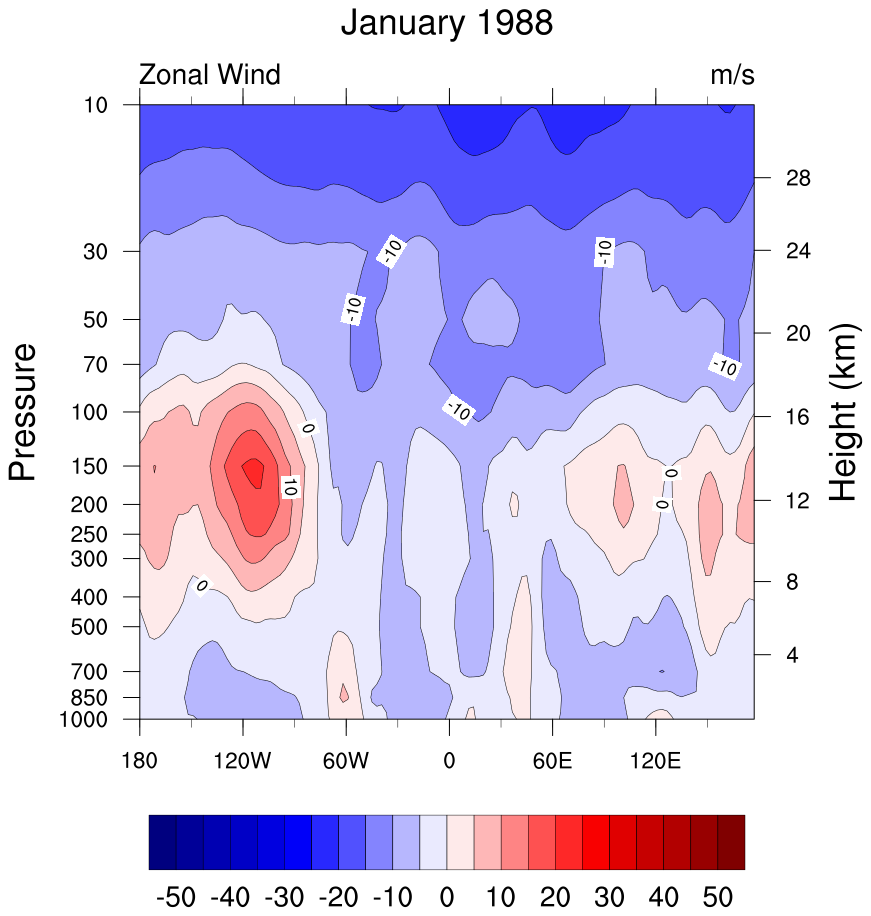
|
XY Plots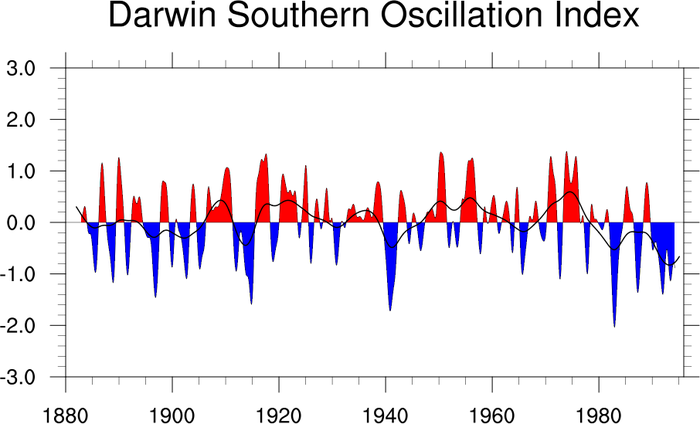
|
Paneling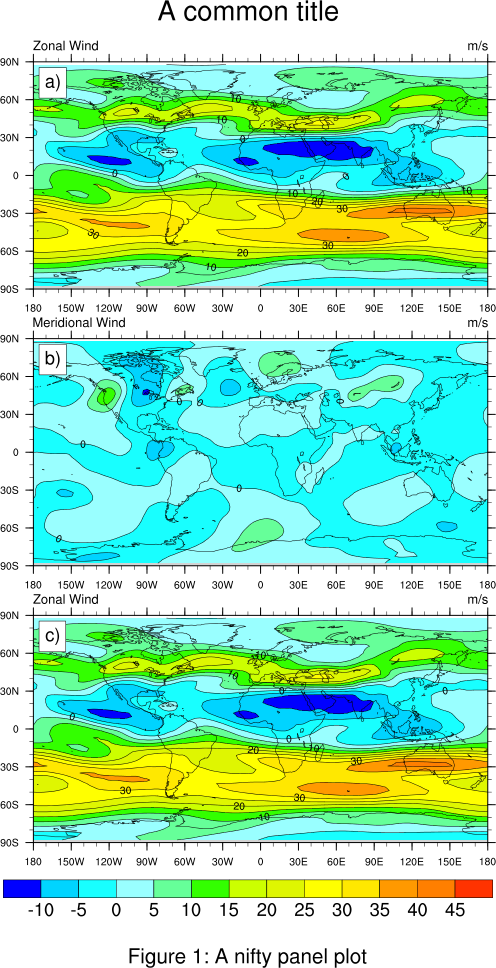
|
Polygons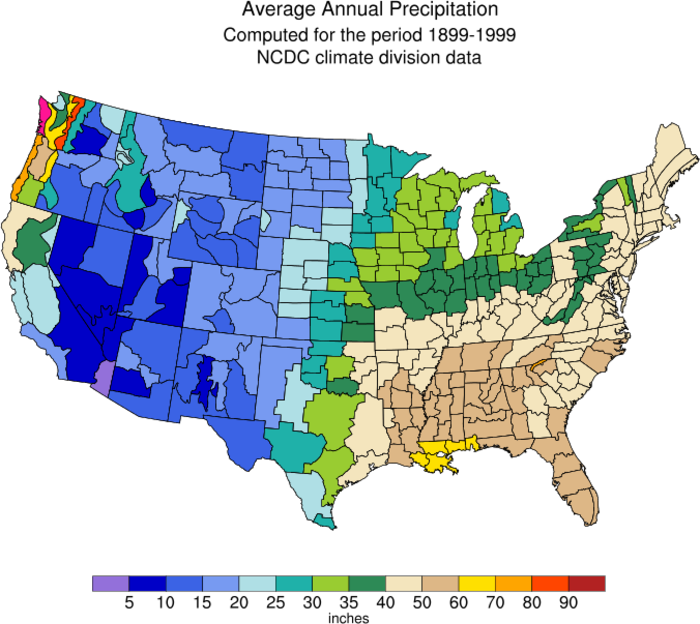
|
Box Plots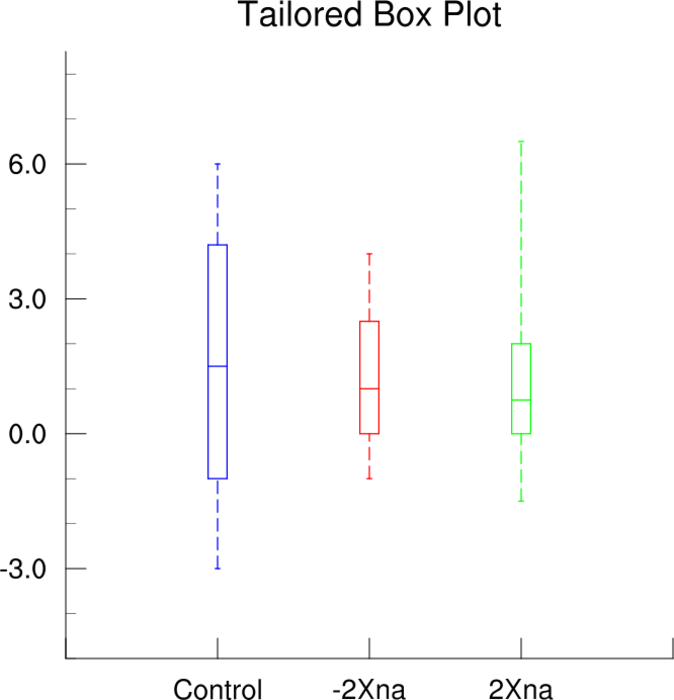
|
Histograms
|
Meteograms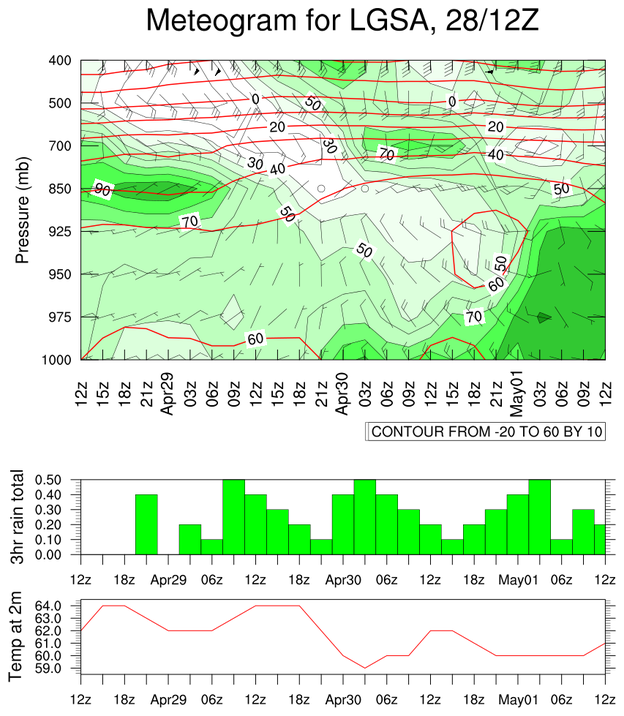
|
SkewT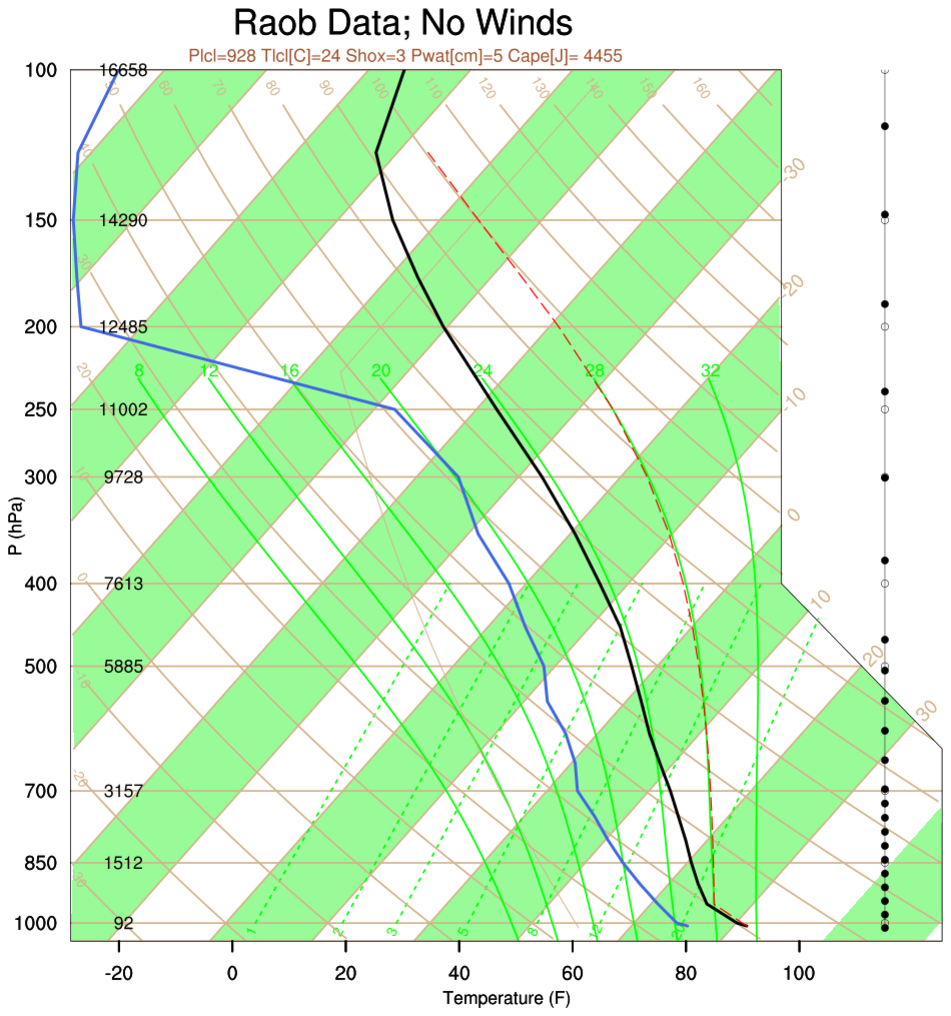
|
Contours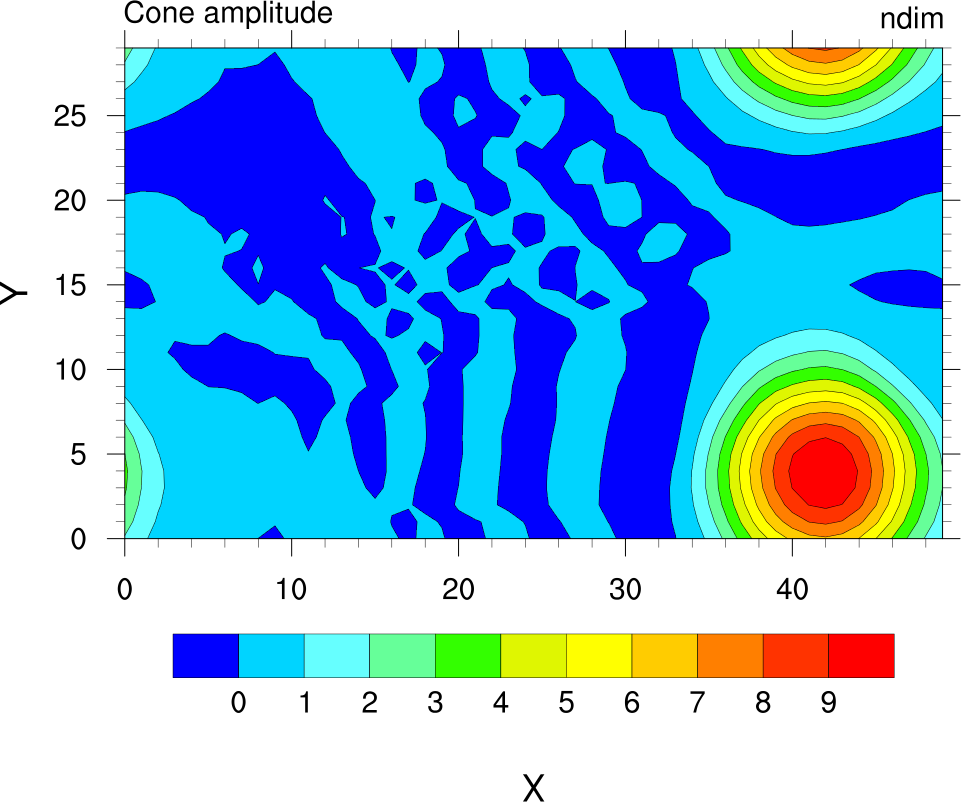
|
Map Projections
Cylin. Equ.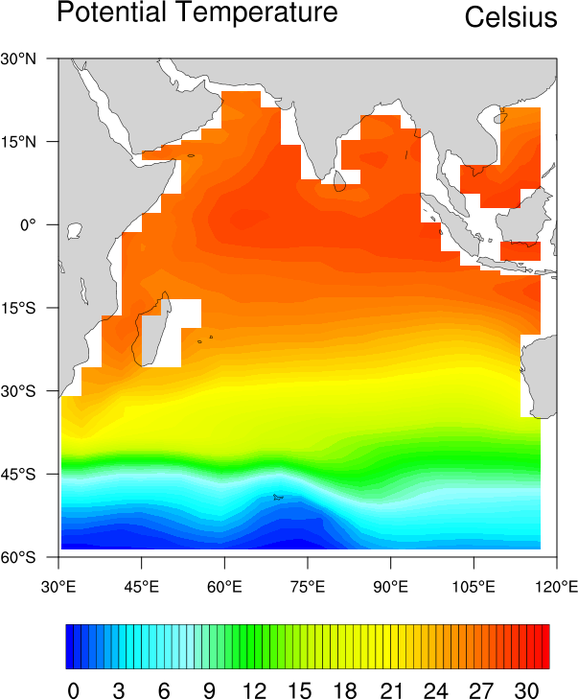
|
Polar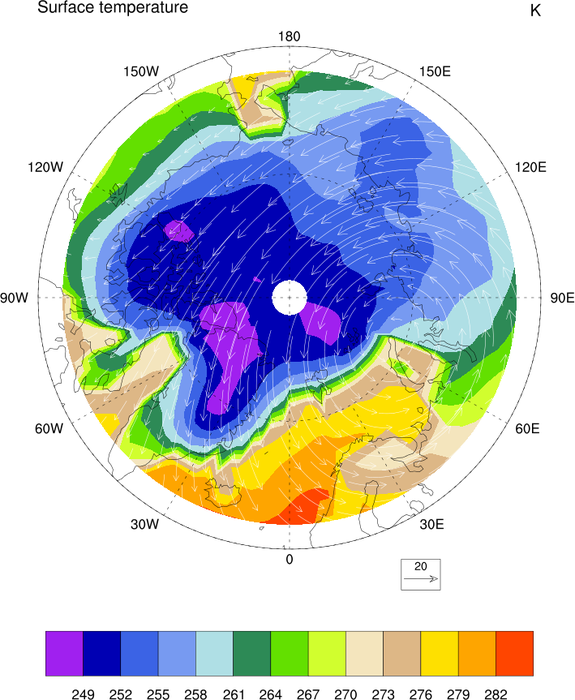
|
Lambert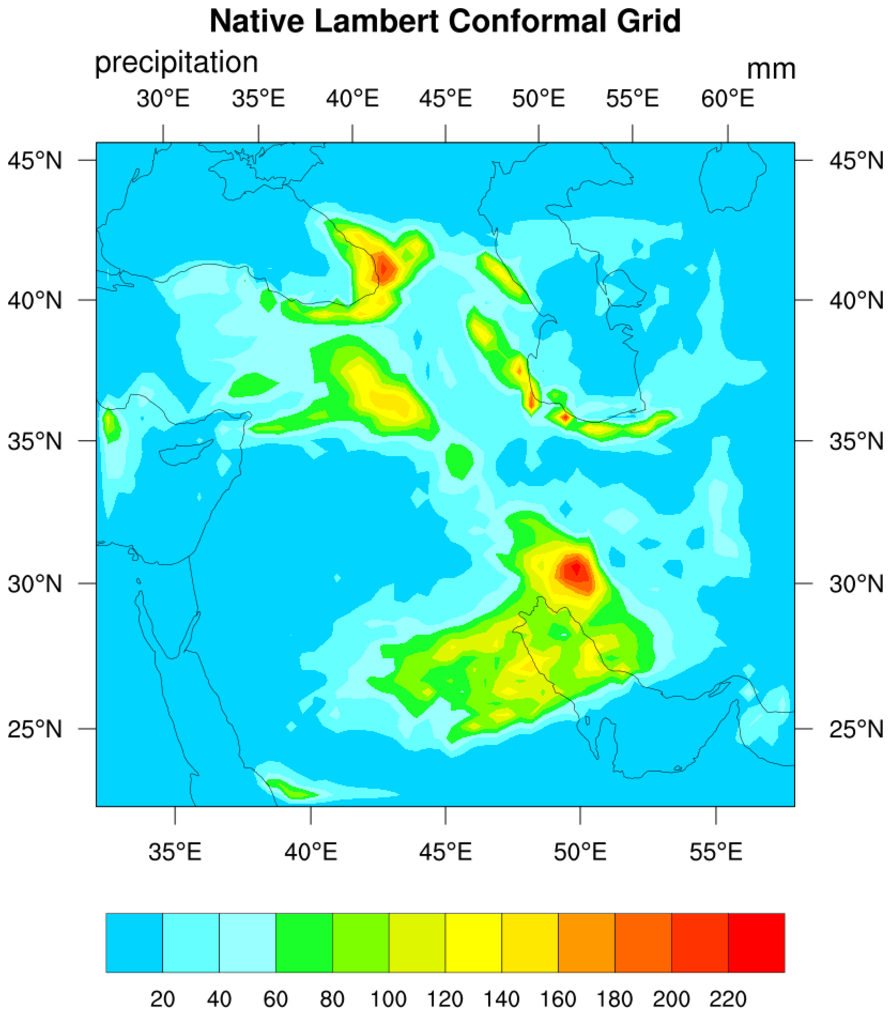
|
Satellite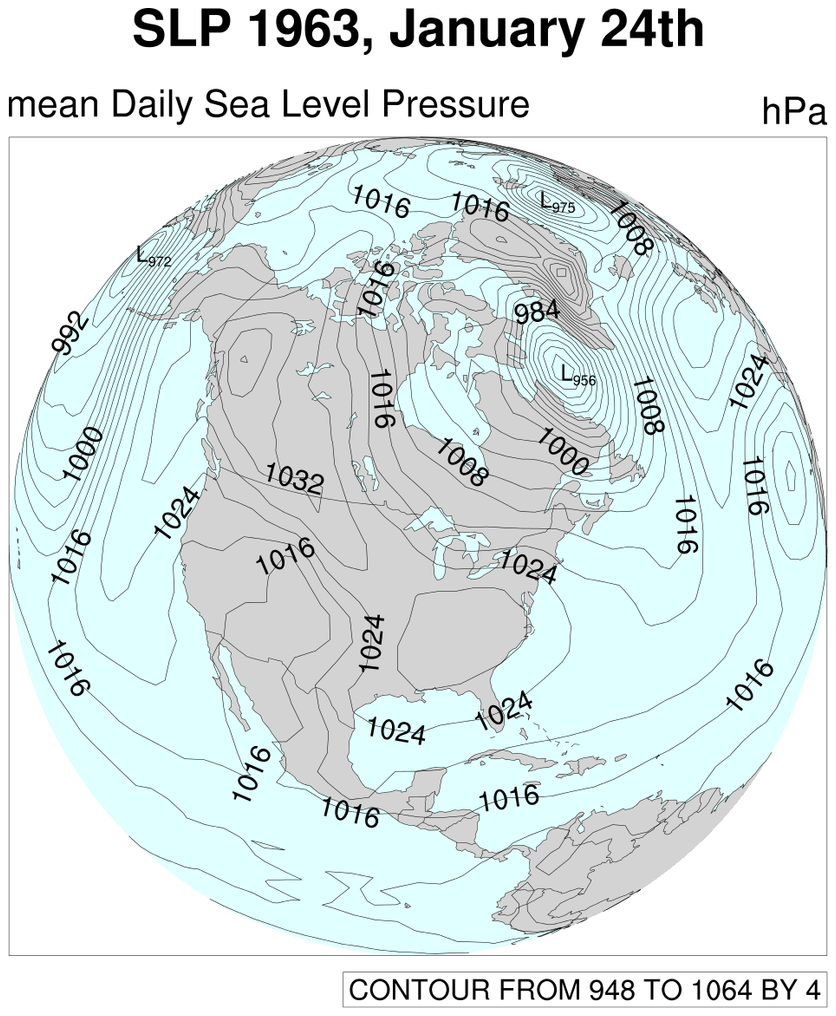
|
Mollweide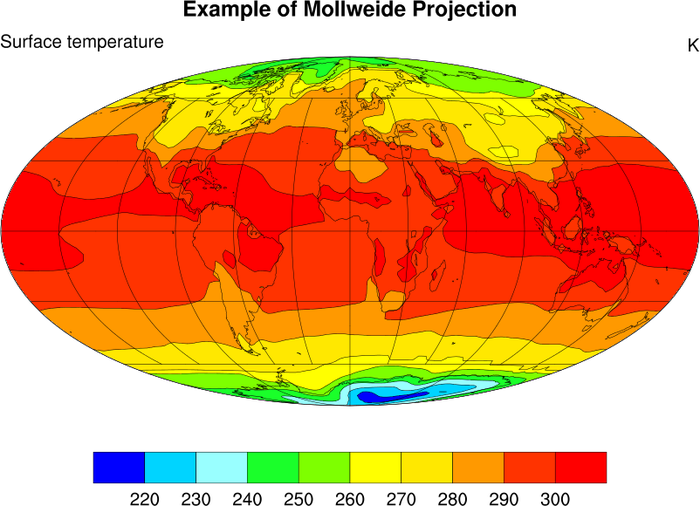
|
Mercator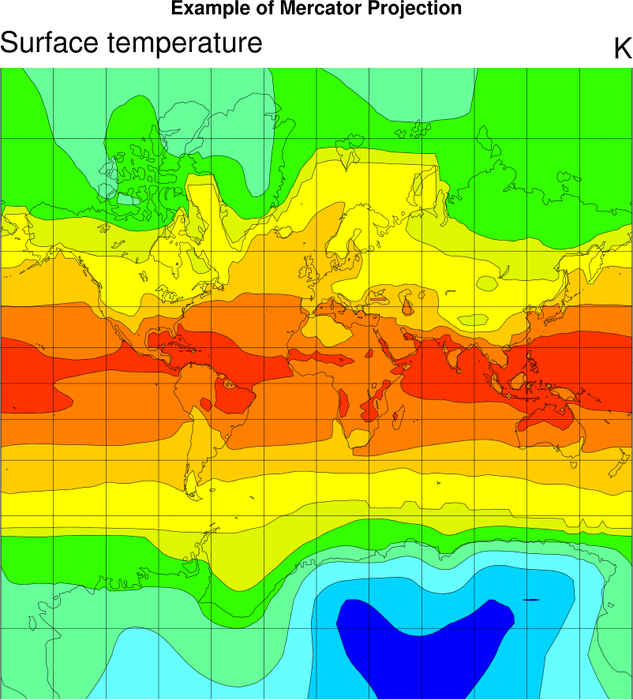
|
Orthographic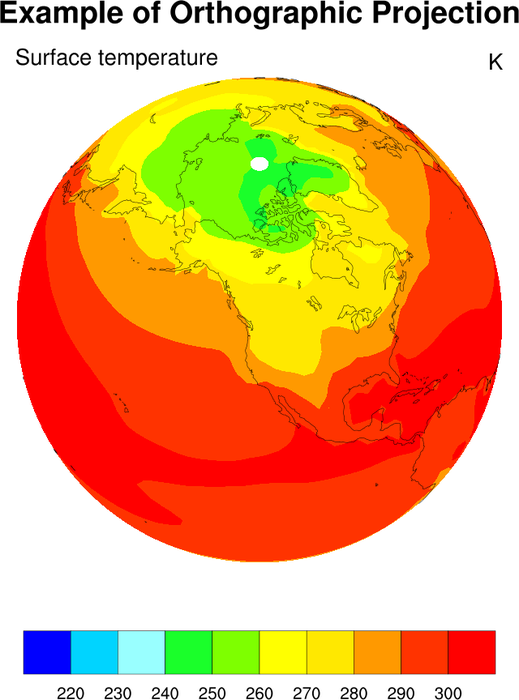
|
Mask Lambert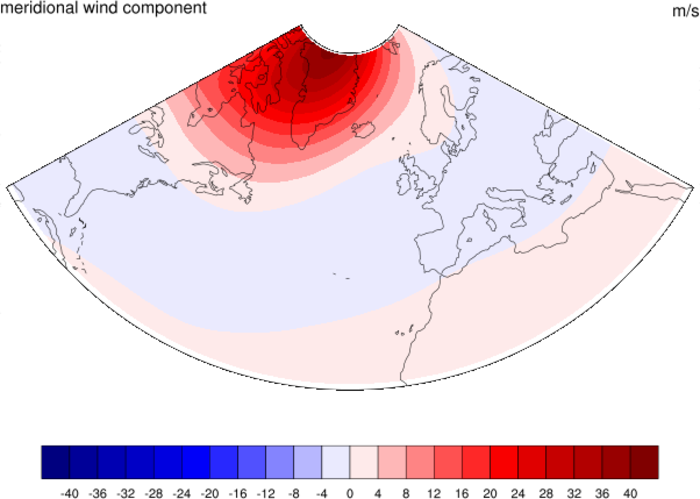
|