Streamline Plot Templates
gsn_csm_streamlinegsn_csm_streamline_contour_map_ce
gsn_csm_streamline_contour_map_polar
Added in NCL V6.3.0:
Example pages containing:
tips |
resources |
functions/procedures
gsn_csm_streamline_contour_map_ce
gsn_csm_streamline_contour_map_polar
Added in NCL V6.3.0:
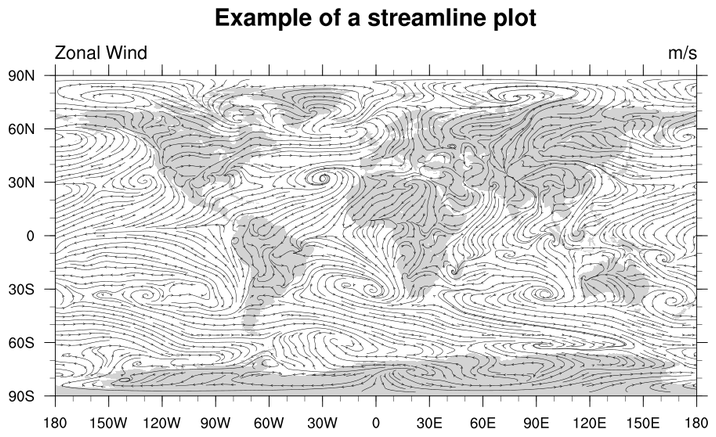
stream_1.ncl:
Default black and white plot.
gsn_csm_streamline_map_ce is the plot interface that draws streamlines on a cylindrical equidistant projection.
A Python version of this projection is available here.
 stream_2.ncl:
Zooms in on a subregion and blows up the streamlines
stream_2.ncl:
Zooms in on a subregion and blows up the streamlines
stArrowLengthF = 0.004, Changes the size of the arrows
stMinArrowSpacingF = 0.004, Changes the arrow spacing
stArrowStride = 3, indicates that arrows are placed every third grid point. The default is 2.
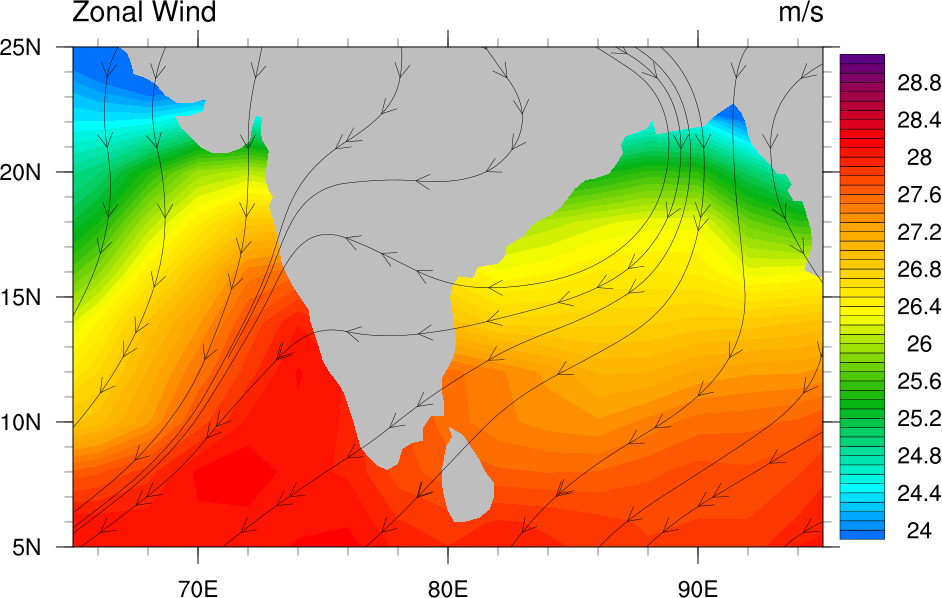
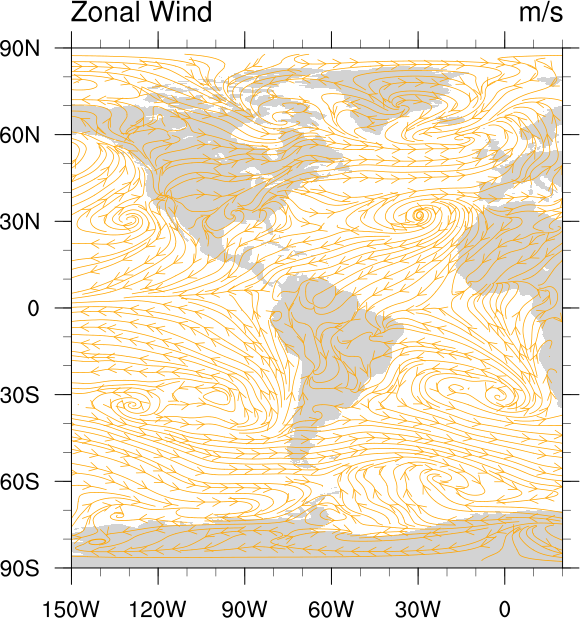 stream_3.ncl:
Zooms in on a subregion and blows up the streamlines.
stream_3.ncl:
Zooms in on a subregion and blows up the streamlines.
stLineThicknessF = 1.5, Changes the line thickness
stLineColor = "orange",changes the streamline color
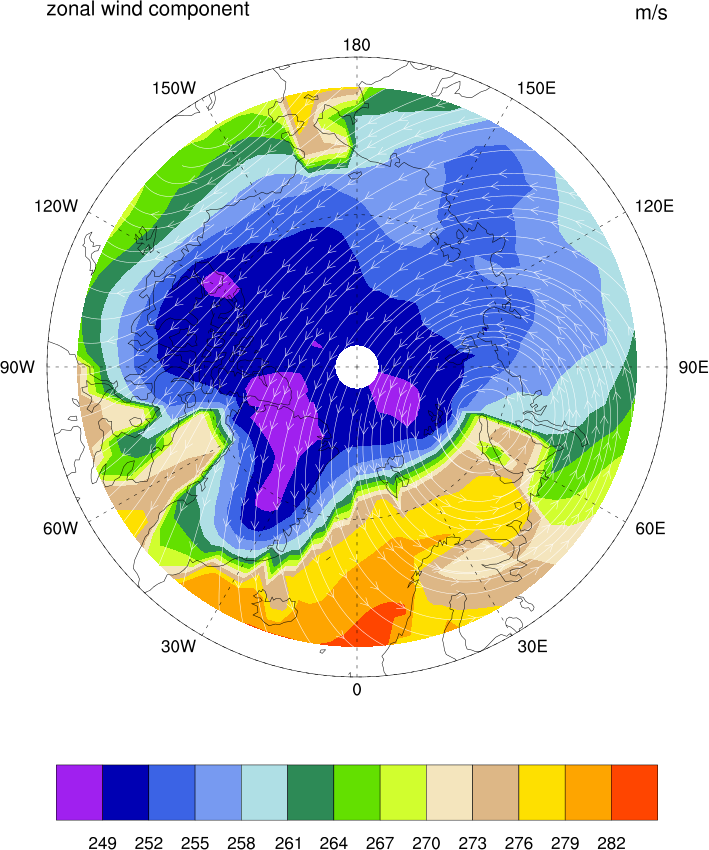
 stream_4.ncl: Example of a polar
streamline plot.
stream_4.ncl: Example of a polar
streamline plot.
gsn_csm_streamline_map_polar is the plot interface that draws a streamline plot over a polar plot.
stArrowLengthF = 0.008,
controls the length of the directional arrows. The default is
dynamic.
stLengthCheckCount = 15,
controls how frequently a new streamline is started. The value is in
terms of an internal NCL loop that calculates new starts. The default
is 35.
stArrowStride = 1, Controls in
which grid cells an arrow head is draw. The default is every other
grid cell.
stLineStartStride = 1,
Controls which grid points are allowed to start new streamlines. The
default is 2, which is every other grid cell.
stMinArrowSpacingF = 0.035,
controls the distance between drawn arrows. The default is 0.0, which
could draw arrows right on top of each other.
stStepSizeF= 0.001, Controls the basic step size used
to create the streamline. The default is dynamic.
The following two resources on the ones that you will really have to tweak depending upon the field you are plotting.
stMinDistanceF = 0.03
stMinLineSpacingF =
0.007,Controls the minimum distance between drawn streamlines. The
default is dynamic.
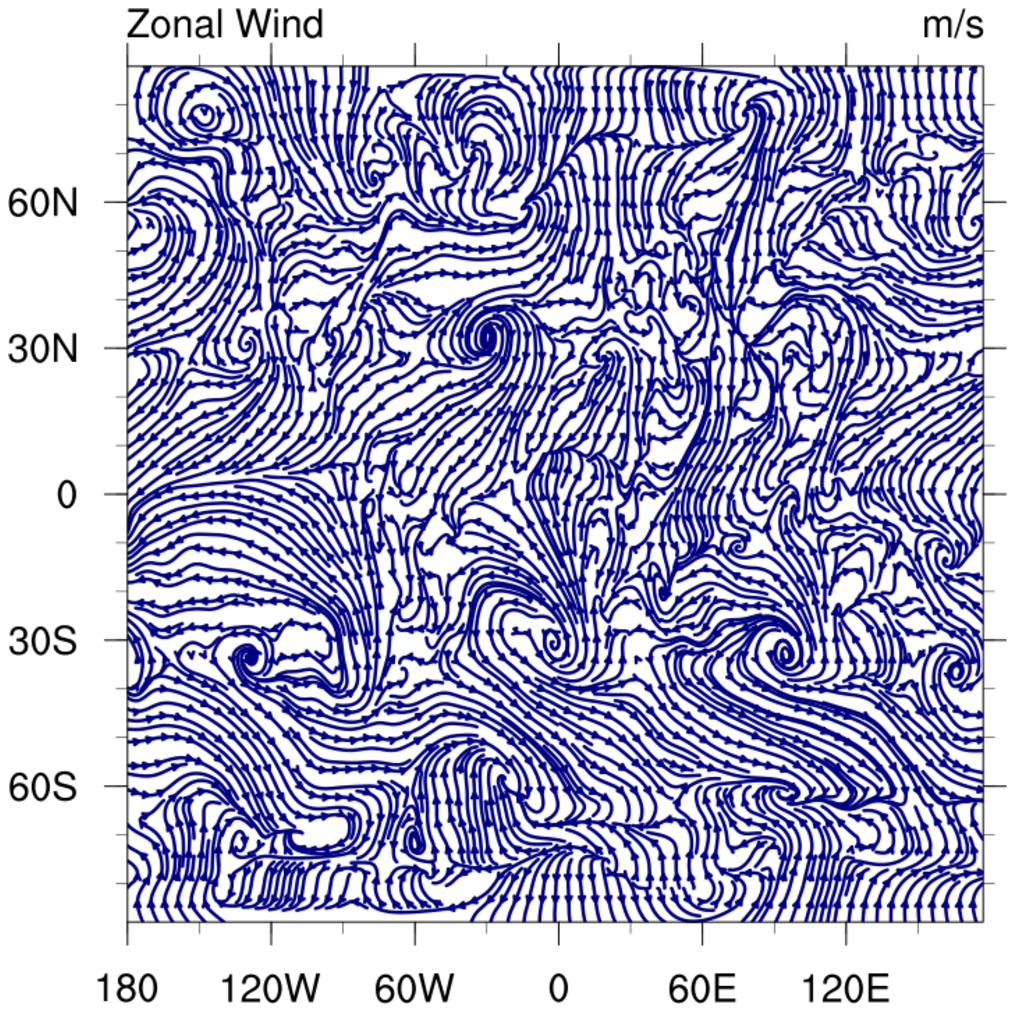 stream_5.ncl: Example of a
streamline plot draw without a map.
stream_5.ncl: Example of a
streamline plot draw without a map.
gsn_csm_streamline is the plot interface that draws a streamline plot without a map.
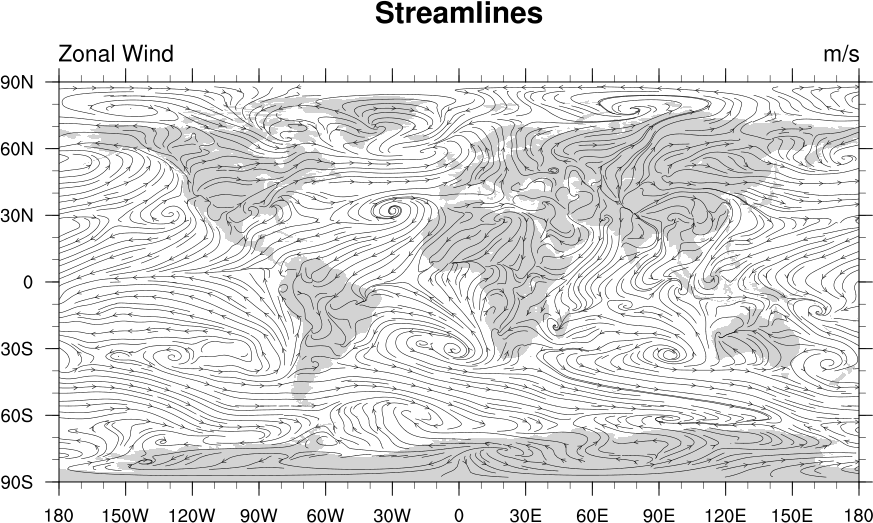
 stream_6.ncl: Example of a streamline
plot drawn over a contour plot with a map
stream_6.ncl: Example of a streamline
plot drawn over a contour plot with a map
gsn_csm_streamline_contour_map_ce is the plot interface that draws a streamline plot over a contour plot.
 stream_7.ncl: Example of a streamline
plot drawn over a contour plot on a polar projection.
stream_7.ncl: Example of a streamline
plot drawn over a contour plot on a polar projection.
gsn_csm_streamline_contour_map_polar is the plot interface that draws a streamline plot over a contour plot with a polar projection.
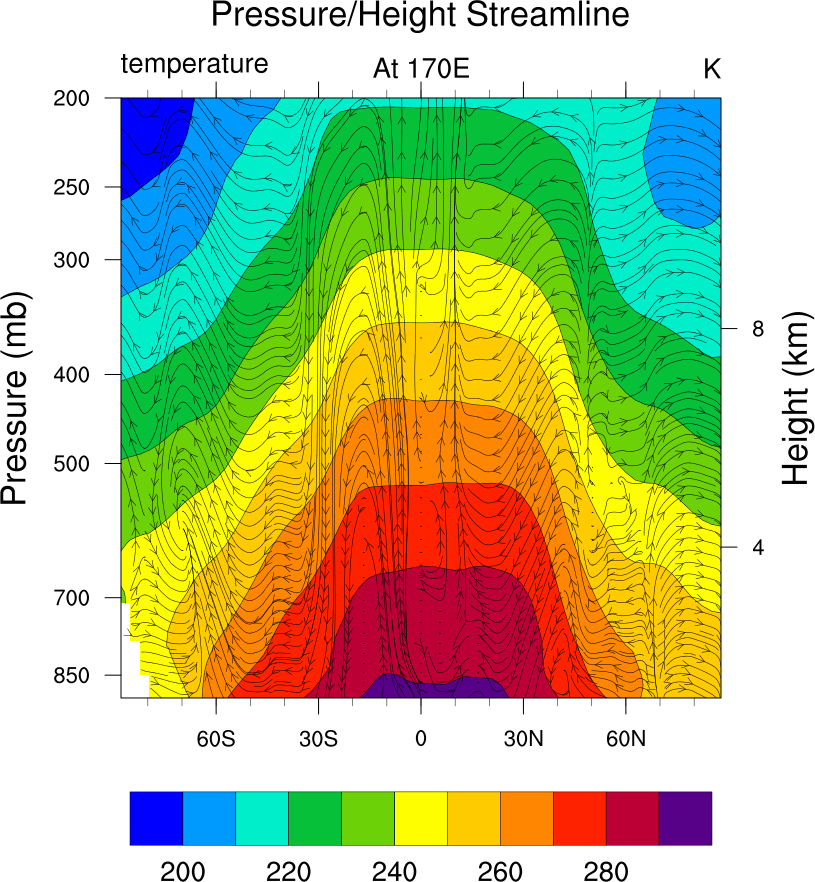
 stream_8.ncl /
stream_overlay_8.ncl:
Shows two different ways to draw a streamline plot over a
pressure/height plot.
stream_8.ncl /
stream_overlay_8.ncl:
Shows two different ways to draw a streamline plot over a
pressure/height plot.
The "stream_8.ncl" script uses a single interface, gsn_csm_pres_hgt_streamline, to draw a streamline plot over a press/height plot.
The "stream_overlay_8.ncl" script uses a 5-step process to create the same plot:
The 5-step process is more work, but can allow you more flexibility if you need to overlay other plots.
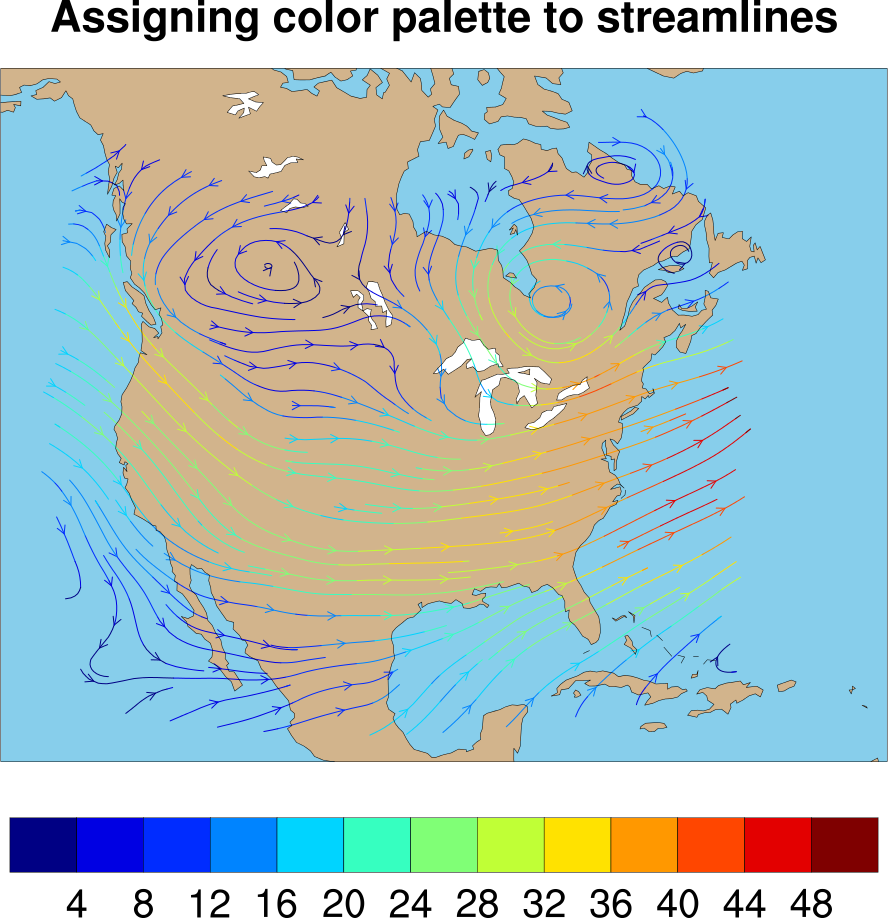
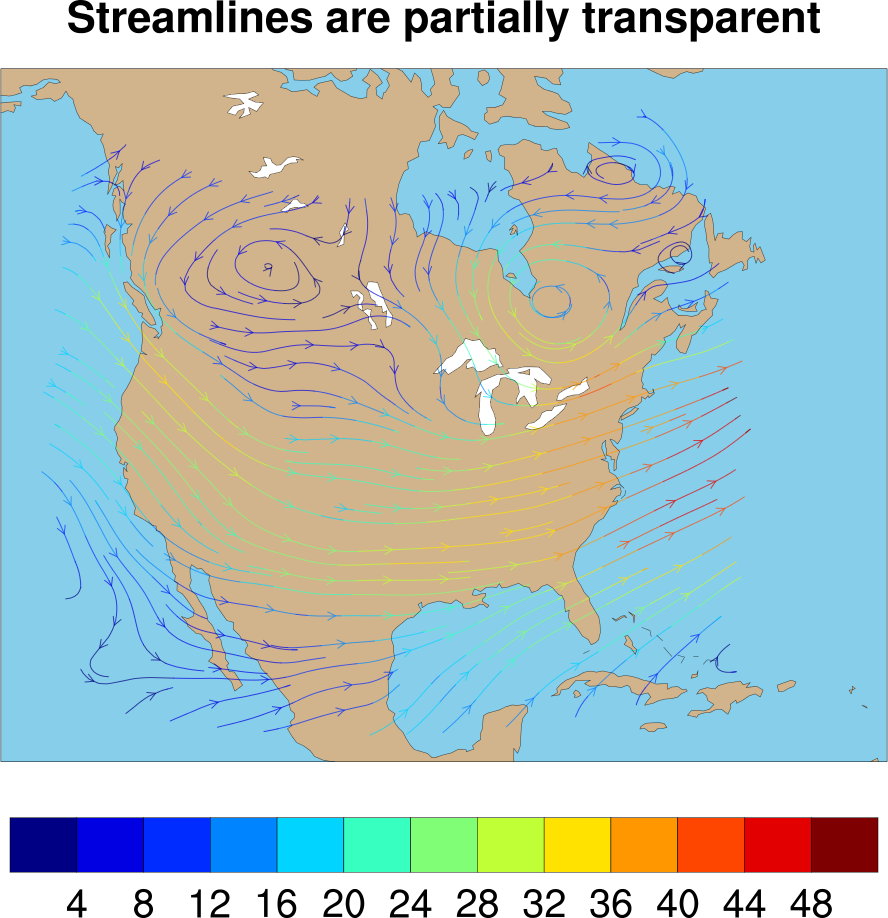 stream_9.ncl: This
example shows how to use new resources added in
NCL V6.1.0
to select a color palette for colored streamlines (first frame)
and to make streamlines partially transparent (second frame).
stream_9.ncl: This
example shows how to use new resources added in
NCL V6.1.0
to select a color palette for colored streamlines (first frame)
and to make streamlines partially transparent (second frame).
stLevelPalette is used to set the color palette to thelix, and stLineOpacityF is used to make the streamlines partially transparent.
A Python version of this projection is available here.
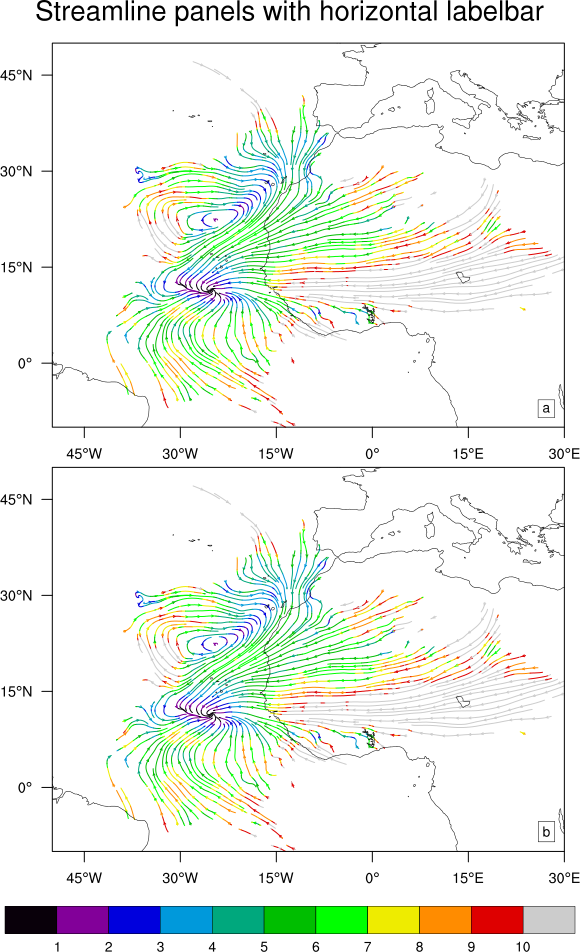
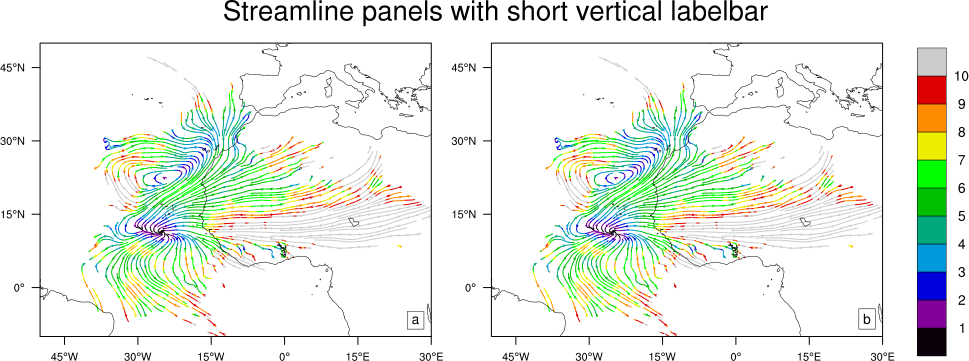
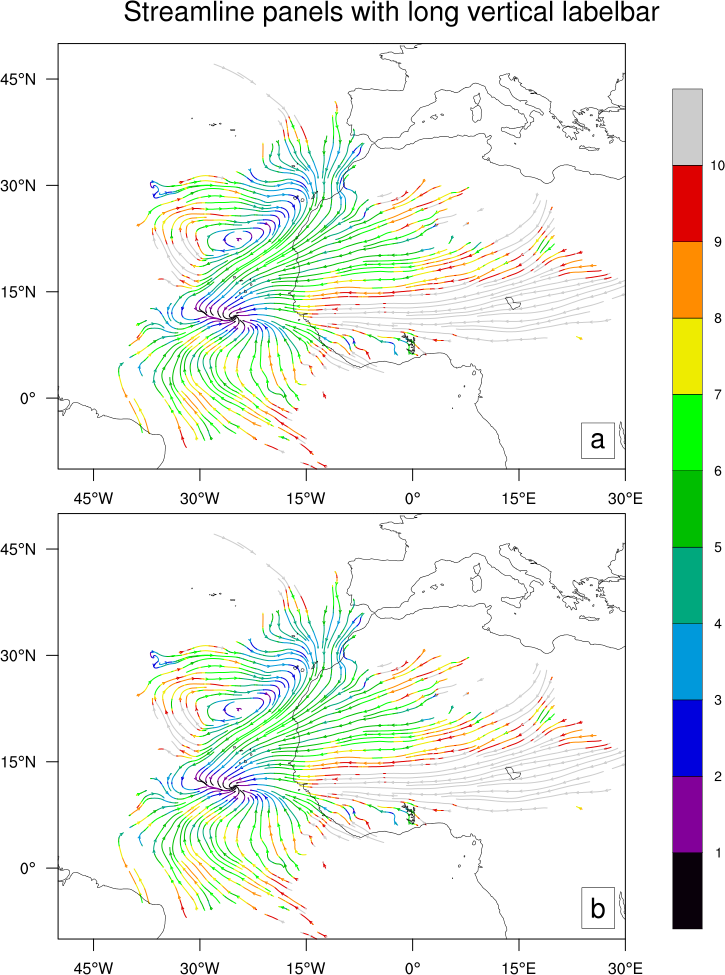 stream_10.ncl: This example shows
how to panel colored streamlines plots with a common labelbar. There
are three plots: 1) a panel plot with the default horizontal labelbar,
2) a panel with two plots in one row and a vertical labelbar,
3) a panel with two plots in a column and a longer vertical labelbar.
stream_10.ncl: This example shows
how to panel colored streamlines plots with a common labelbar. There
are three plots: 1) a panel plot with the default horizontal labelbar,
2) a panel with two plots in one row and a vertical labelbar,
3) a panel with two plots in a column and a longer vertical labelbar.
Alan Brammer of the University at Albany contributed the initial version of this example and the code necessary to get gsn_panel to recognize streamline plots and create a labelbar.
Note: you need NCL version 6.3.0 to run this example.
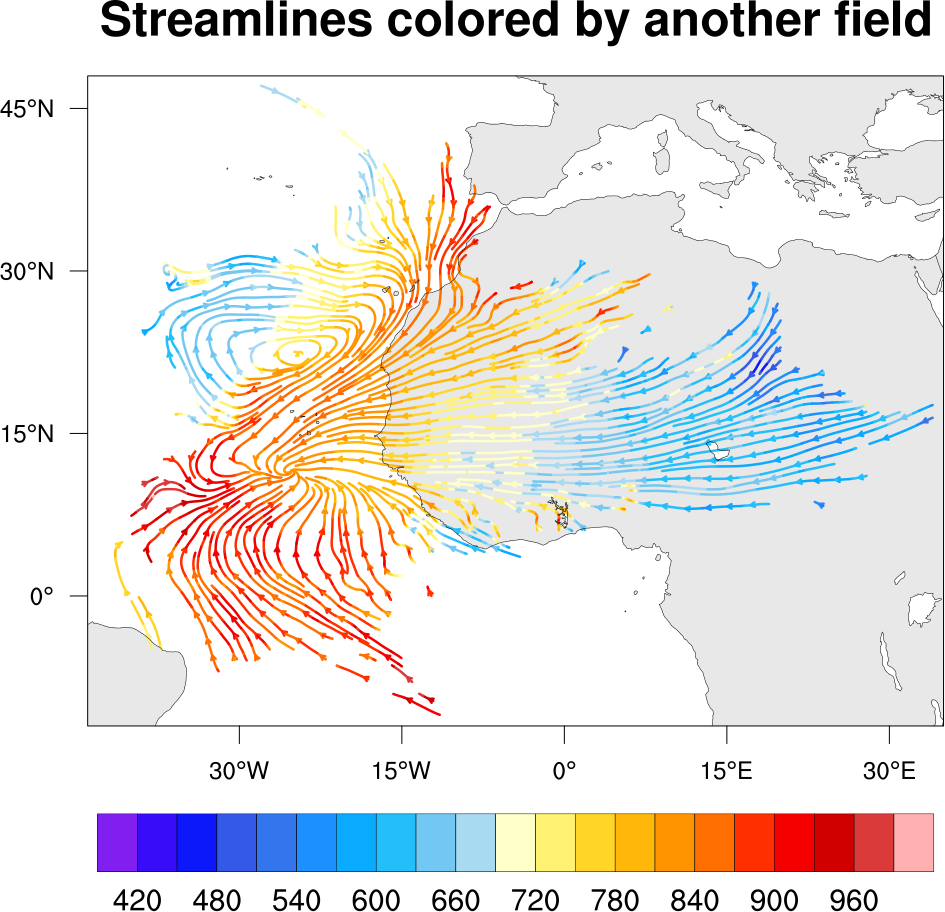 stream_11.ncl: This example shows
how to use gsn_csm_streamline_scalar_map to
color streamlines based on another field.
stream_11.ncl: This example shows
how to use gsn_csm_streamline_scalar_map to
color streamlines based on another field.
Alan Brammer of the University at Albany contributed the initial version of this example and contributed the gsn_csm_streamline_scalar_xxx functions which we added to NCL Version 6.3.0.