NCL Home>
Application examples>
gsn_csm graphical interfaces ||
Data files for some examples
Example pages containing:
tips |
resources |
functions/procedures
NCL Graphics: Vectors (high-level graphical interfaces)
Vector Plot Templates
gsn_csm_vector
gsn_csm_vector_map
gsn_csm_vector_scalar_map
gsn_csm_vector_map_polar
gsn_csm_vector_scalar_map_polar
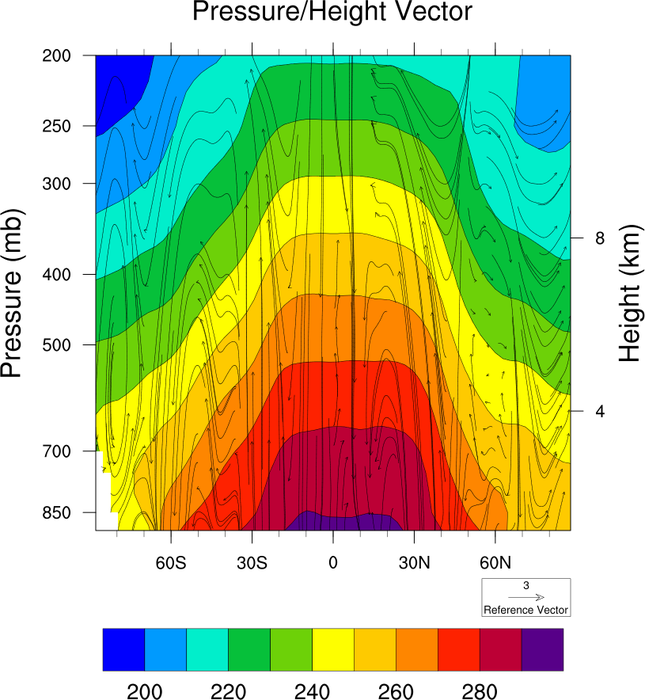
gsn_csm_pres_hgt_vector
Additional Examples:
Important resources for controlling the length, density, direction, and style of vectors:
- vcGlyphStyle - "LineArrow"
(default), "FillArrow", "WindBarb", "CurlyVector"
- vcMapDirection - set to False
if you have a situation where the two coordinate axes have different
units with very different numerical spacing between the coordinate
values. Usually, you want this resource to be set to True for
vectors drawn over a map, but if the lat/lon values have very different spacings,
then you may want to set this to False.
- vcMinDistanceF - set to small
value to thin the vectors.
- Use these four resources to control the length of vectors:
-
Use the vcLineArrowThicknessF to
make the vectors thicker.
You can find more information about vector plots on the
vector effects page.
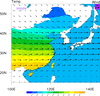
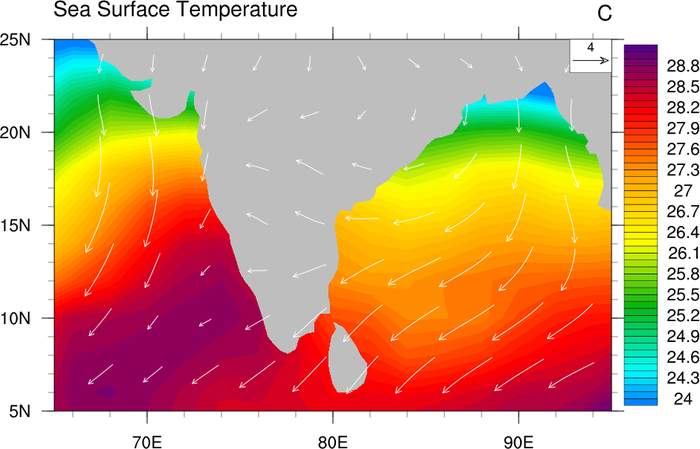
 vector_1.ncl
: Creates a vector plot
over SST contours.
gsnScalarContour = True,
means that a scalar contour plot will also be drawn. The default is
False, which colors the vectors by the scalar map (see example 4).
vcRefMagnitudeF = 5.0, Defines the
reference vector magnitude. Use this to adjust the size of the
vectors.
vcRefLengthF = 0.045, Defines the
length of the reference vector.
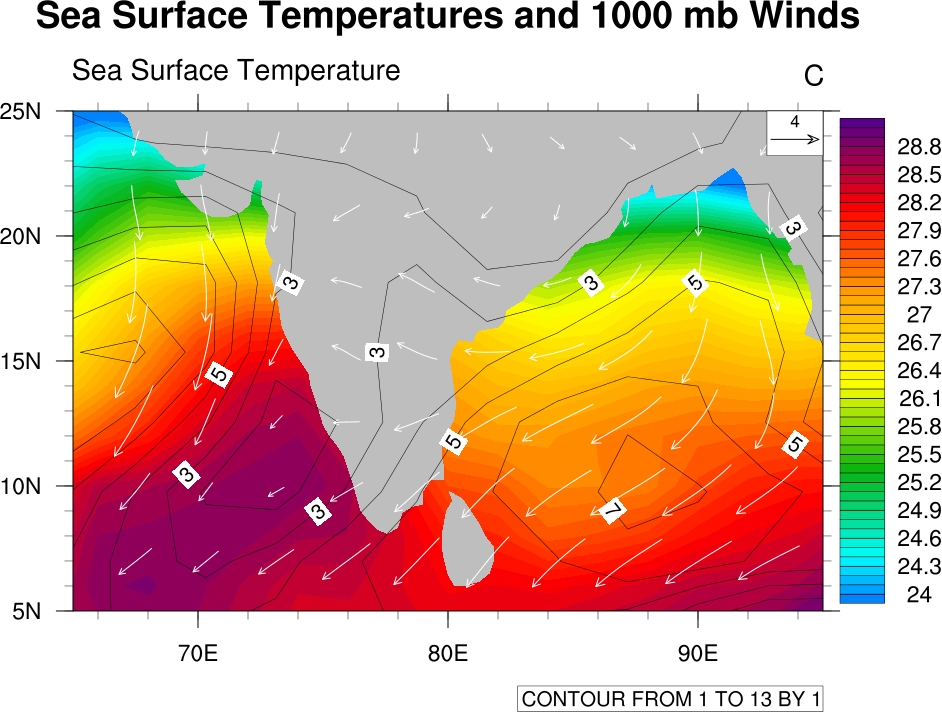
gsn_csm_vector_scalar_map is the
plot interface that draws a vector plot over a scalar contour plot.
cnLinesOn = False, Turns off the
contour lines.
cnLineLabelsOn = False, Turns off
the contour line labels.
vcGlyphStyle = "CurlyVector",
Turns on the curly vectors.
A Python version of this projection is available here.
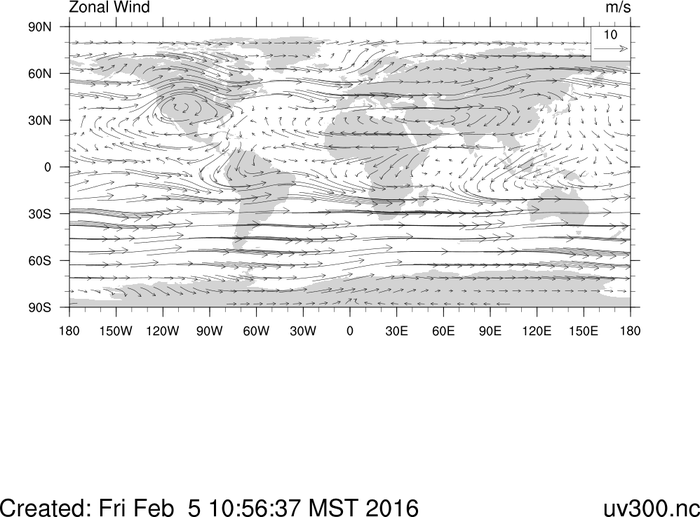
 vector_3.ncl
: Draw vectors on a
global map with a time stamp at the bottom.
gsn_csm_vector_map is the plot interface that draws
vectors over a map.
vcMinDistanceF = 0.017, Thins the
vectors.
vcRefAnnoOrthogonalPosF = -1.0,
Moves the reference vector up.
infoTimeStamp is a
utility for creating a time stamp at the bottom of the figure. The
arguments are the workstation, the size of the text, and the right
string. The left string is automatically generated and includes the
time and date of the plots' creation.
A Python version of this projection is available here.
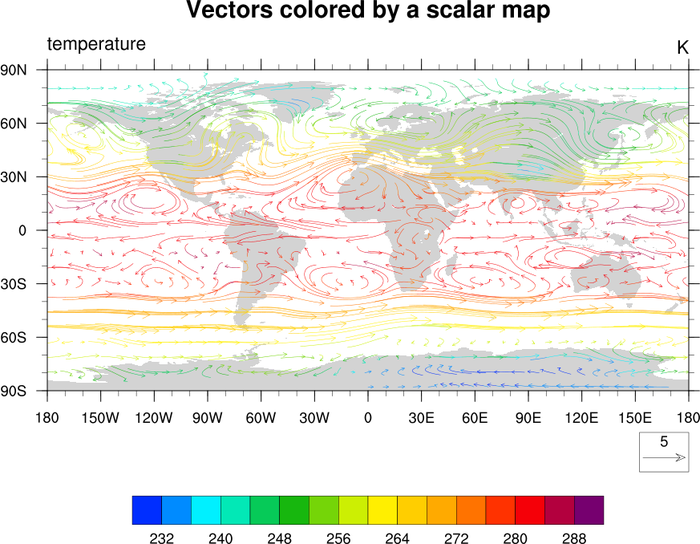
 vector_4.ncl
: Color vectors by
a scalar field.
A Python version of this projection is available here.

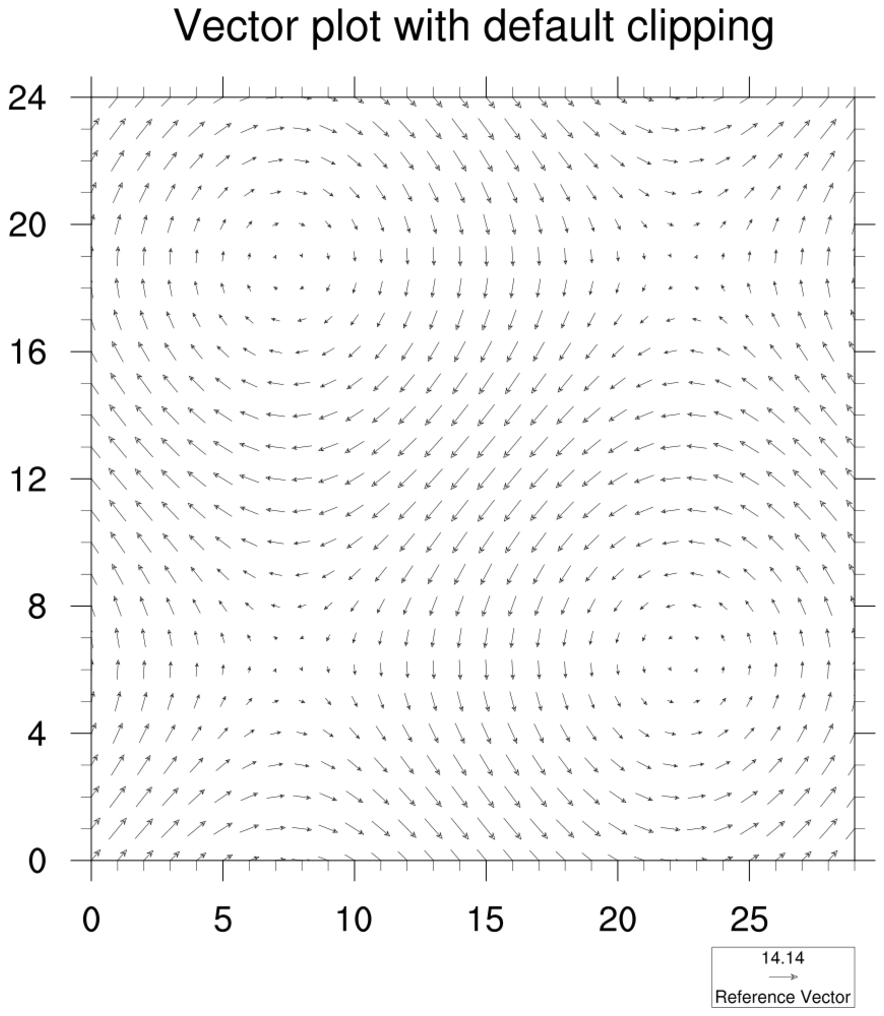
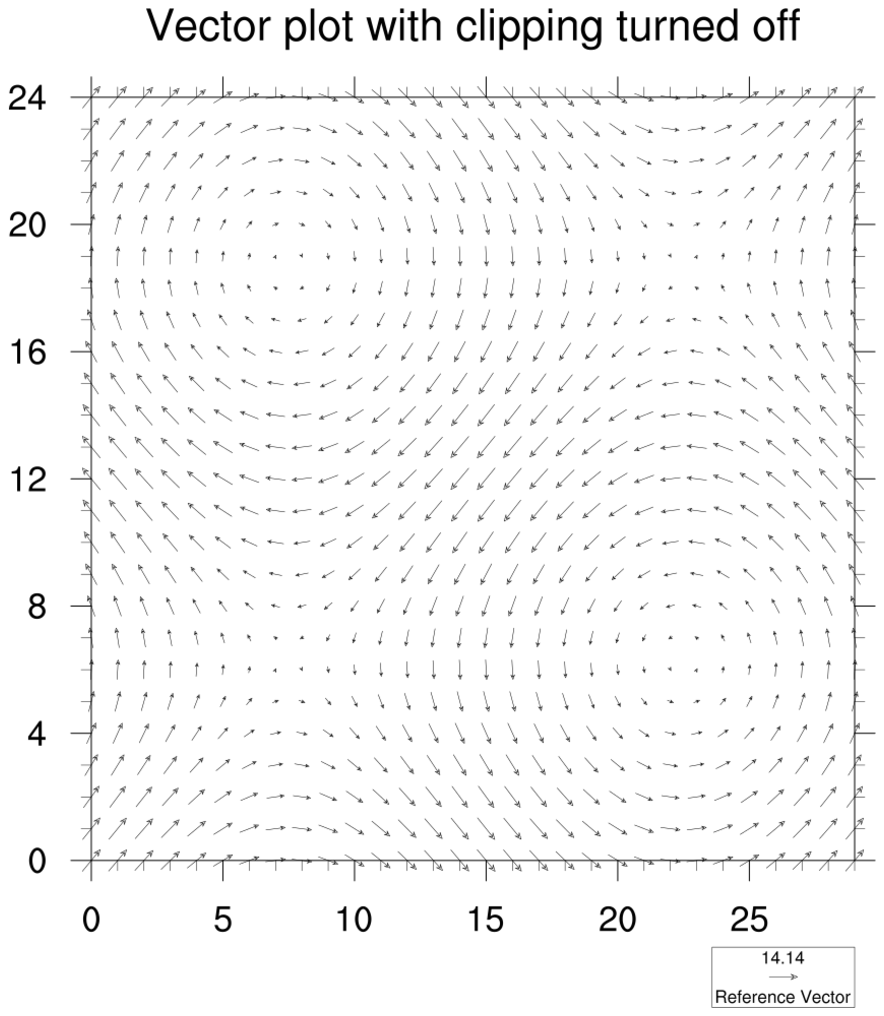
 vector_6.ncl
: Draws vectors with
with automatic default clipping, and then with clipping turned off.
To turn off vector clipping, set the resource vpClipOn to False.
This example also shows how to change the thickness of the vectors.
This is done by setting the vcLineArrowThicknessF
resource to the desired multiple of default thickness. For example, setting
it to 2.5 makes the vectors two-and-a-half times as thick.
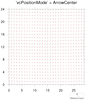
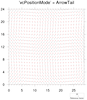
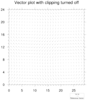
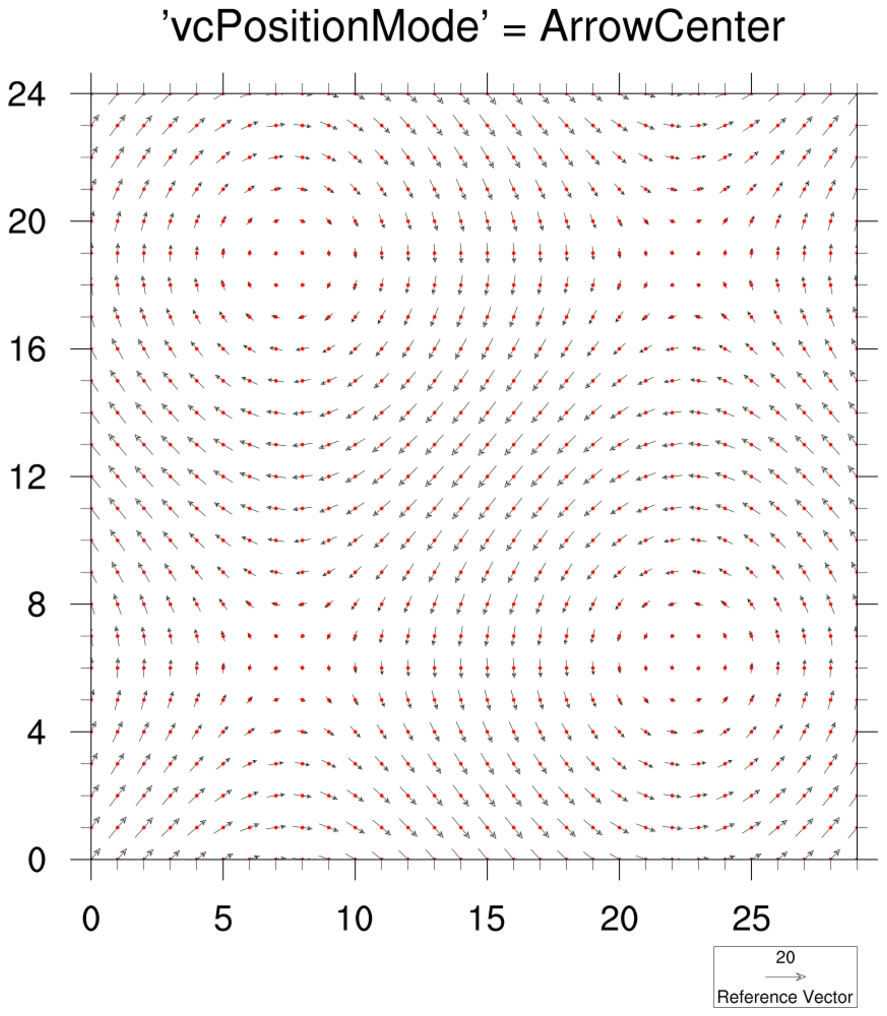
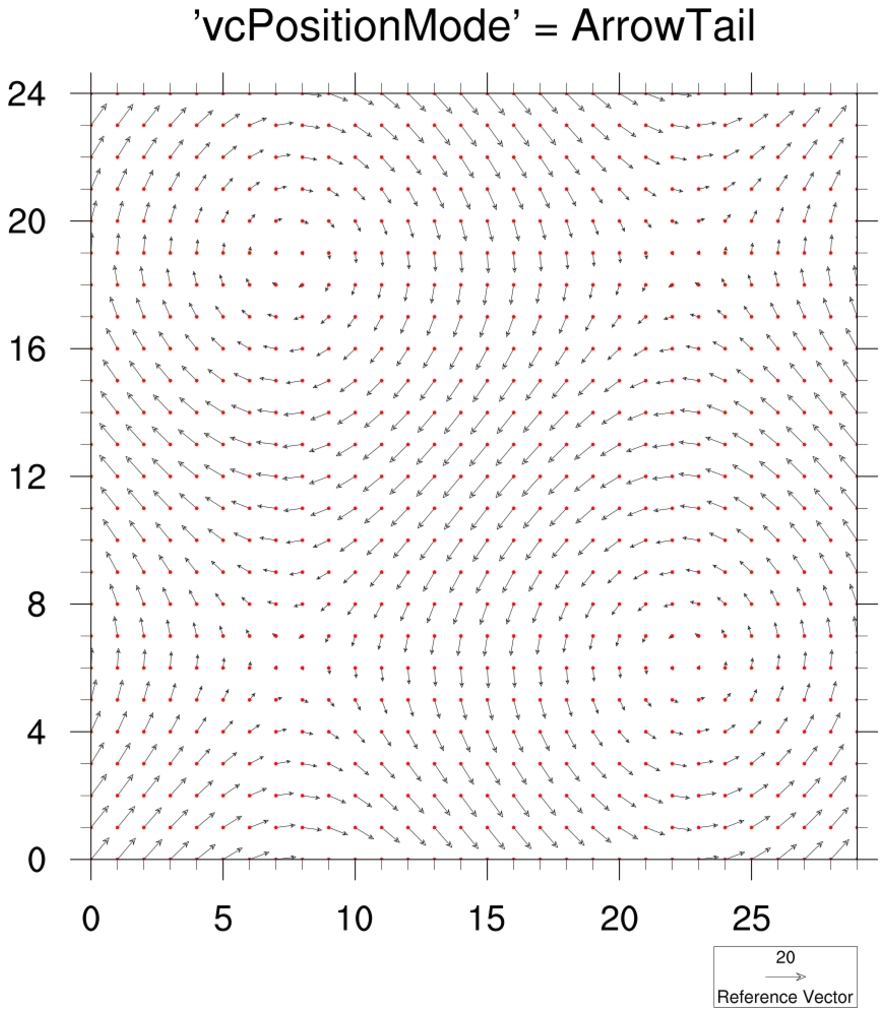
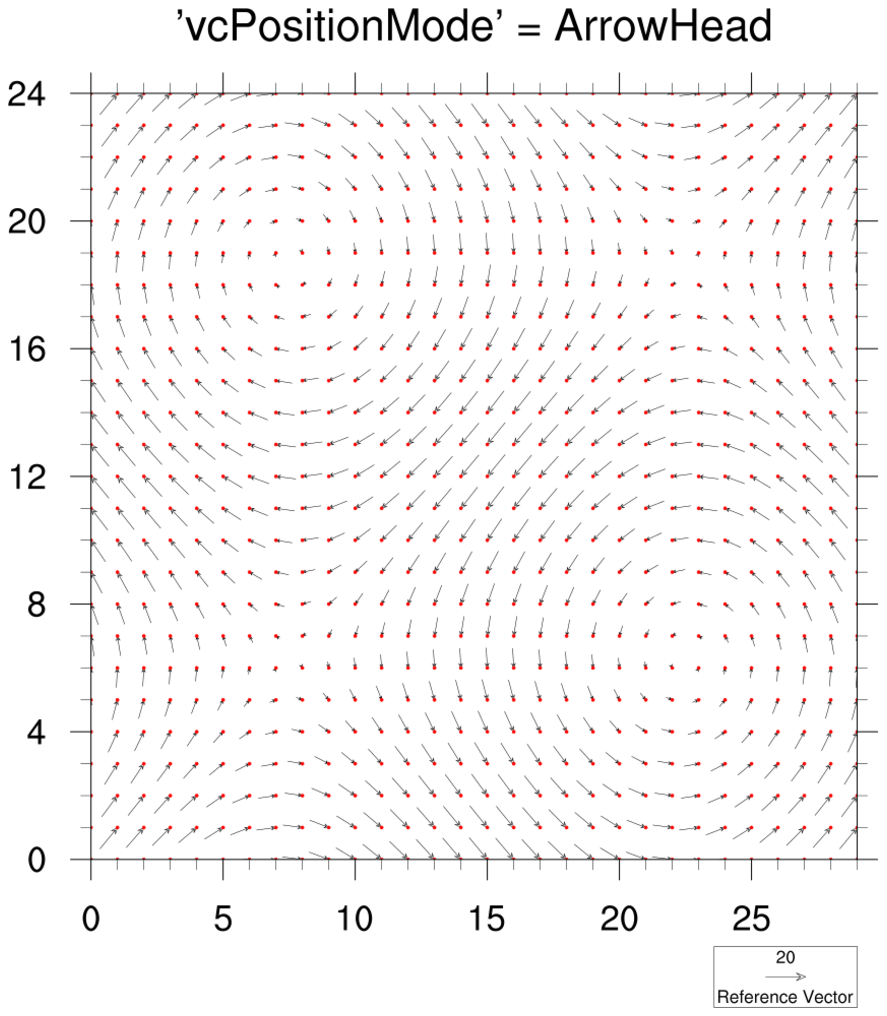
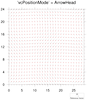 vector_7.ncl
: This example shows
how to position the vector arrows differently using the
resource
vcPositionMode. The
default is "ArrowCenter". You can also use "ArrowHead" or
"ArrowTail".
Polymarkers are added to each plot
using gsn_add_polymarker
so you
can see locations of the vector coordinates.
Like vector_6.ncl, this example shows
how to adjust the vector thickness.
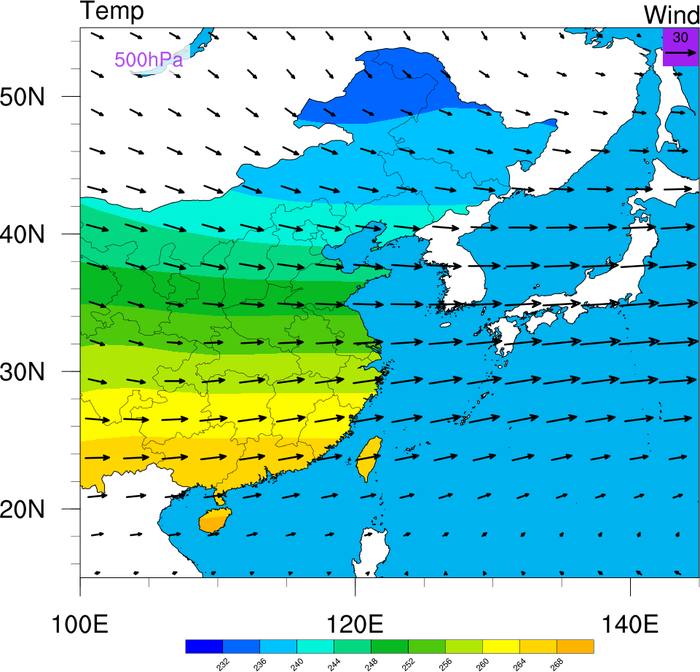
 overlay_11.ncl
:
This example shows how to overlay vectors on top of a filled contour plot,
where the contours are masked by a geographical area and the vectors
are not. The masking is accomplished by setting:
  mpres@mpDataBaseVersion   = "MediumRes"
  mpres@mpMaskAreaSpecifiers = (/"China:states","Taiwan"/)
The mask area specifier names are part of the
predefined group
names available in the "MediumRes" map database.
This script was written by Yang Zhao (CAMS) (Chinese Academy of
Meteorological Sciences).
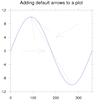
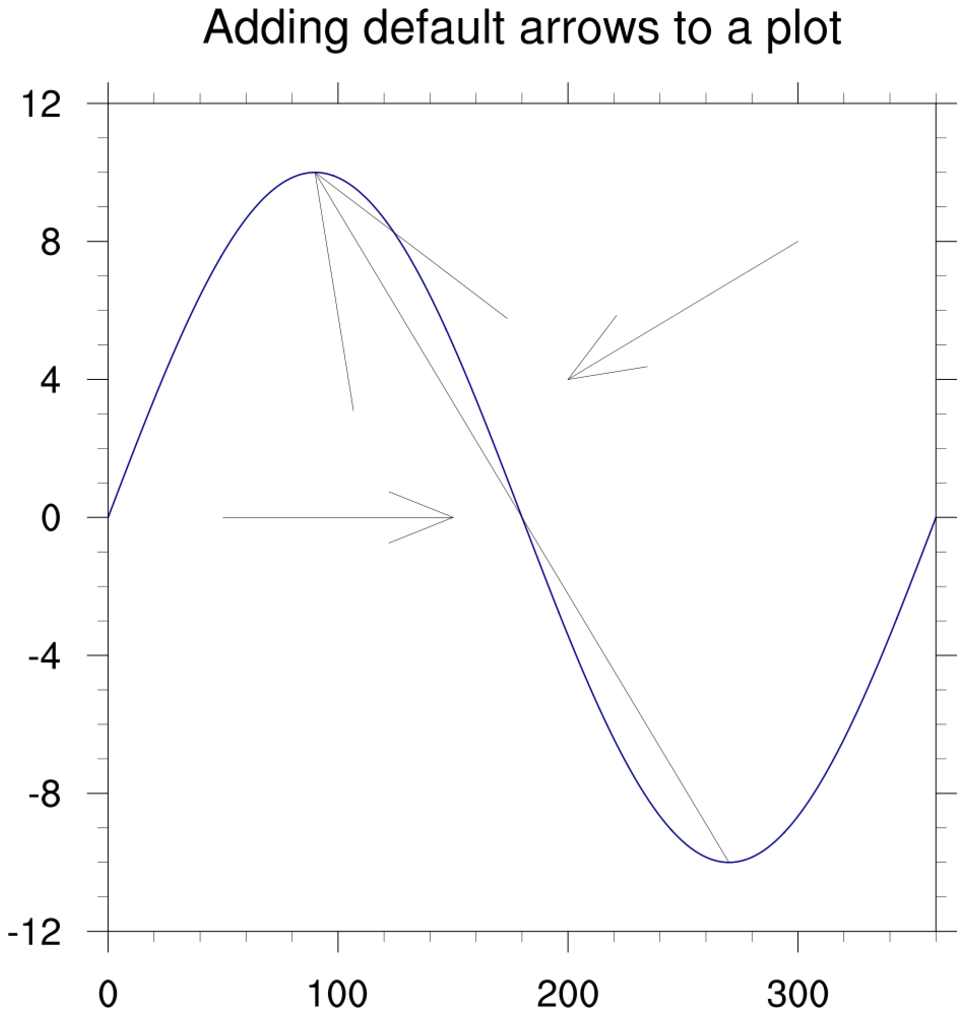
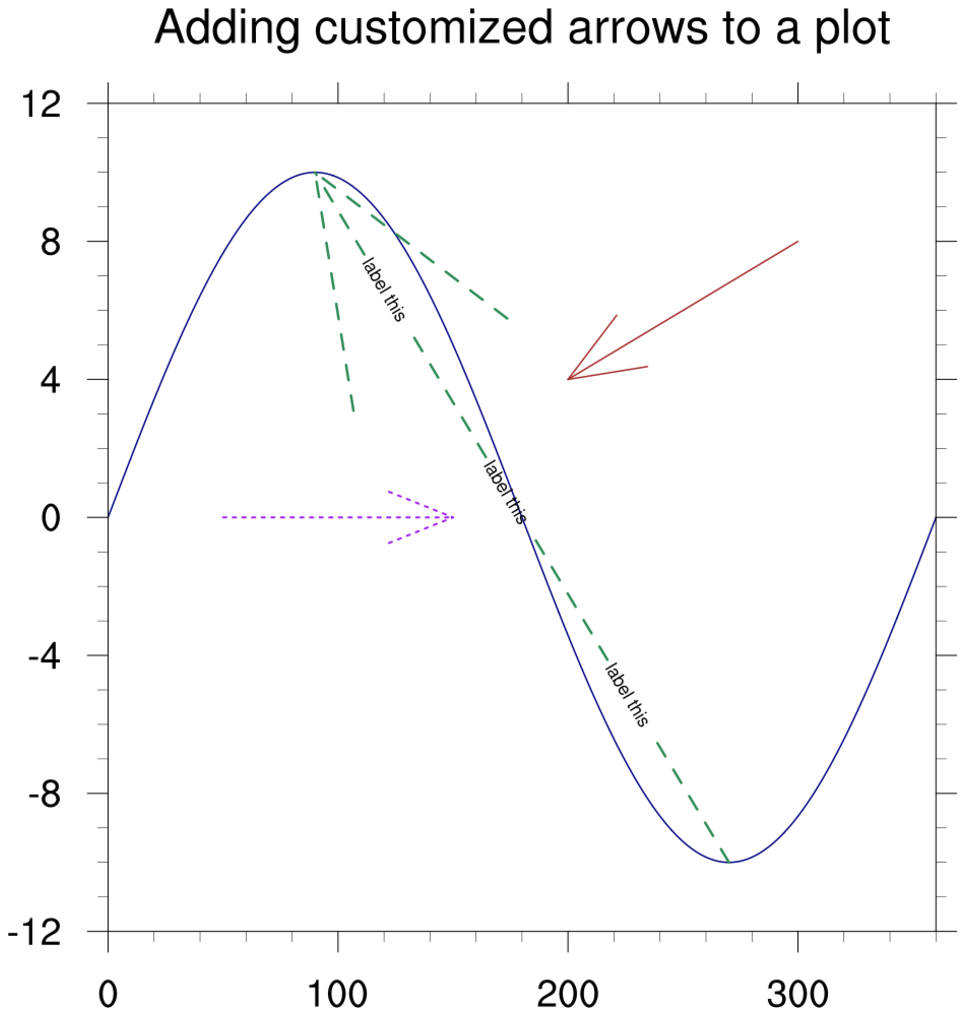
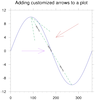 polyg_23.ncl
: This script shows how
to add single vectors (arrows) to a plot, using an "arrow" function
contributed by Arindam Chakraborty.
This function uses
gsn_add_polyline under the hood,
which means you can
use gsLineXXXX
resources to customize the arrows.
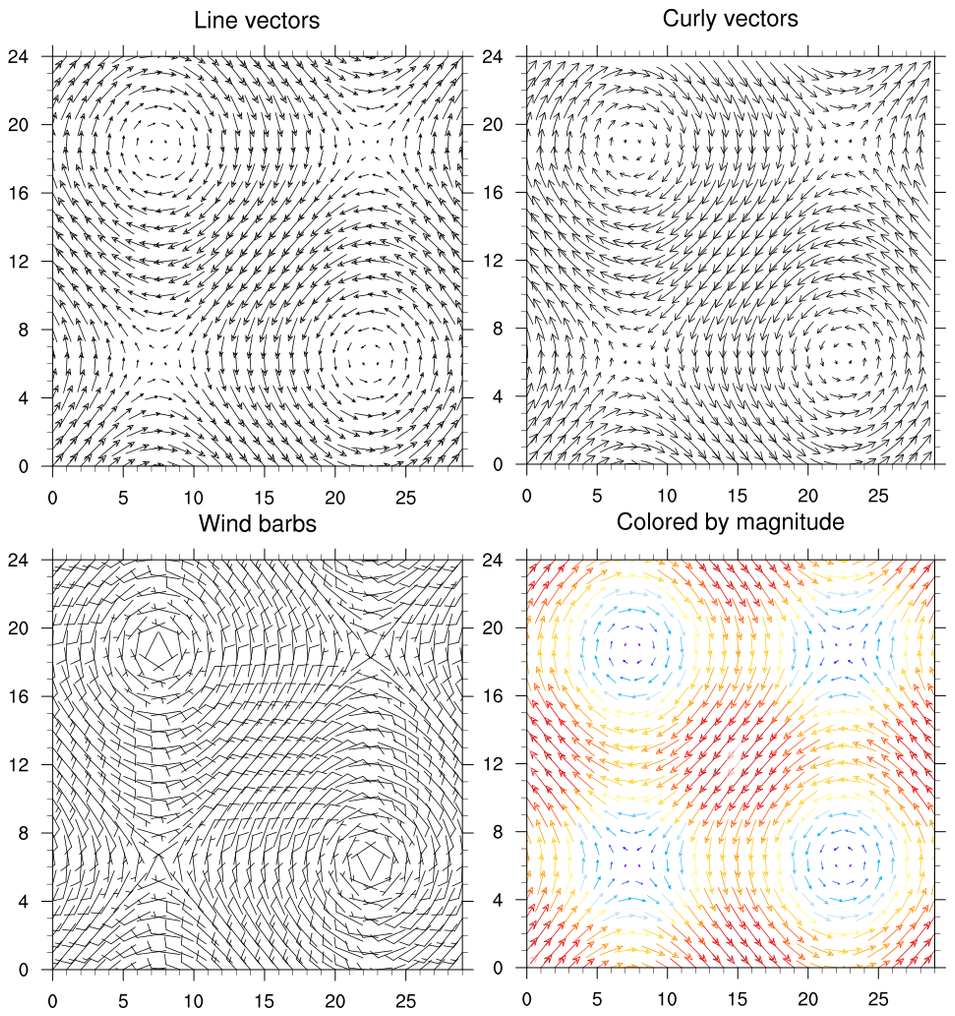
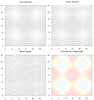 vector_8.ncl
: This example
shows how to draw three types of vectors: line vectors, curly vectors,
and wind barb vectors, and how to color the vectors based on magnitude.
Use the
vcGlyphStyle resource to
change the type of the vectors being drawn. To color the vectors
based on magnitude, set
vcMonoLineArrowColor to False.
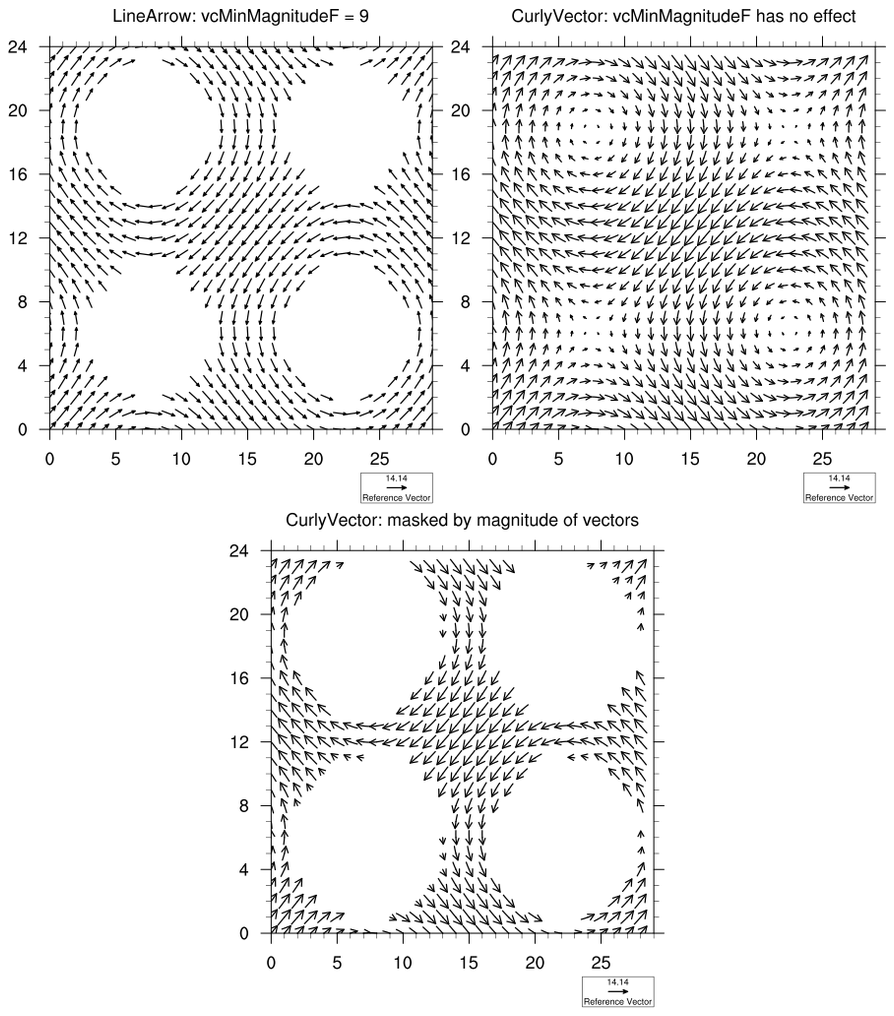
 vector_9.ncl
: This example
shows how setting
vcMinMagnitudeF has no
effect on curly vectors; one way you can reduce the magnitude is by using the
where function.