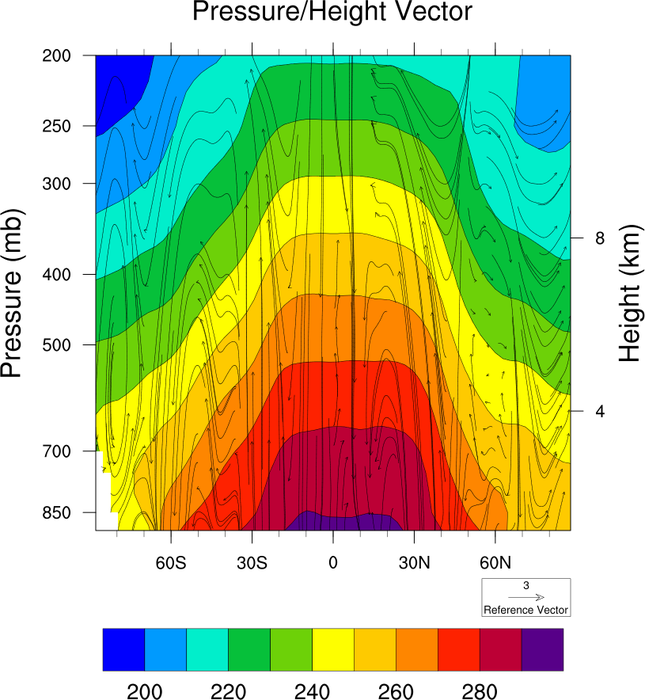
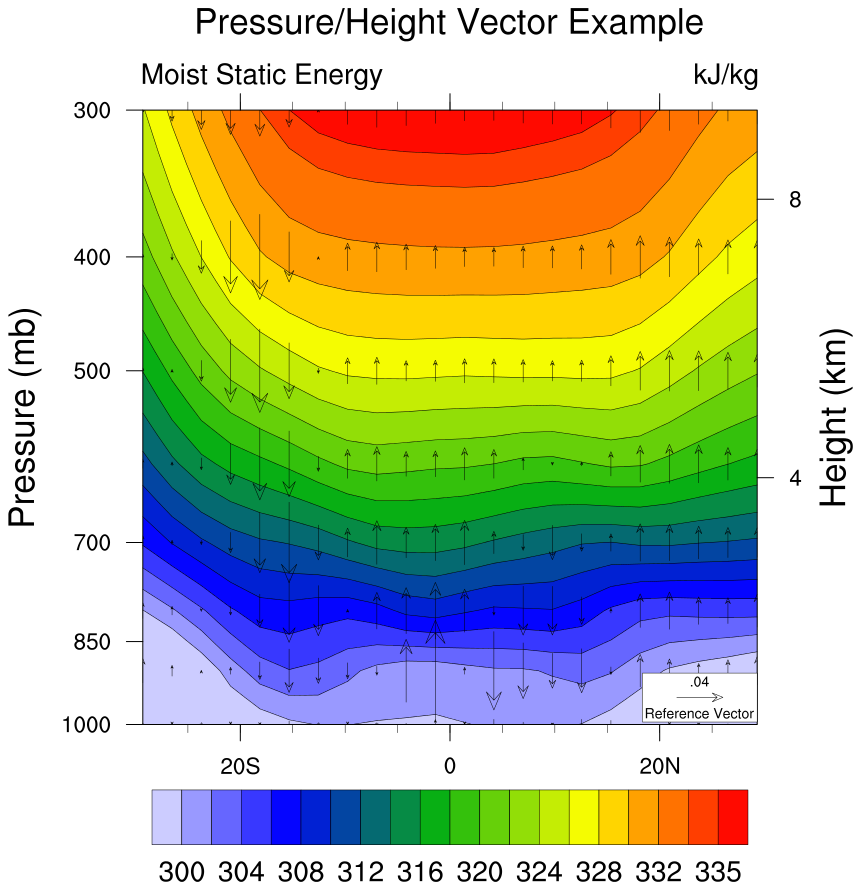
gsn_csm_pres_hgt_vector
Creates and draws a pressure/height contour plot overlaid with vectors.
Prototype
load "$NCARG_ROOT/lib/ncarg/nclscripts/csm/gsn_code.ncl"  ; These two libraries are automatically
load "$NCARG_ROOT/lib/ncarg/nclscripts/csm/gsn_csm.ncl"   ; loaded from NCL V6.2.0 onward.
                                                          ; No need for user to explicitly load.

	function gsn_csm_pres_hgt_vector (
		wks      [1] : graphic,
		data  [*][*] : numeric,
		xcomp [*][*] : numeric,
		zcomp [*][*] : numeric,
		res      [1] : logical
	)

	return_val [1] :  graphic
Arguments
wksA Workstation identifier. The identifier is one returned either from calling gsn_open_wks or calling create to create a Workstation object.
dataThe two-dimensional data to contour. The leftmost dimension must contain a one-dimensional coordinate array of pressure values, and the values must be in the correct units. This is determined by examining the "units" attribute of the coordinate variable. Some accepted units are "hpa", "hPa", "Pa", "pa", "mb", "millibars", etc. If the units attribute doesn't exist or has the wrong value, an error will be issued.
xcompzcomp
The data for the vector plot; must be two-dimensional.
resA variable containing an optional list of plot resources, attached as attributes. Set to True if you want the attached attributes to be applied, and False if you either don't have any resources to set, or you don't want the resources applied.
Return value
A scalar id of the vector plot created is returned. The id of the vector data object is returned as an attribute called vfdata, and the id of the scalar data object is returned as an attribute called sfdata. If a separate contour plot is created, then an attribute called contour is also returned. These ids are useful if you want to use setvalues to change some data or plot options after this function has been called.
Description
This function creates and draws a pressure/height contour plot with vectors overlaid.
xcomp usually refers to either the east-west (e.g. u) or north-south (e.g. v) component of the horizontal wind. If the plot is a pressure-longitude plot then xcomp refers to the east-west wind component (u). In this case the bottom (x-axis) is labeled with longitude labels (e.g. 90E) if a longitude coordinate array exists. If the plot is a pressure-latitude plot then xcomp refers to the north-south wind component (v). In this case the bottom (x-axis) is labeled with latitude labels (e.g. 30N) if a latitude coordinate array exists.
The left Y-axis will be labeled with reverse log pressure values, and the right Y-axis with height values in km. The height values are a logarithmic interpolation from Standard Atmosphere of the pressure array. The pressure coordinate array values must lie between 1013.25 mb and 0.010 mb.
Important note: by default, NCL maps the vector direction into the underlying coordinate space. This works well when drawing vectors on a map projection, but for vertical plots where the two coordinate axes have different units that have very different numerical spacing between the coordinate values, it leads to distortion. If you are seeing this issue, try setting the resource vcMapDirection to False. This resource now defaults to False for this function in NCL V6.2.0.
To turn off the "height" title on the right Y axis, set the special gsnPresHgtHeightLabelOn resource to False.
If xcomp, zcomp, or data have a _FillValue attribute, these values will be used as missing values.
If the resource vcMonoLineArrowColor is set to False, then a labelbar is created. If you want to turn the labelbar off, set lbLabelBarOn to False.
If xcomp has an attribute called "long_name", and gsnLeftString hasn't explicitly been set, then the value of this attribute is used for the left string title.
If xcomp has an attribute called "units", and gsnRightString hasn't explicitly been set, then the value of this attribute is used for the right string title.
To maximize the area that the plot is drawn in, set the special resource gsnMaximize to True.
See Also
gsn_csm_vector_scalar,
gsn_csm_pres_hgt,
gsn_csm_pres_hgt_streamline
Special gsn resources
Examples
For some application examples, see: