gsn_csm_vector_scalar
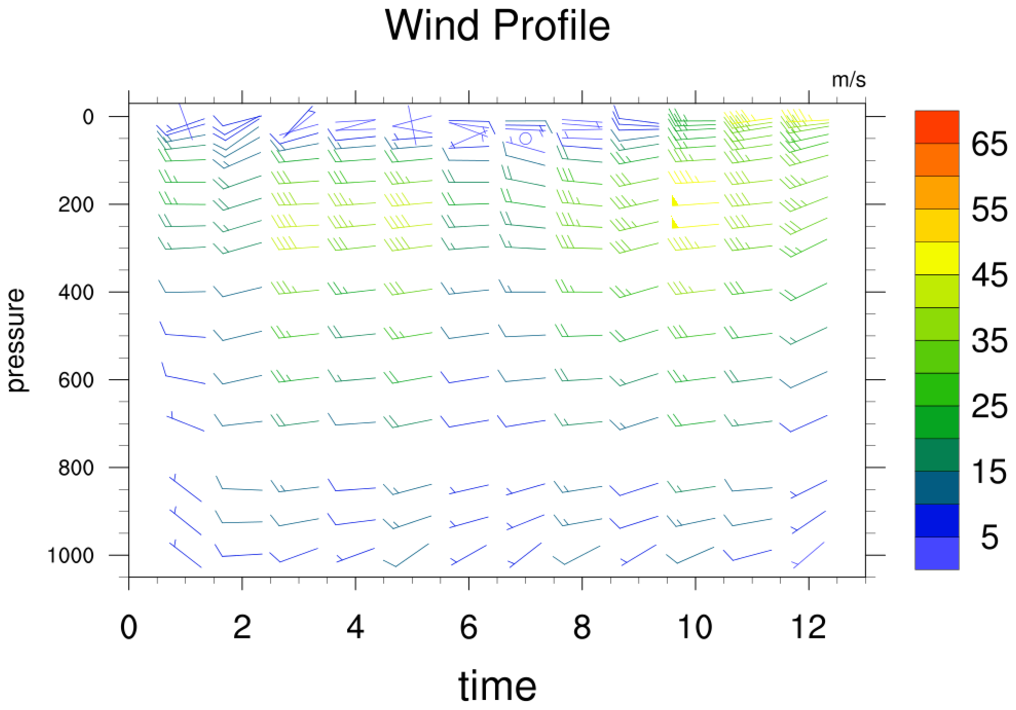
Creates and draws a vector plot, and uses a scalar field to draw a separate contour plot or color the vectors.
Prototype
load "$NCARG_ROOT/lib/ncarg/nclscripts/csm/gsn_code.ncl"  ; These two libraries are automatically
load "$NCARG_ROOT/lib/ncarg/nclscripts/csm/gsn_csm.ncl"   ; loaded from NCL V6.2.0 onward.
                                                          ; No need for user to explicitly load.

	function gsn_csm_vector_scalar (
		wks     [1] : graphic,
		u    [*][*] : numeric,
		v    [*][*] : numeric,
		data [*][*] : numeric,
		res     [1] : logical
	)

	return_val [1] :  graphic
Arguments
wksA Workstation identifier. The identifier is one returned either from calling gsn_open_wks or calling create to create a Workstation object.
uv
The u and v data for the vector plot; must be two-dimensional.
dataThe data for which to create a separate contour plot or color the vectors by; must be two-dimensional.
resA variable containing an optional list of plot resources, attached as attributes. Set to True if you want the attached attributes to be applied, and False if you either don't have any resources to set, or you don't want the resources applied.
Return value
A scalar id of the vector plot created is returned. The id of the vector data object is returned as an attribute called vfdata, and the id of the scalar data object is returned as an attribute called sfdata. If a separate contour plot is created, then an attribute called contour is also returned. These ids are useful if you want to use setvalues to change some data or plot options after this function has been called.
Description
This function creates and draws a vector plot. By default, the scalar field is used to color the vectors, unless the special resource gsnScalarContour is set to True, then a separate contour plot is created.
If u, v, or data have a _FillValue attribute, these values will be used as missing values.
If the resource vcMonoLineArrowColor is set to False, then a labelbar is created. If you want to turn this labelbar off, set lbLabelBarOn to False.
If u has an attribute called "long_name", and gsnLeftString hasn't explicitly been set, then the value of this attribute is used for the left string title.
If u has an attribute called "units", and gsnRightString hasn't explicitly been set, then the value of this attribute is used for the right string title.
If your X and Y coordinate arrays have different units, then your vectors may not be drawn correctly. You may want to try setting vcMapDirection to False in this case.
To maximize the area that the plot is drawn in, set the special resource gsnMaximize to True.
If you need more control over the individual vector and contour plots, then it may be easier to create the vector plot with gsn_csm_vector, the contour plot with gsn_csm_contour_map, and then use the overlay procedure to overlay the two. See example "lcnative_overlay_5.ncl" on the Lambert Conformal Native Grid Projection examples page.
See Also
gsn_csm_vector_scalar_map
Special gsn resources
Examples
For some application examples, see: