NCL Home>
Application examples>
Maps and map projections ||
Data files for some examples
Example pages containing:
tips |
resources |
functions/procedures
NCL Graphics: Map Projections
Satellite projections have their own page.
You can view
lambert conformal projections
under the regional climate model. There are numerous examples of
cylindrical equidistant and
polar stereographic projections.
In order to zoom in on a region the four resources
mpMinLatF,
mpMaxLatF,
mpMinLonF,
and
mpMaxLonF
must be set. The thing to remember, is that
mpLimitMode must also be set to "LatLon". The gsn_csm
cylindrical equidistant and polar stereographic plot templates set this
resource for you, so it is easy to overlook.
See the description at the top of
the Map outlines examples page for
information about a change to the behavior of
the mpDataBaseVersion resource in
NCL V6.4.0.
 proj_1.ncl
:
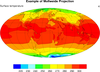
An example of a Mollweide projection.
mpProjection = "Mollweide", Selects the projection
type. The default look for this plot has a box perimeter, and no
lat/lon lines.
mpGridAndLimbOn = True
mpGridLatSpacingF = 20.
mpGridLonSpacingF = 30.
Turns on the lat/lon lines and sets the spacing for each. The default is
very dense.
mpPerimOn = False, Turns off the box perimeter.
A Python version of this projection is available here.
 proj_2.ncl
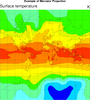
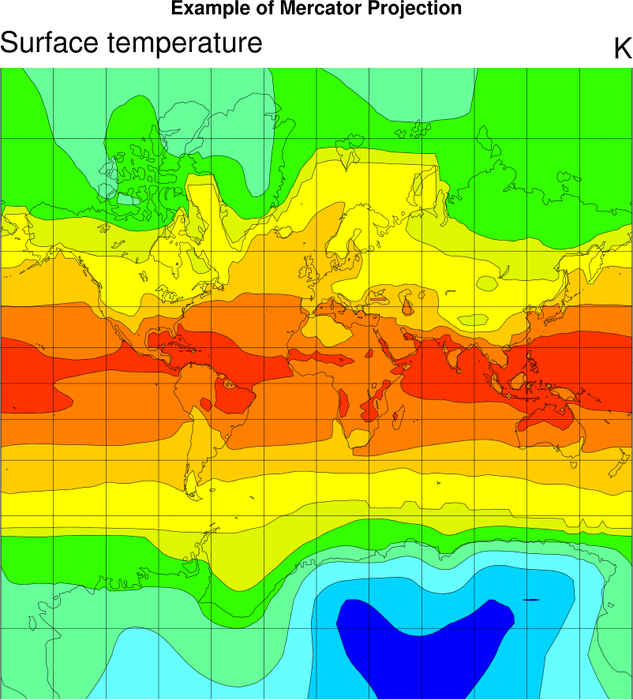
:
An example of a Mercator projection.
A Python version of this projection with a color-blind sensitive color scheme is available here.
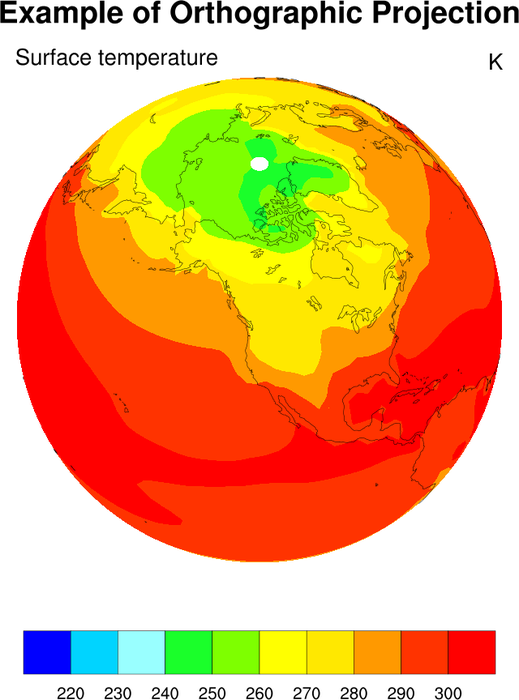
 proj_3.ncl
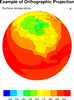
:
An example of a orthographic projection.
mpCenterLonF = -120.
mpCenterLatF = 50.
Chooses the center longitude and latitude.
A Python version of this projection is available here.
