NCL Home>
Application examples>
Maps and map projections ||
Data files for some examples
Example pages containing:
tips |
resources |
functions/procedures
NCL Graphics: map outlines
NCL has three resolutions of map outline databases available through
the
mpDataBaseVersion resource.
Note that the behavior of this resource has changed in NCL V6.4.0!
This resource can take one of four values; see the "dynamic" value for
details about the change in V6.4.0:
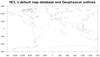
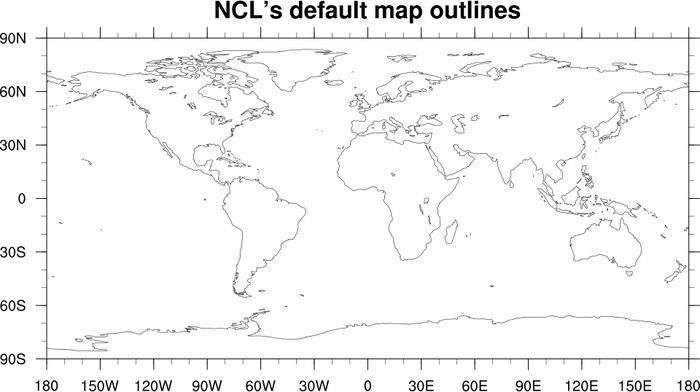
- "LowRes" - the default prior to NCL V6.4.0;
recommended for global maps and not for regional areas
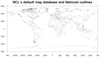
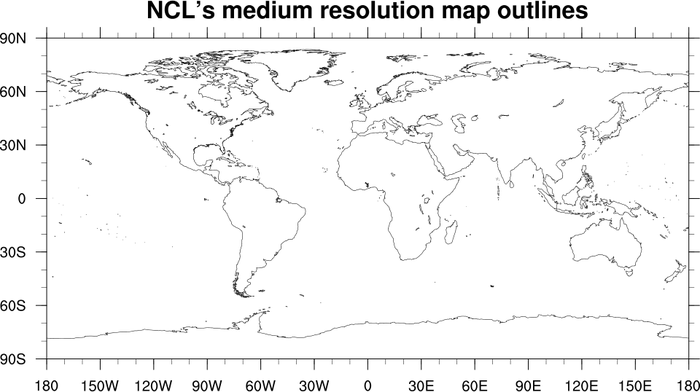
- "MediumRes" - recommended for regional maps; has more up-to-date
political boundaries
Setting mpDataBaseVersion to
"MediumRes" allows you to optionally set
the mpDataSetName resource to control
how many outlines you get and at what resolution. See example mapoutines_7.ncl
below.
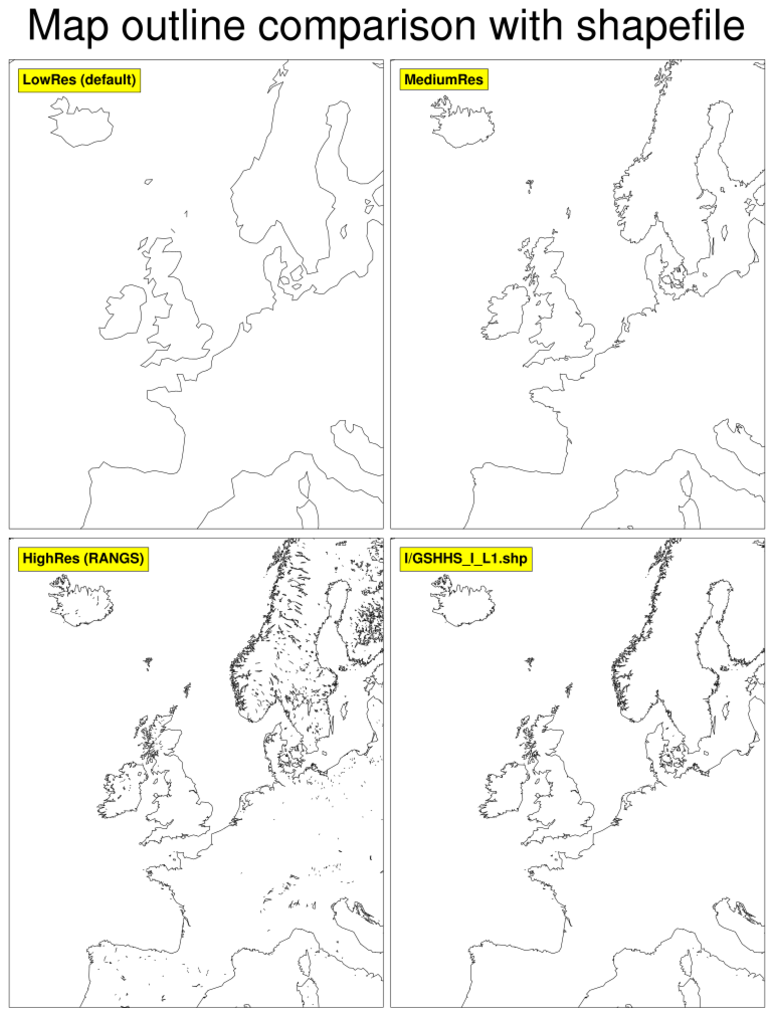
- "HighRes" - a high-resolution coastline database; cannot be used
for global maps as it will not be drawn correctly. Requires a "RANGS"
database that you need to download and install. Go to
the RANGS page for more
information.
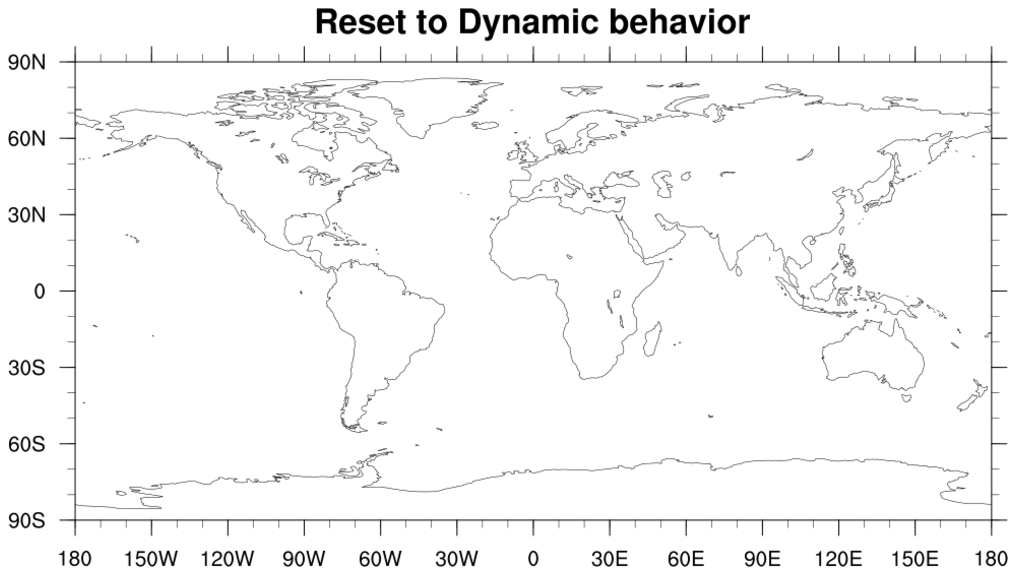
- "Dynamic" - new default behavior introduced with NCL V6.4.0;
the LowRes database is used unless either of mpFillBoundarySets
or mpOutlineBoundarySets is set to something other
than "Geophysical", in which case the MediumRes database is used. (see
example 6 below).
To turn NCL map outlines on or off, set
the mpOutlineOn resource to True or
False. You can also turn map fill on and off by setting
mpFillOn resource to True or False
to turn on/off map fill.
There are many resources for customizing the look of your map outlines.
You can see the full list
of map resources here. Here's a sample:
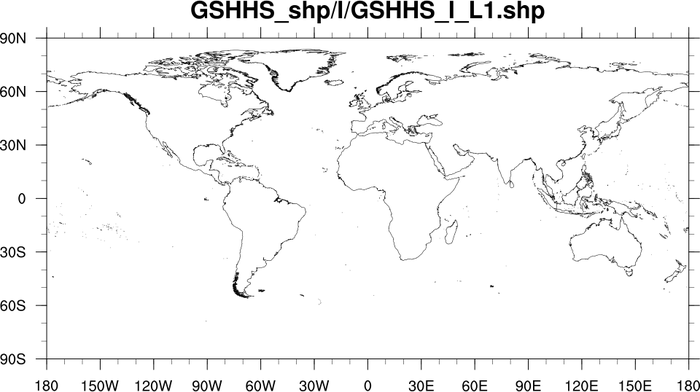
In some cases, NCL's map outlines may not give you the outlines
or resolution you desire. We recommend that people use
shapefiles, which you can
find numerous, free examples of using a web browser search.
The Global Administrative Database (GADM)
(
http://www.gadm.org) offers various
levels of outlines for many countries in the shapefile format. See
the
shapefiles examples page for more
information.
This page shows you various comparisons of the three map databases, as well
as how to add your own map outlines via shapefiles or simple polyline draws
via:
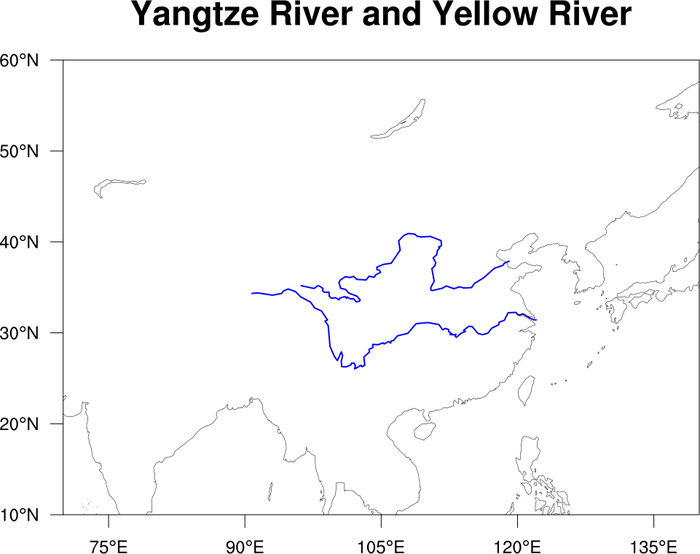
 mapoutlines_1.ncl
:
Shows how to draw the Changjiang and Huanghe Rivers on
a zoomed in map of China, using
gsn_add_polyline.
The script was contributed by Dr. Xiao-Feng Li of the Institute of
Atmospheric Physics (IAP), Chinese Acadmey of Sciences (CAS), modified
from a GrADS code from Dr. Pinwen Guo (NUIST) and NCL code of Dr. Jun
Cheng (NUIST).
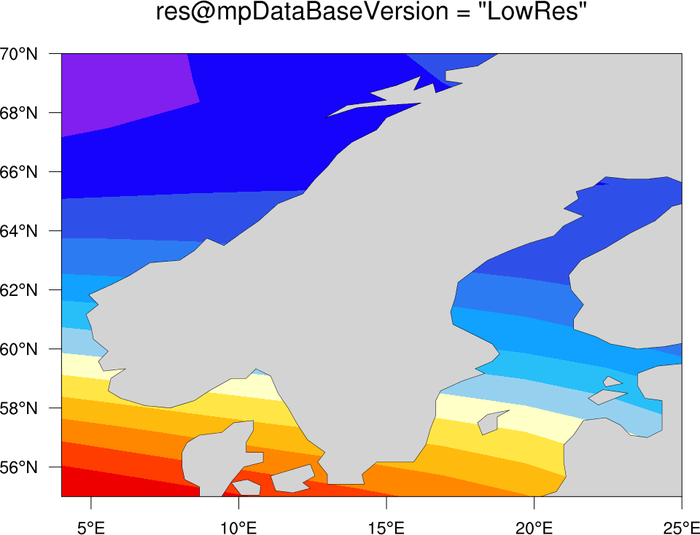
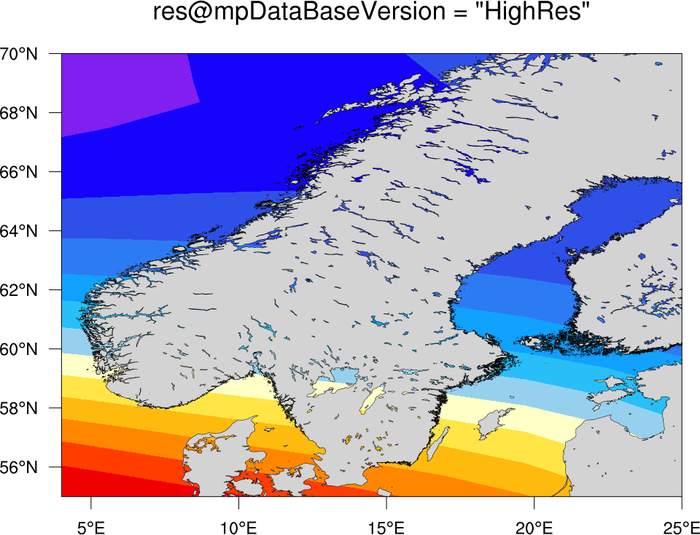
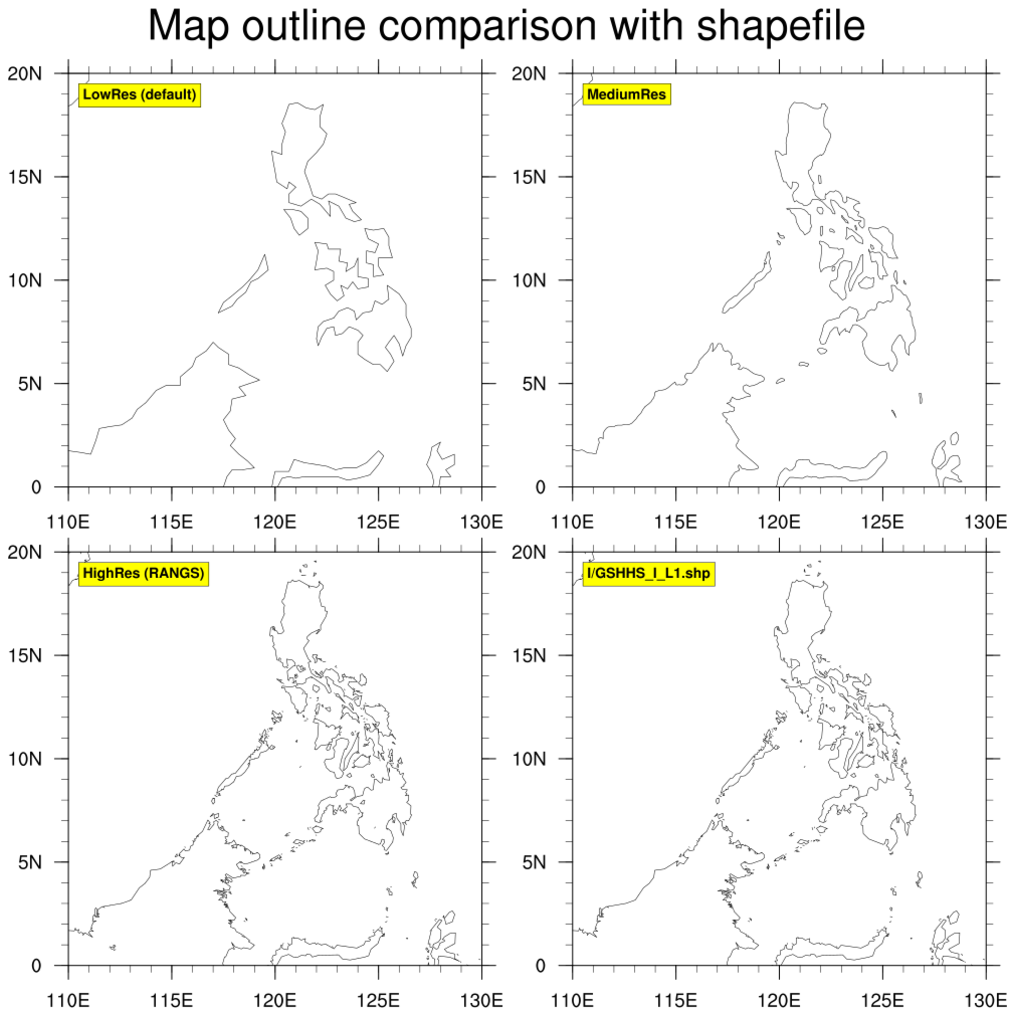
 mapoutlines_5_zoom.ncl
:
This script is similar to the mapoutlines_5.ncl one above, except it
includes the "
HighRes"
database, if installed. It produces two panel plots, so you can
compare the various map outlines.
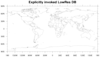
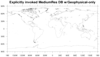
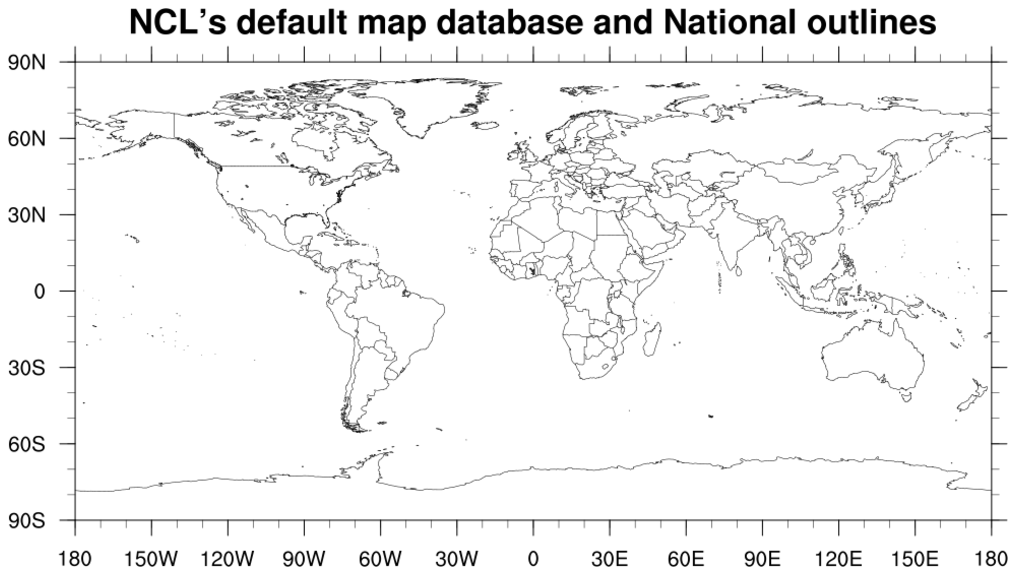
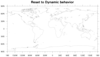 mapoutlines_6.ncl
:
This script illustrates new default map database behavior introduced in
NCL V6.4.0,
and shows how to override the defaults. As with prior versions of NCL, the default
map database is LowRes, unless either of the boundary-set resources
mpFillBoundarySets or
mpOutlineBoundarySets are set
to anything other than "Geophysical", in which case the MediumRes database is used. This
represents a balance between performance and accuracy for common use-cases. The LowRes database
is more than adequate for global scale maps depicting land/ocean boundaries, whereas the
more detailed MediumRes database is preferred for its more up-to-date political boundaries.
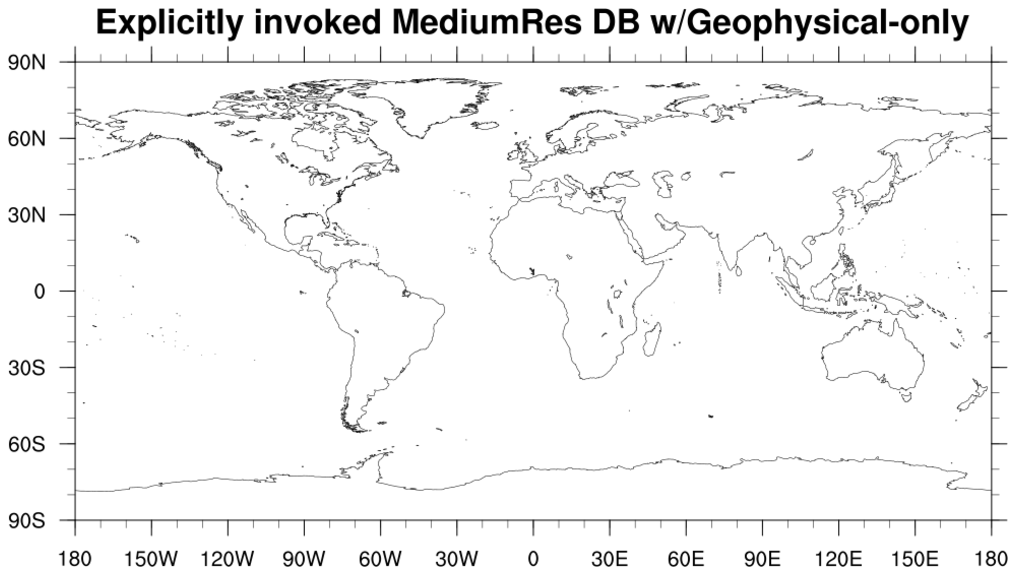
The default behavior can be overridden by explicitly
setting mpDataBaseVersion to the
desired database name.
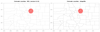
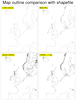
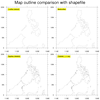
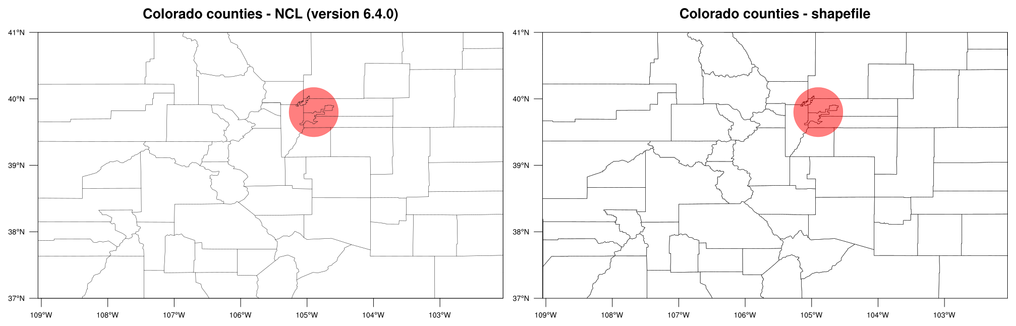
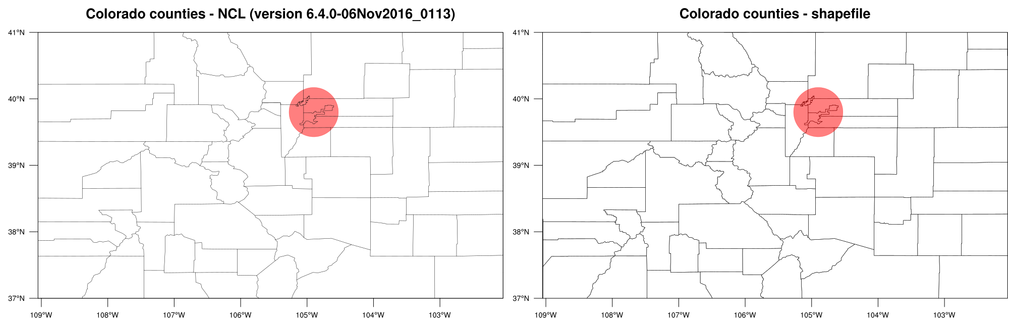
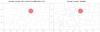 shapefiles_15.ncl
: This
example is another one showing the difference between map outlines in
NCL and map outlines added from a shapefile. The first plot in the
panel shows the counties of Colorado as plotted from NCL, and the
second plot shows the counties as plotted from the USA_adm2 shapefile
downloaded from
http://www.gadm.org/country.
The left image is from running
NCL V6.3.0 on this
script. The right image is from running
NCL V6.4.0.
In NCL versions 6.3.0 and earlier, the NCL outlines will not show the
county of Broomfield or the updated counties around Denver. In NCL
version 6.4.0, the NCL map databases were updated to reflect the
current Colorado counties.
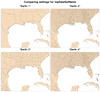
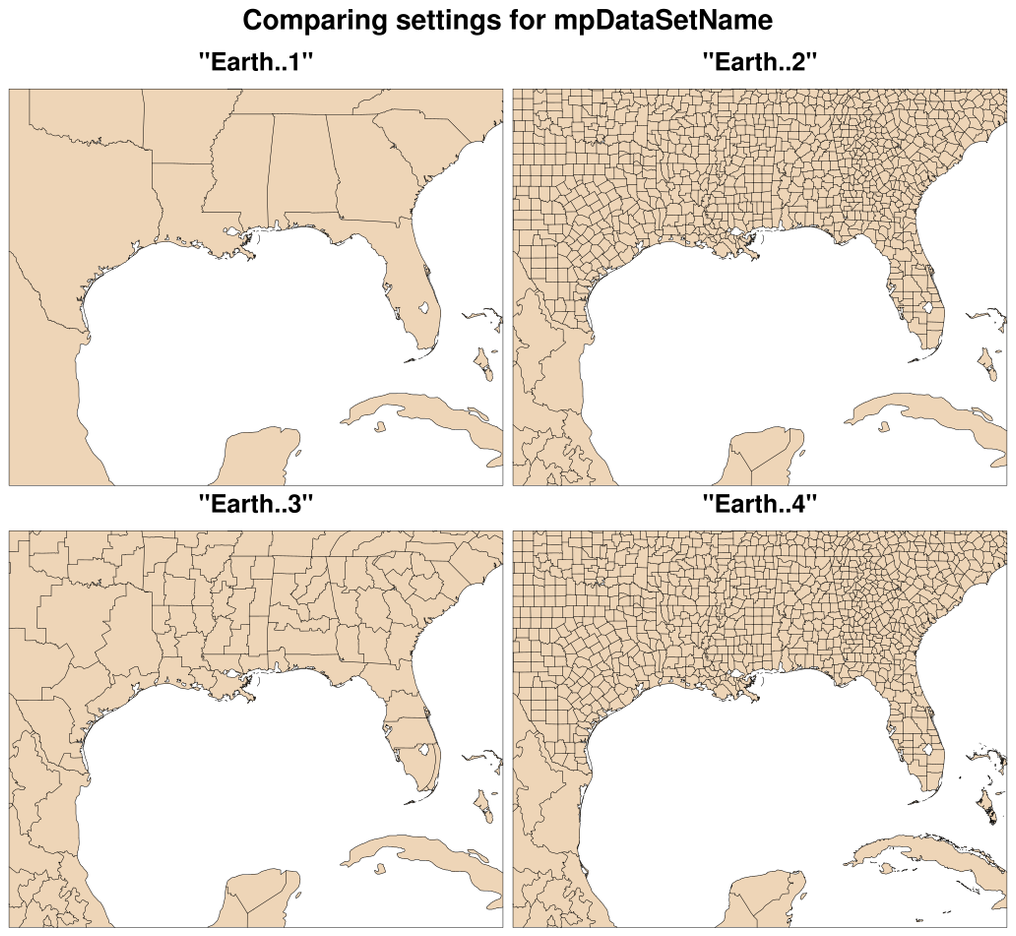
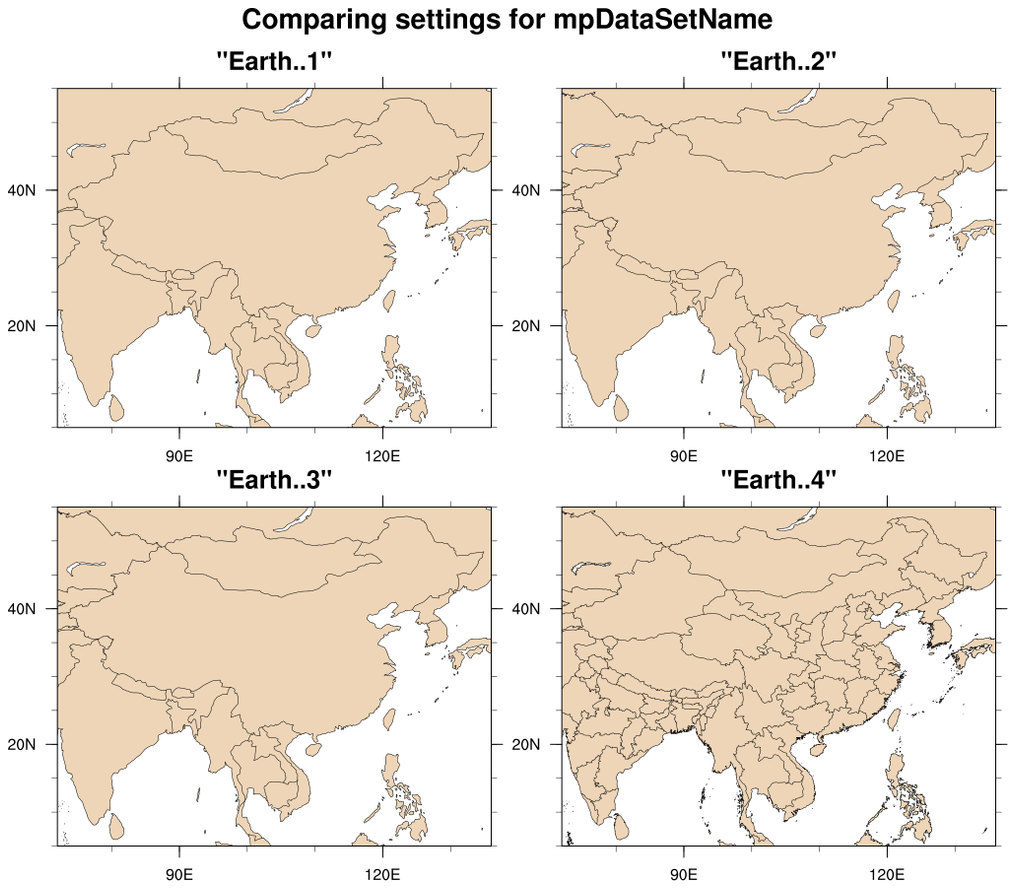
 mapoutlines_7.ncl
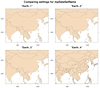
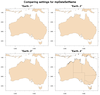
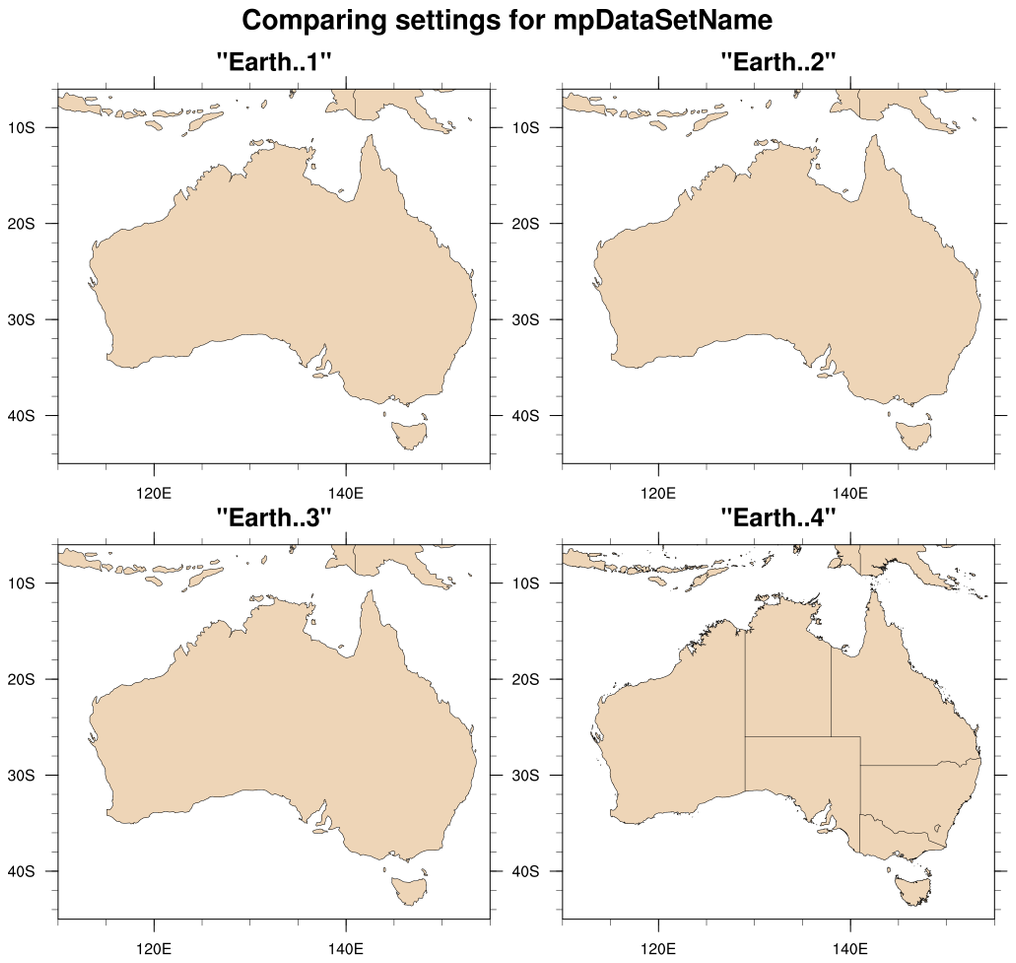
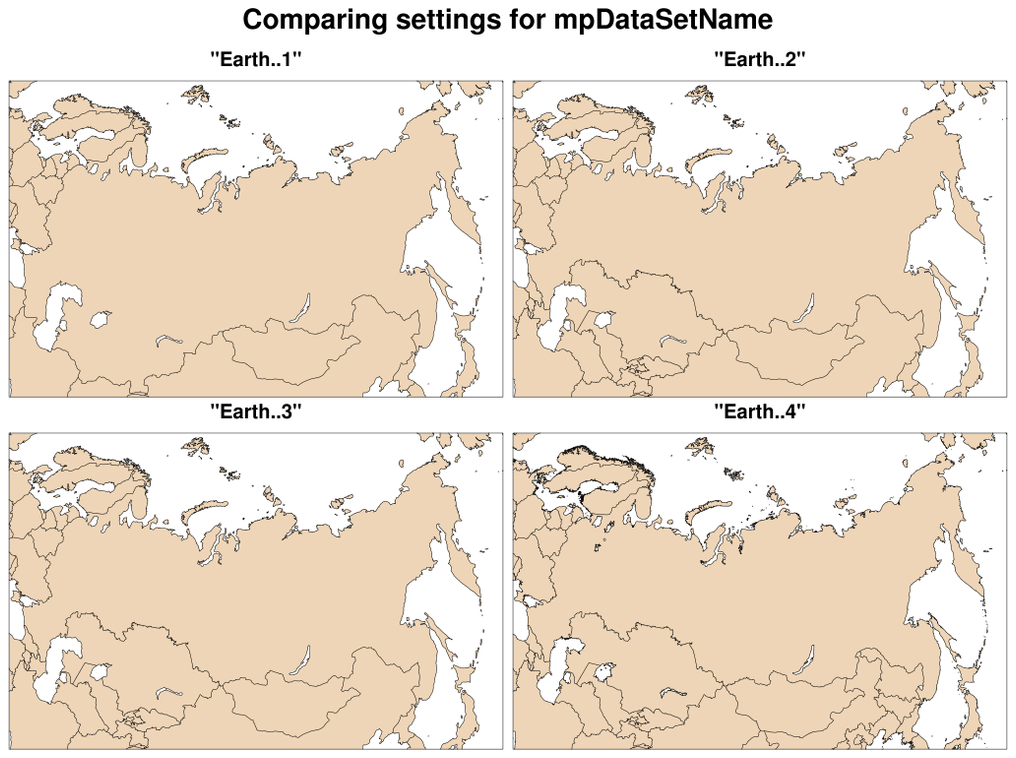
:
This script compares the four possible settings for
the
mpDataSetName resource, which
gives you more map outlines and better resolution, depending on the
area of the map you are focused on.
In order to use this resource,
mpDataBaseVersion must be set to
"MediumRes" (which is the default in NCL V6.4.0 if you zoom in on a
map). Also, in order to see all the possible boundaries, you must set
mpOutlineBoundarySets to "AllBoundaries", otherwise
you will only get geophysical outlines.
mpDataSetName has four possible
values:
- "Earth..1" - This is an older dataset that contains geophysical and
political boundaries including the states of the United States.
- "Earth..2" - This is the default value. It is similar to
"Earth..1" except that it contains the country Eritrea, and several
countries resulting from the breakup of the USSR that were not
included in "Earth..1". It also contains the provinces of Canada, the
states of Mexico, and all the counties in the United States.
- "Earth..3" - Similar to "Earth..2" except that the United States
counties are replaced with climate divisions within each state.
- "Earth..4" - Similar to "Earth..2", but has about 10 times as much
detail and is much more accurate.
For more details, see the documentation for
mpDataSetName.
The four panel plots show the effect that these four values have on
the outlines when you zoom in on different parts of the world. Note
that the maps for "Earth..2" and "Earth..3" look identical for all
maps except the United States.


