These plotting scripts assume you know the correct parallels, meridian,
and corners of the rcm2 model domain you are working with. This
information is REQUIRED to correctly plot the RCM because it is on a
native Lambert Conformal grid. For discussion of this issue, we have
a page devoted to native grids.
WARNING: Originally, the users of this model could not provide us with the correct
values of the parallels and meridian. Through trial and error, we have
chosen values that roughly matched the data to the map. This is not
precise. If you are using the RCM, you must determine these values to
correctly display your data. The examples below are provided to show
the code required.
Noah Diffenbaugh and
Mark Snyder have created a
website dedicated to
visualizing RegCM3 output using the NCAR Command Language (NCL). We
are told that a new version of the model is available for
download.
NCL Home>
Application examples>
Models ||
Data files for some examples
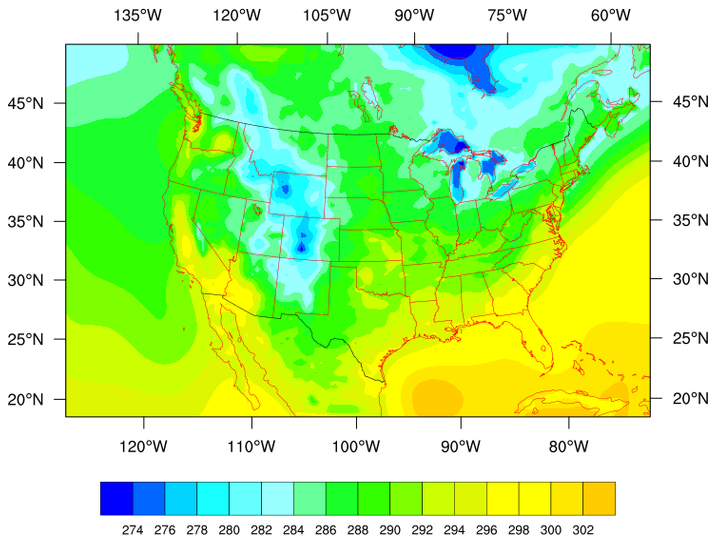
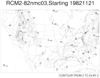
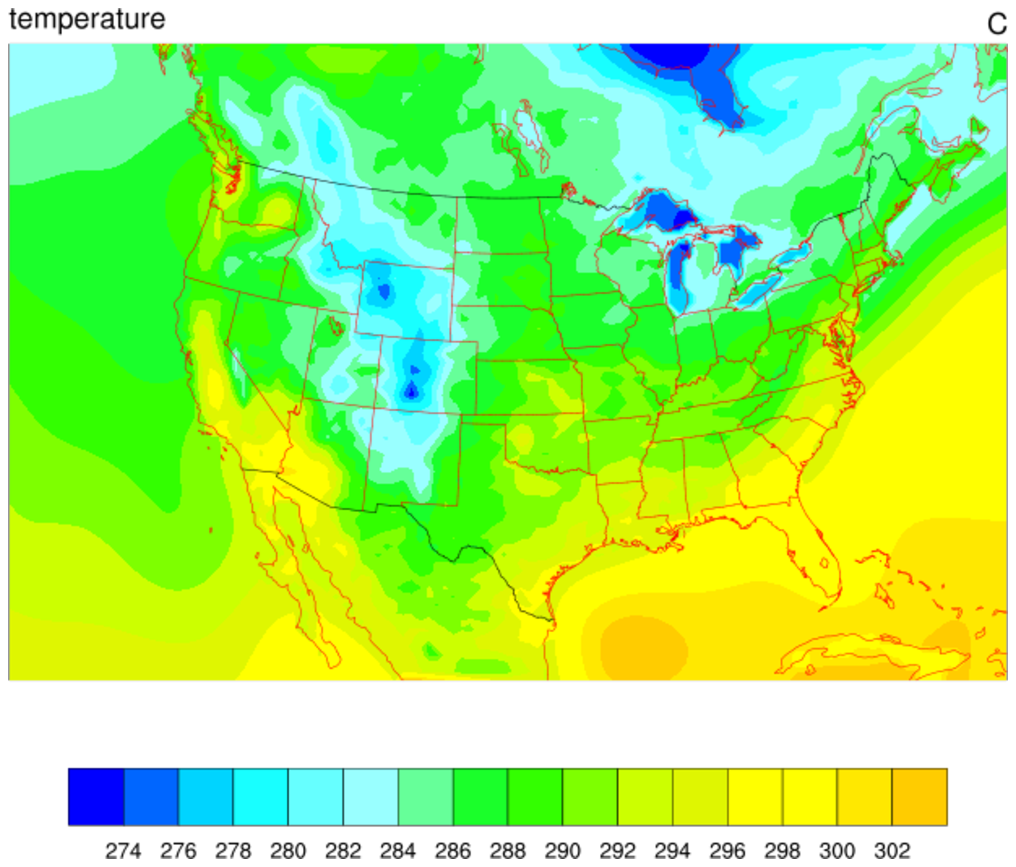
 rcm_1.ncl: An example of plotting
cray binary data from the RCM2 on a Lambert Conformal projection.
rcm_1.ncl: An example of plotting
cray binary data from the RCM2 on a Lambert Conformal projection.
mpOutlineBoundarySets = "GeophysicalAndUSStates", adds state boundaries to the map. mpUSStateLineColor = "red", draws the state boundaries as red. mpProjection = "LambertConformal", chooses the map projection. mpPerimOn = True, adds a perimeter box around the map.
 rcm_2.ncl: Same plot as example
one, but with subtitles.
rcm_2.ncl: Same plot as example
one, but with subtitles.
We need to turn off the automatic tickmarks in order to make room for the titles.
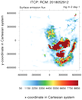
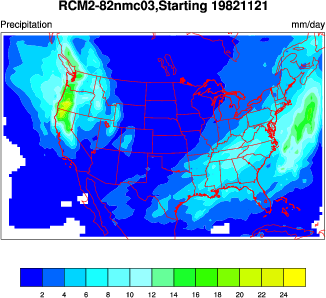
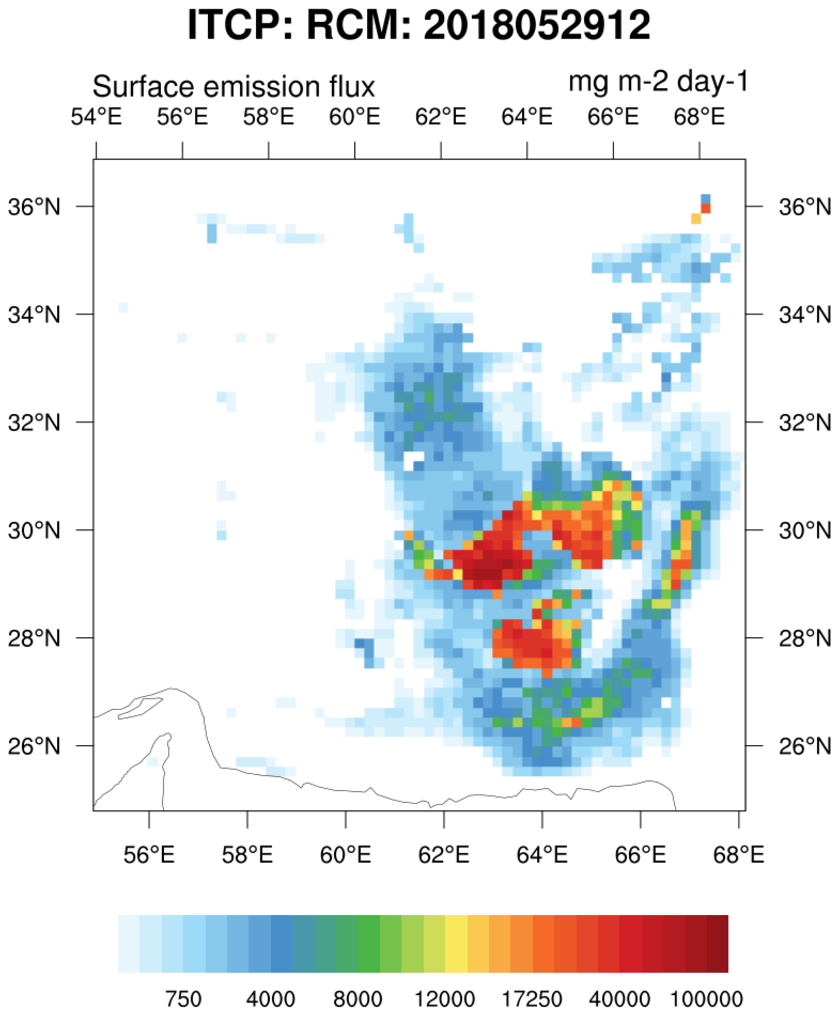
 rcm_3.ncl: A color precipitation
plot using a netCDF version of the data. Jeff Lee has created a
filter to convert the cray
cos blocked rcm binaries to netCDF. GO JEFF! If you want to use
this filter, copy it to your directory and modify it to suit your
purposes. It works on one variable at a time.
rcm_3.ncl: A color precipitation
plot using a netCDF version of the data. Jeff Lee has created a
filter to convert the cray
cos blocked rcm binaries to netCDF. GO JEFF! If you want to use
this filter, copy it to your directory and modify it to suit your
purposes. It works on one variable at a time.
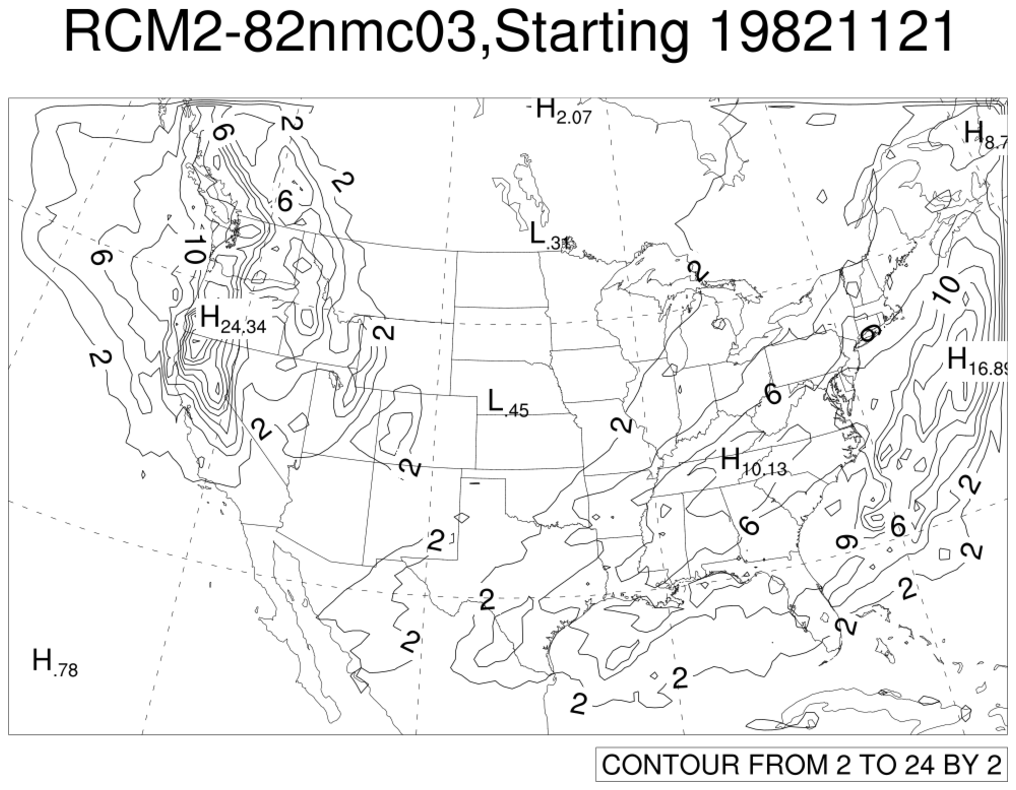
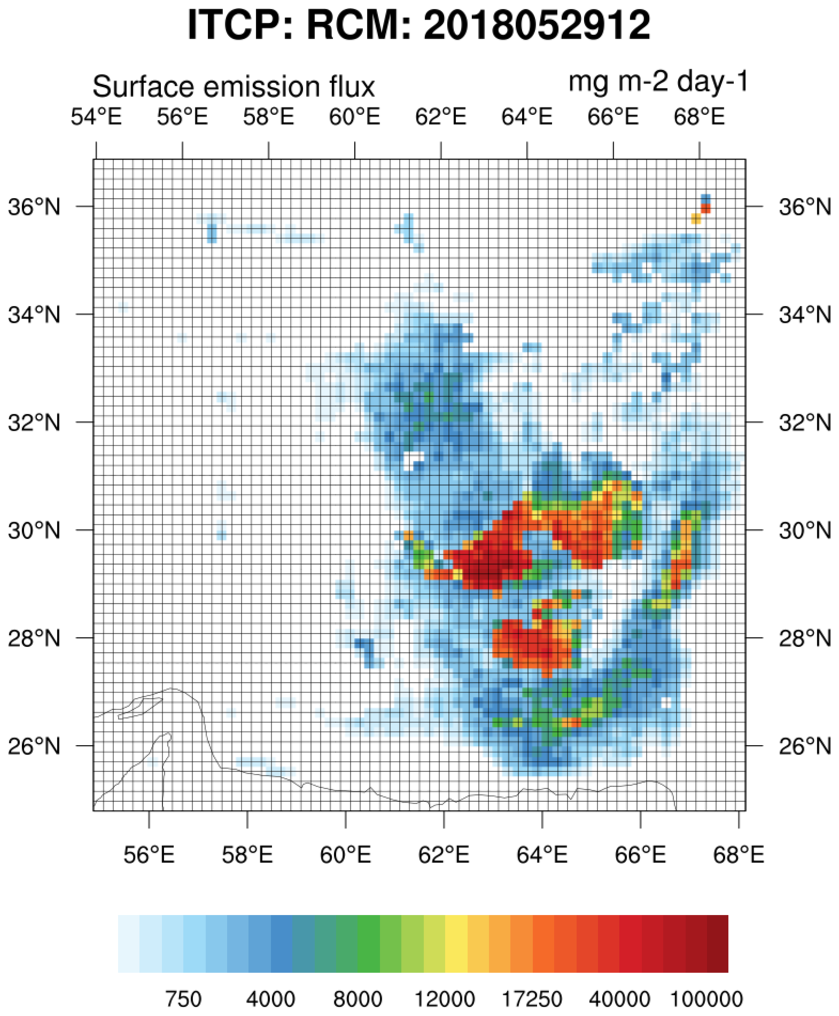
 rcm_4.ncl: A black and white version
of example 3, suitable for publication. Note that the contours lines
have been thickened for better screen viewing. This may have to be
removed if plotted.
rcm_4.ncl: A black and white version
of example 3, suitable for publication. Note that the contours lines
have been thickened for better screen viewing. This may have to be
removed if plotted.
There are other fill patterns to choose from.
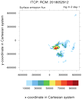
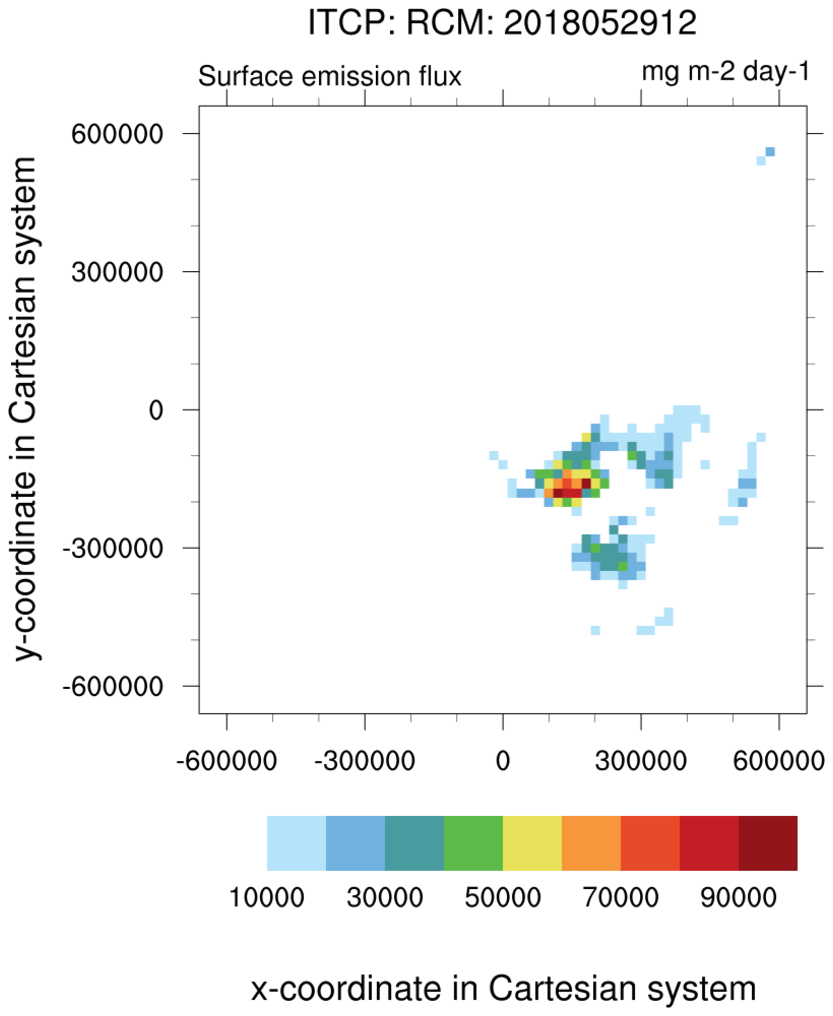
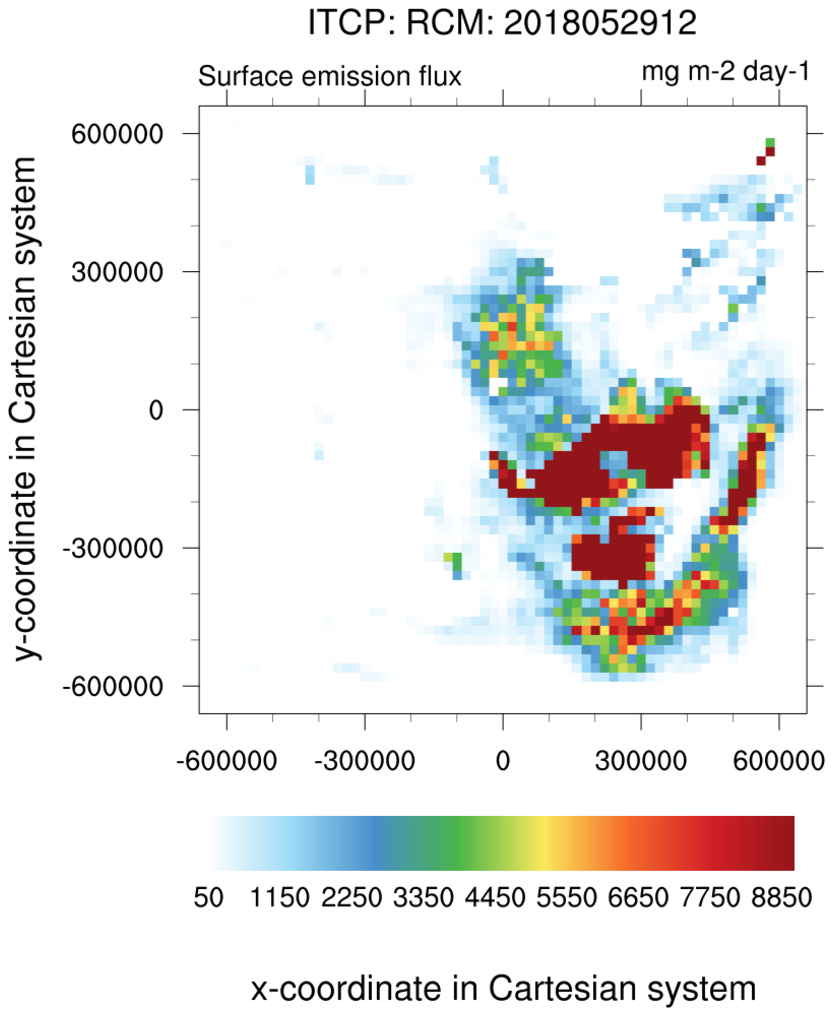
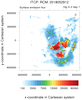 rcm_5.ncl:
Read user specified variable [ "emflx" ]; extract dates on the file;
explore the variable's distribution using stat_dispersion;
Use ind to extract a user specified date [ here: 'yyyymmddhh' ].
The data are specifeid for a Cartesian style grid. Plot.
rcm_5.ncl:
Read user specified variable [ "emflx" ]; extract dates on the file;
explore the variable's distribution using stat_dispersion;
Use ind to extract a user specified date [ here: 'yyyymmddhh' ].
The data are specifeid for a Cartesian style grid. Plot.
Example pages containing: tips | resources | functions/procedures
NCL Graphics: Regional Climate Model
The Abdus Salam International Centre for Theoretical Physics (ITCP)
holds workshops on Regional Climate Models (RCMs). As they note:
"Regional climate models (RCMs) are widely used tools to produce high
resolution climate information at regional scales, and can be run at resolutions
of a few km which allow explicit description of convection processes.
rcm_1.ncl: An example of plotting
cray binary data from the RCM2 on a Lambert Conformal projection.
mpOutlineBoundarySets = "GeophysicalAndUSStates", adds state boundaries to the map. mpUSStateLineColor = "red", draws the state boundaries as red. mpProjection = "LambertConformal", chooses the map projection. mpPerimOn = True, adds a perimeter box around the map.
 rcm_2.ncl: Same plot as example
one, but with subtitles.
rcm_2.ncl: Same plot as example
one, but with subtitles.
We need to turn off the automatic tickmarks in order to make room for the titles.
 rcm_3.ncl: A color precipitation
plot using a netCDF version of the data. Jeff Lee has created a
filter to convert the cray
cos blocked rcm binaries to netCDF. GO JEFF! If you want to use
this filter, copy it to your directory and modify it to suit your
purposes. It works on one variable at a time.
rcm_3.ncl: A color precipitation
plot using a netCDF version of the data. Jeff Lee has created a
filter to convert the cray
cos blocked rcm binaries to netCDF. GO JEFF! If you want to use
this filter, copy it to your directory and modify it to suit your
purposes. It works on one variable at a time.
 rcm_4.ncl: A black and white version
of example 3, suitable for publication. Note that the contours lines
have been thickened for better screen viewing. This may have to be
removed if plotted.
rcm_4.ncl: A black and white version
of example 3, suitable for publication. Note that the contours lines
have been thickened for better screen viewing. This may have to be
removed if plotted.
There are other fill patterns to choose from.
 rcm_5.ncl:
Read user specified variable [ "emflx" ]; extract dates on the file;
explore the variable's distribution using stat_dispersion;
Use ind to extract a user specified date [ here: 'yyyymmddhh' ].
The data are specifeid for a Cartesian style grid. Plot.
rcm_5.ncl:
Read user specified variable [ "emflx" ]; extract dates on the file;
explore the variable's distribution using stat_dispersion;
Use ind to extract a user specified date [ here: 'yyyymmddhh' ].
The data are specifeid for a Cartesian style grid. Plot.