NCL Home>
Application examples>
Maps and map projections ||
Data files for some examples
Example pages containing:
tips |
resources |
functions/procedures
NCL Graphics: Native Grid Projections
WARNING
Is your data on a native grid? A native grid is a
grid that is on a particular map projection.
In order to plot the data correctly over a map, you must know the
exact map projection and all its parameters. You will then plot
the data over this map projection without needing to do any kind of
mathematical transformation.
To plot native grids, you must set the resource tfDoNDCOverlay = True, so that the data
doesn't go through a mathematical transformation to be overlaid on the
map. Additionally, you commonly want to set the resource mpLimitMode="Corners" to specify the area of
the map to zoom in on. This resource must be accompanied by resources
for setting the four corners of the map area to view: mpLeftCornerLatF, mpLeftCornerLonF, mpRightCornerLatF, and mpRightCornerLonF.
pmTickMarkDisplayMode = "Always"
turns on the automatic tickmarks.
If your data comes with 2D lat/lon arrays, you then have the option of
plotting it on a different map projection. In this case, you do not
want to set tfDoNDCOverlay (it is
False by default). Instead, you will need to set the special
lat2d/lon2d attributes. See example 3 on the Ice Model page, example 1 on the EASE page, or example 3 on the Raster contouring page,
Lambert conformal native grids have been
given their own page.
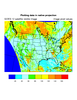
STEREOGRAPHIC
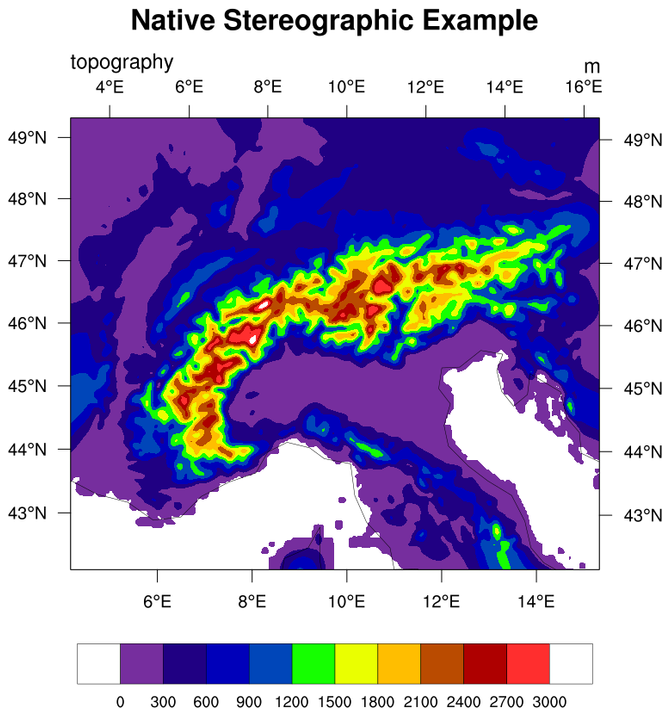
native_1.ncl: An example of a
Stereographic native grid.
mpProjection = "Stereographic", sets
the projection.
The four pieces of information that are required for this projection
(with example values) are:
mpRelativeCenterLon = True
mpCenterLonF = 10
mpRelativeCenterLat = True
mpCenterLatF = 90.
For this grid, you must set the center lat (-90 or 90) and center lon,
sometimes referred to as the "orientation". A common way that these
grids are described is to give the orientation, the delta X and delta
Y at some arbitrary latitude and the coordinates of the pole in
integer grid coordinates. Coming up with corner lat/lons is difficult
when this is the only information provided.
See native_6.ncl below for a script that helps you to find the
correct values for the map projection resources.
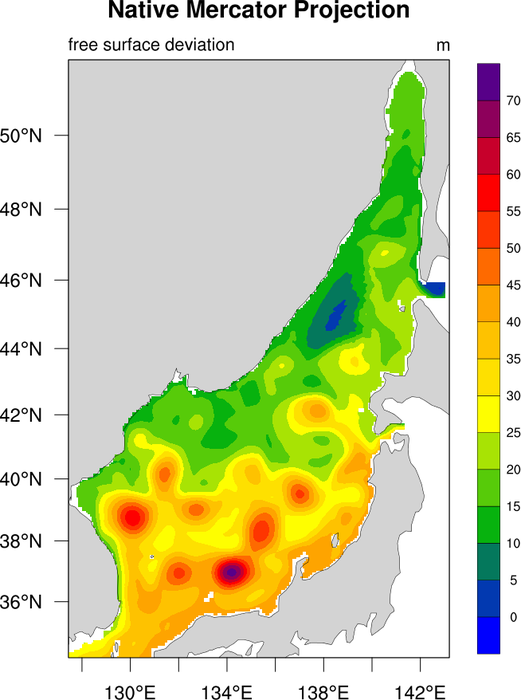
MERCATOR
native_2.ncl: An example of a
Mercator native grid.
mpProjection = "Mercator", sets the
projection.
This projection requires that the "corners"
method of specifying the map boundaries be used. (see example 1
above).
A Python version of this projection is available here.
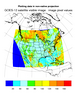
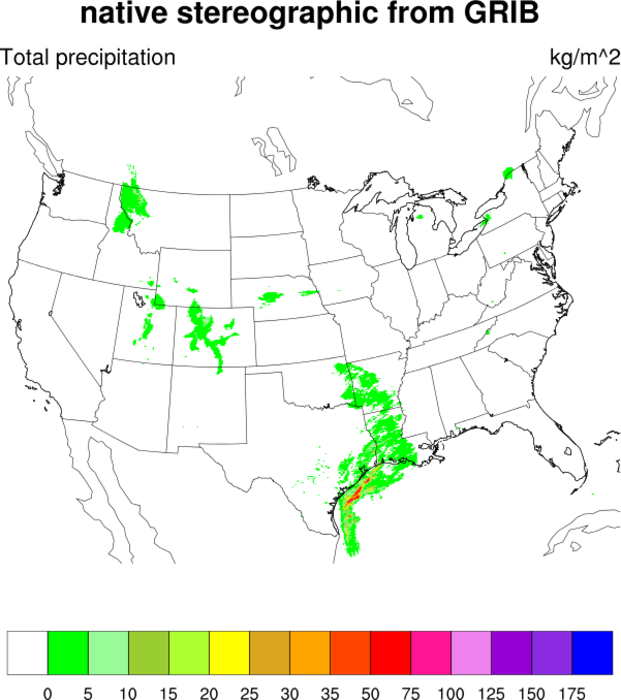
STEREOGRAPHIC: FROM GRIB
native_3.ncl: Like example 4, this
GRIB file has attributes that make plotting the native stereographic
projection easy.
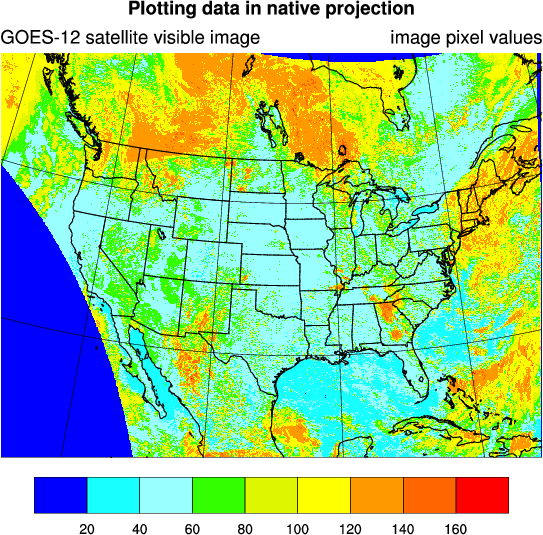
 native_5.ncl
: This
example shows how to plot geoscientific data in its native projection,
and then how to calculate the lat/lon values of the projection
so you can overlay the data on a different map projection.
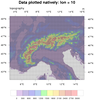
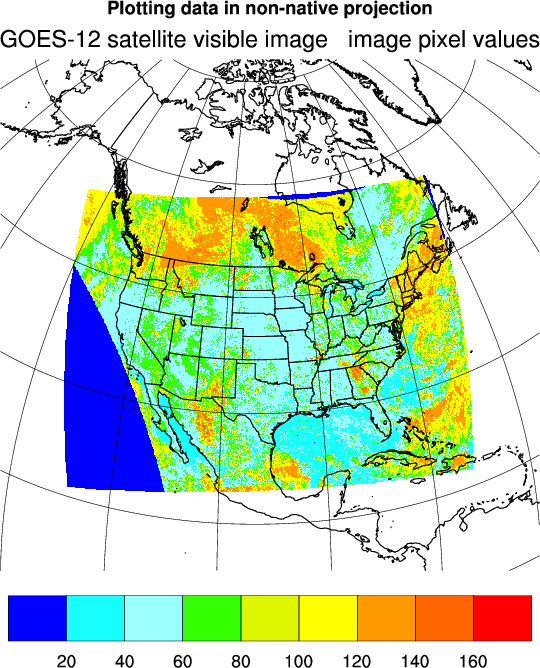
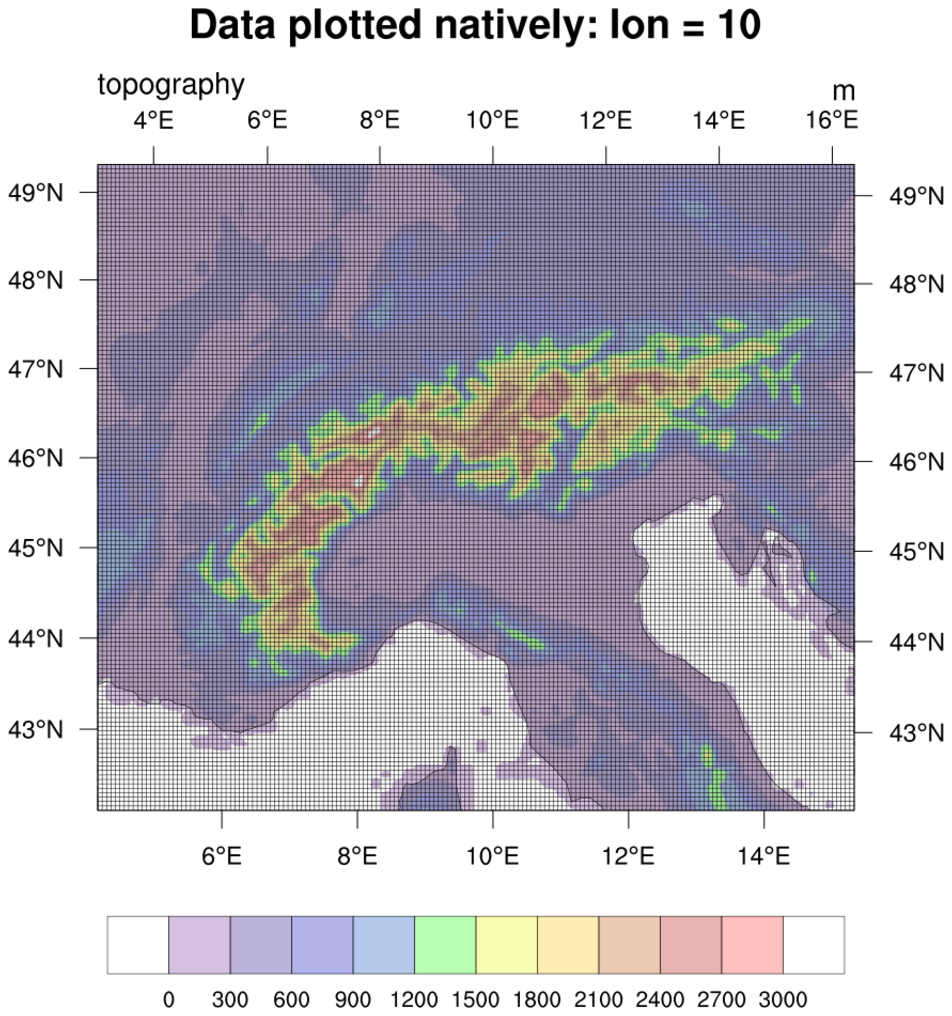
 native_6.ncl
: This script is
similar to
native_1.ncl, except it compares plotting the data using
both native and non-native settings.
Plotting data in its native projection means that you MUST set the
exact parameters of the native map projection or the plot will not be
correct. To plot data in its native projection, you must set
tfDoNDCOverlay to "NDCViewport" and
then all the correct map projection resources.
We didn't know what the correct relative center longitude value was
for the native projection, but we had a rough idea that it was around
9.9 (since this was the rough center of the data's lat/lon grid).
To debug this problem and try to find the correct value, we created a
do loop to try different guesses around longitude=9.9. We also added
every other lat/lon grid line of the data
using gsn_coordinates to see if the
lines were straight. If they were, then this was a good sign that we
had the correct longitude. Using this loop, we determined that
longitude=10 was the correct value.
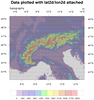
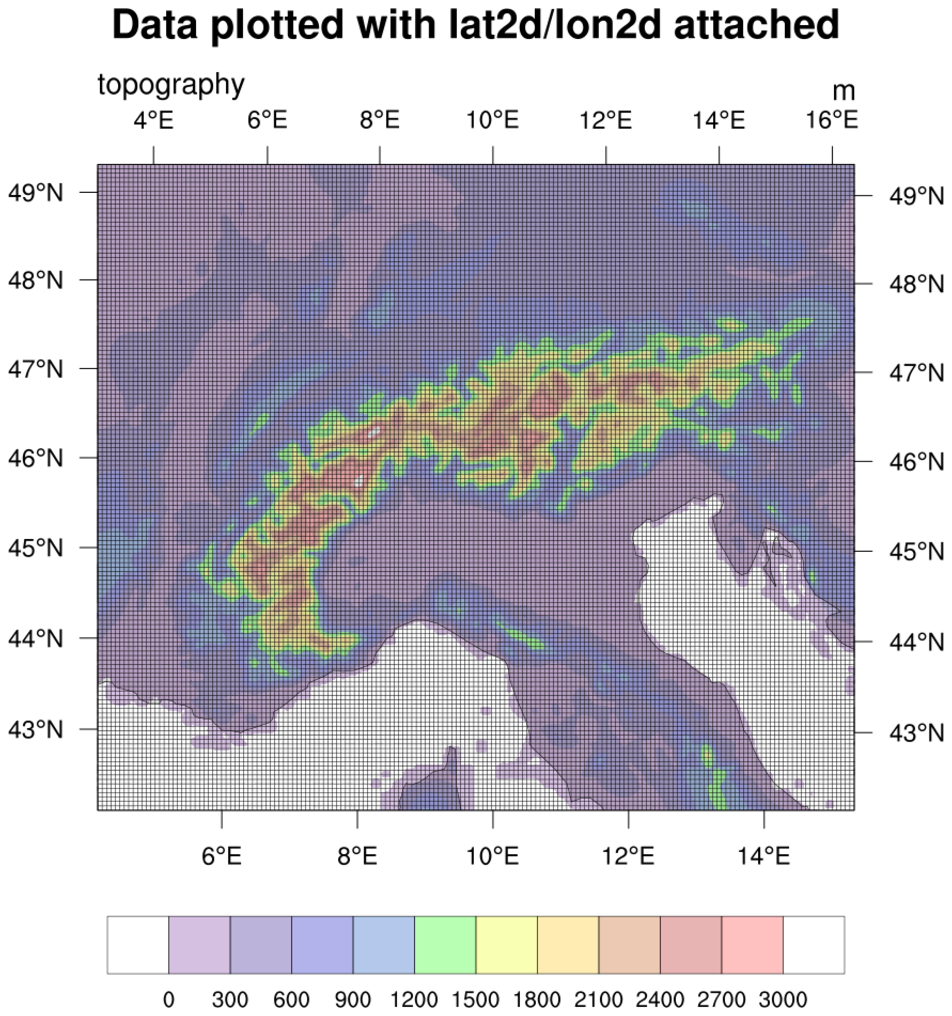
We then compared the native plot with a plot where the lat/lon arrays
were provided by attaching them as "lat2d" and "lon2d" to the data
being plotted. This gave us another way to check that the native plot
we had was correct. To plot data this way, you must set
tfDoNDCOverlay to "DataTransform"
(which is the default). It doesn't matter which map projection you use
in this case, but we used the same map as the native plot so we could
directly compare them.
Note that in NCL version
6.4.0 and earlier, the gsn_csm functions only allow you to set
tfDoNDCOverlay to True or False.
Setting it to True is the equivalent of setting it to "NDCViewport",
and setting it to False is the equivalent of setting it to "DataTransform".
