The heat library requires NCL 6.4.0 (onward)..
NCL Home>
Application examples>
Data Analysis ||
Data files for some examples
 heat_1.ncl:
Example 1:
This example reads three user specified grid points which correspond approximately to:
(i) Ciudad Guyana, Venezuela; (ii) Dahrain, Saudi Arabia and, (iii) Alexandra, Louisiana.
The hourly data span the 2004-2005 period. The relative humidity is not on the file
but the specific humidity is available. The required relative humidity can be computed via
relhum. The heat_index_nws
function is used to compute the heat indices (degC). Subsequently, the
calculate_daily_values is used to find the
maximum daily heat indices over the two year period. These are plotted as time series.
The levels of "Caution" (yellow), "Extreme Caution" (green), "danger" (blue) and
"Extreme Danger" (red) are indicated.
heat_1.ncl:
Example 1:
This example reads three user specified grid points which correspond approximately to:
(i) Ciudad Guyana, Venezuela; (ii) Dahrain, Saudi Arabia and, (iii) Alexandra, Louisiana.
The hourly data span the 2004-2005 period. The relative humidity is not on the file
but the specific humidity is available. The required relative humidity can be computed via
relhum. The heat_index_nws
function is used to compute the heat indices (degC). Subsequently, the
calculate_daily_values is used to find the
maximum daily heat indices over the two year period. These are plotted as time series.
The levels of "Caution" (yellow), "Extreme Caution" (green), "danger" (blue) and
"Extreme Danger" (red) are indicated.
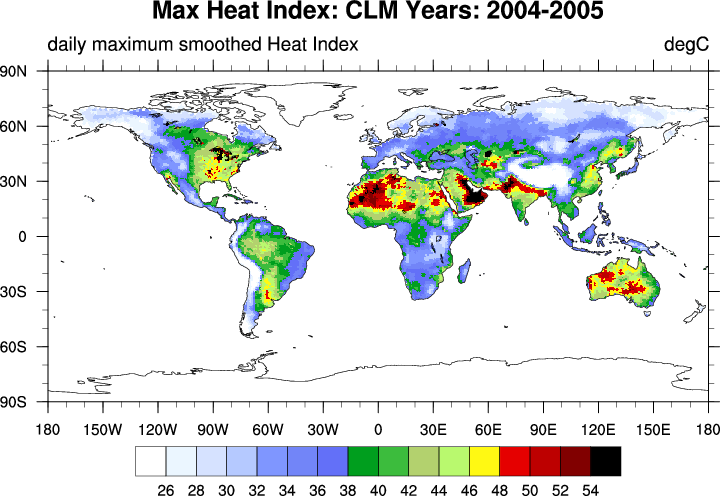
 heat_2.ncl:
Example 2:
Read the hourly temperature and specific humidity variables for the 2004-2005 period.
The relative humidity is not on the file but the specific humidity is available. The required
relative humidity can be computed via relhum.
The heat_index_nws
function is used to compute the hourly heat indices (degC). Subsequently, the
wgt_runave_n_Wrap is used to smooth
the heat indices over over the two year period.
The dim_max_n_Wrap is used to determine the maximum
smoothed heat index over the period.
heat_2.ncl:
Example 2:
Read the hourly temperature and specific humidity variables for the 2004-2005 period.
The relative humidity is not on the file but the specific humidity is available. The required
relative humidity can be computed via relhum.
The heat_index_nws
function is used to compute the hourly heat indices (degC). Subsequently, the
wgt_runave_n_Wrap is used to smooth
the heat indices over over the two year period.
The dim_max_n_Wrap is used to determine the maximum
smoothed heat index over the period.
Example pages containing: tips | resources | functions/procedures
NCL: Heat Index / Stress
The following description(s) are quoted from WikiPedia or the National Weather Service:
- The heat index (HI) or humiture or humidex (not to be confused with the Canadian humidex) is an index that combines air temperature and relative humidity in an attempt to determine the human-perceived equivalent temperature-how hot it would feel if the humidity were some other value.
    HEAT INDEX
  degC    degF        Notes
 27-32    80-91    Caution: fatigue and cramps possible with prolonged exposure and activity.
 32-41    90-105   Extreme caution: cramps, heat exhaustion and heat stroke
 41-54   105-130   Danger: cramps, heat exhaustion are likely; heat stroke probable
   54+     130+    Extreme danger: heat stroke is imminent.
References and Links:
 http://www.wpc.ncep.noaa.gov/html/heatindex_equation.shtml

 https://en.wikipedia.org/wiki/Heat_index

 Buzan, J.R. et al (2015):
    Implementation and comparison of a suite of heat stress metrics
           within the Community Land Model version 4.5
    Geosci. Model Dev., 8, 151-170, 2015
    www.geosci-model-dev.net/8/151/2015/
    doi: http://dx.doi.org/10.5194/gmd-8-151-2015

 Lans P. Rothfusz (1990): NWS Technical Attachment (SR 90-23)

 R. G. Steadman, 1979:
    The Assessment of Sultriness:
    Part I: A Temperature-Humidity Index Based on Human Physiology and Clothing Science
    J. Appl. Meteor., 18, 861-873.
    doi: http://dx.doi.org/10.1175/1520-0450(1979)018<0861:TAOSPI>2.0.CO;2
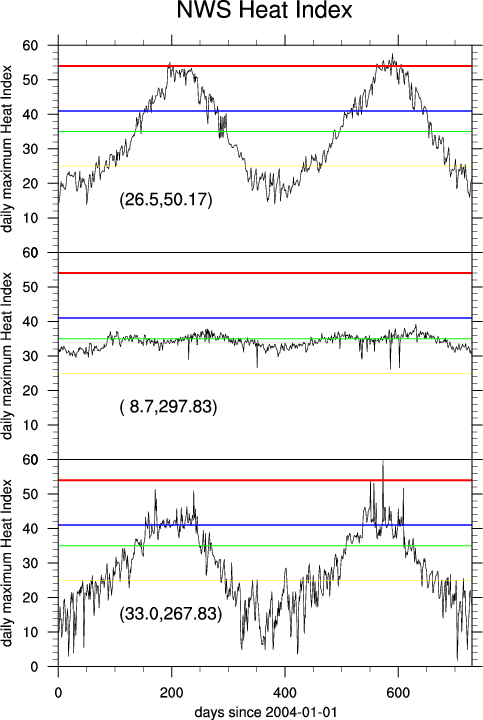 heat_1.ncl:
Example 1:
This example reads three user specified grid points which correspond approximately to:
(i) Ciudad Guyana, Venezuela; (ii) Dahrain, Saudi Arabia and, (iii) Alexandra, Louisiana.
The hourly data span the 2004-2005 period. The relative humidity is not on the file
but the specific humidity is available. The required relative humidity can be computed via
relhum. The heat_index_nws
function is used to compute the heat indices (degC). Subsequently, the
calculate_daily_values is used to find the
maximum daily heat indices over the two year period. These are plotted as time series.
The levels of "Caution" (yellow), "Extreme Caution" (green), "danger" (blue) and
"Extreme Danger" (red) are indicated.
heat_1.ncl:
Example 1:
This example reads three user specified grid points which correspond approximately to:
(i) Ciudad Guyana, Venezuela; (ii) Dahrain, Saudi Arabia and, (iii) Alexandra, Louisiana.
The hourly data span the 2004-2005 period. The relative humidity is not on the file
but the specific humidity is available. The required relative humidity can be computed via
relhum. The heat_index_nws
function is used to compute the heat indices (degC). Subsequently, the
calculate_daily_values is used to find the
maximum daily heat indices over the two year period. These are plotted as time series.
The levels of "Caution" (yellow), "Extreme Caution" (green), "danger" (blue) and
"Extreme Danger" (red) are indicated.
 heat_2.ncl:
Example 2:
Read the hourly temperature and specific humidity variables for the 2004-2005 period.
The relative humidity is not on the file but the specific humidity is available. The required
relative humidity can be computed via relhum.
The heat_index_nws
function is used to compute the hourly heat indices (degC). Subsequently, the
wgt_runave_n_Wrap is used to smooth
the heat indices over over the two year period.
The dim_max_n_Wrap is used to determine the maximum
smoothed heat index over the period.
heat_2.ncl:
Example 2:
Read the hourly temperature and specific humidity variables for the 2004-2005 period.
The relative humidity is not on the file but the specific humidity is available. The required
relative humidity can be computed via relhum.
The heat_index_nws
function is used to compute the hourly heat indices (degC). Subsequently, the
wgt_runave_n_Wrap is used to smooth
the heat indices over over the two year period.
The dim_max_n_Wrap is used to determine the maximum
smoothed heat index over the period.