NCL Home >
Documentation >
Graphics >
Color Tables >
Gallery
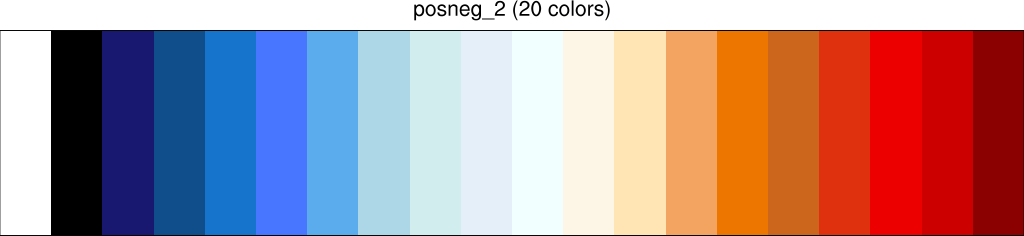
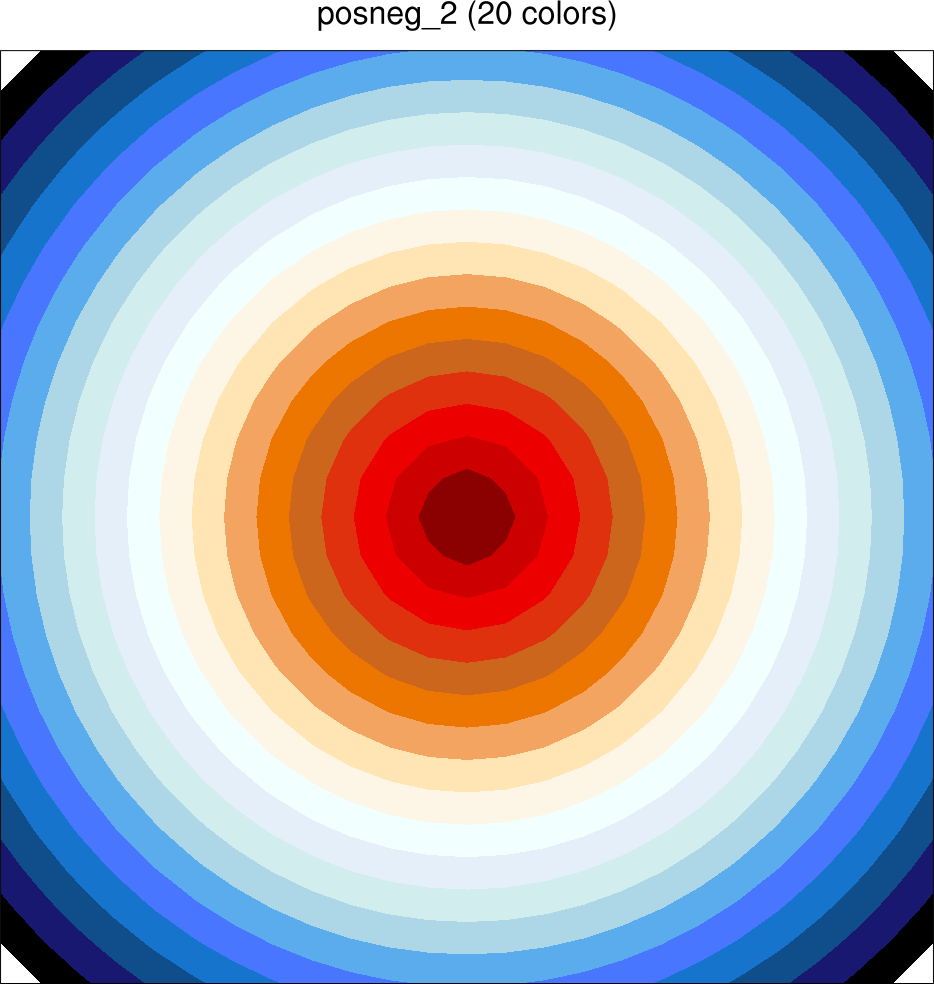
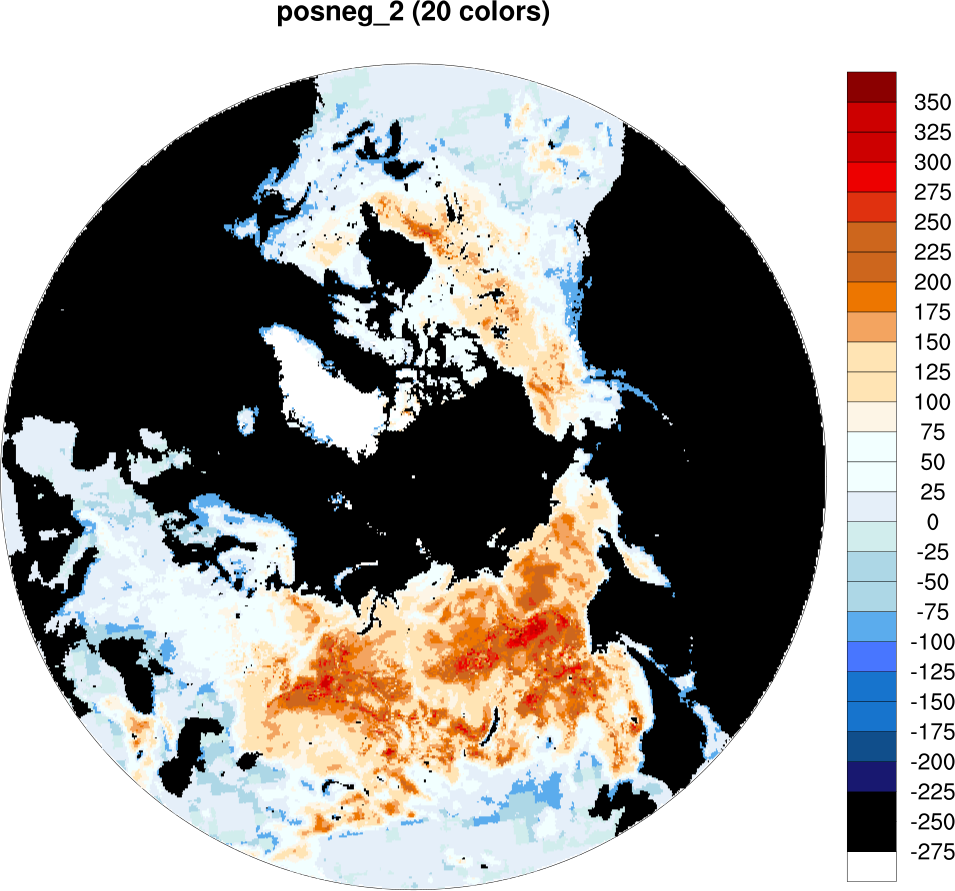
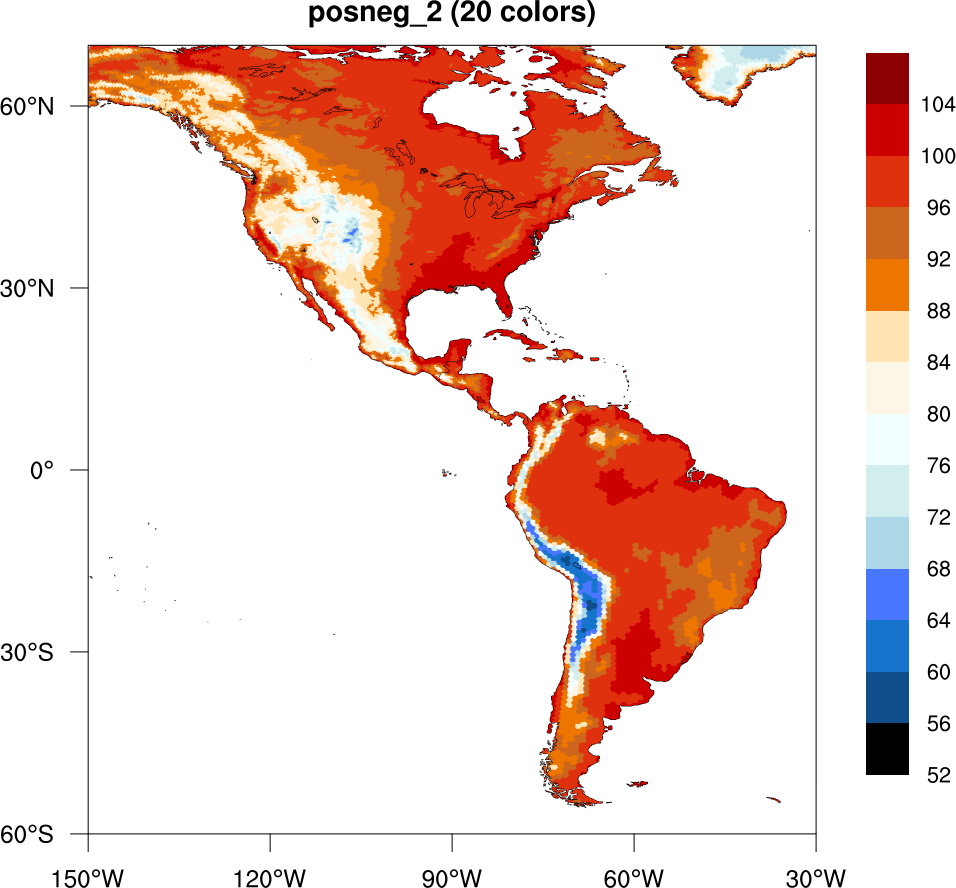
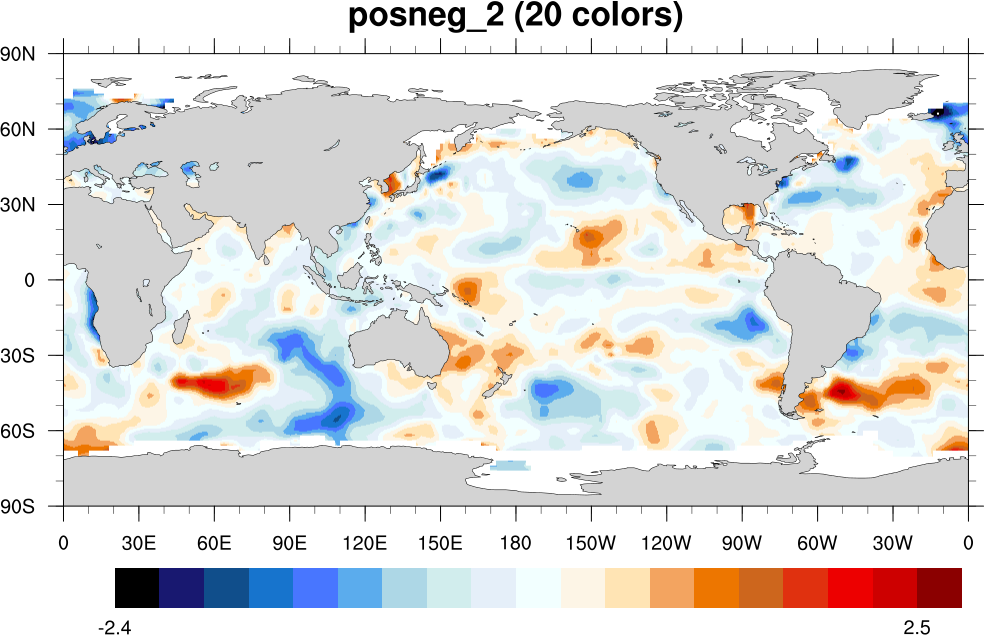
Available in version 6.1.2 and later.
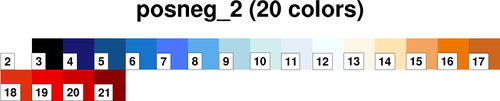
[Color index 0 = white / color index 1 = black]
[Download posneg_2.rgb file and put in $NCARG_ROOT/lib/ncarg/colormaps]
|

|
|
|---|---|---|
|
|

|

|
Sample NCL script usages:
;---Using the color map to define colors for contours or vectors
  res@cnFillPalette = "posneg_2"
  res@vcLevelPalette = "posneg_2"

;---Reading the colormap into an N x 4 (RGBA) array
  cmap = read_colormap_file("posneg_2")

;---Using the color map to define a color map for the workstation
  gsn_define_colormap(wks,"posneg_2")